Visualization of Complex Structures on Mobile Handhelds Bernd Karstens University of Rostock Computer Science Department
Matthias Kreuseler SD-Industries GmbH Rostock
Heidrun Schumann University of Rostock Computer Science Department
[email protected]
[email protected]
[email protected]
Abstract Information Visualization has become an important research topic in Computer Graphics. One key issue of this topic is the visual presentation of intrinsic structures of complex information spaces. Today nearly all approaches of structure visualization are designed for none-mobile devices such as PCs or workstations. However, mobile handhelds have become more popular in recent years, and are increasingly used in different application domains. Limited resources of these devices require new paradigms for information presentation and interaction such as new methods for structure visualization based on new metaphors for efficient screen space usage. This paper describes how recent techniques of structure visualization can be adapted or redesigned for mobile pocket-sized devices.
1. Introduction Small mobile devices have become more powerful and popular, and are used in many different application areas. However, mobile handhelds are still not as powerful as full fledged PCs or workstations. Limitations arise especially due to limited hardware resources such as screen space, interaction facilities and computational power (see tab 1). Feature
Desktop-PC
Mobile Handheld
Computational Power
High
low
Storage facilities
Capacious
low
Power supply
grid
battery
Screen Space
sizable
small
Color facilities
many
few
Input facilities
Mouse, keyboard Pen, buttons
Table 1: Comparison of the resources of desktop PCs and mobile Handhelds
In the near future wireless mobile access of data and information based on handhelds will become as popular as browsing the World Wide Web today. Therefore, new strategies for data access, presentation and interaction have to be developed in order to achieve efficient and intuitive applications for these devices. One approach for presenting information on palmsize devices is using advanced information visualization techniques for displaying and navigating structures of complex information spaces. Since the screen space of mobile handhelds is very limited, only small parts of information can be presented at a time. Thus techniques from information visualization have to be extended accordingly. In order to avoid extensive scrolling and panning, new mechanisms for searching and finding interesting information have to be provided. This can be done by showing relationships between several information objects. Consequently, navigation and user orientation can be supported as well. This paper presents two examples of structure visualization on pocket-sized devices. Basics are briefly described in section 2. Section 3 discusses requirements and the general procedure for structure visualization, and presents two examples for visualizing hierarchies on mobile handhelds. Conclusions and aspects of future work will close our contribution in section 4.
2. Basics Information visualization can be described as “the use of computer-supported, interactive, visual representations of abstract data to amplify cognition” [7]. This includes the process of transforming abstract data into an appropriate visual form. We follow Bertin [3] to describe the data representing the information and distinguish between information content and information structure, in which the information is organized. Information visualization provides many efficient techniques for visualizing information content as well as for displaying
information structures. The work presented in this paper is focused on information structures, especially on the visualization of hierarchies. Many applications are based on hierarchies. Hierarchies can be used to flexibly store structural information. Moreover, arbitrary graphs can be transformed into hierarchies [1]. Since hierarchies allow an efficient control of the number of nodes to be presented, they can be used to control the display space needed for the visualization. This feature is extremely valuable for the visualization on mobile devices with small screens. Many different methods for visualizing hierarchies have been developed. These methods can be classified as follows: -
Explicit vs. implicit Explicit methods (classical tree drawings) draw one line for each relation between hierarchy elements. Implicit methods are space-filling techniques. They show relations based on special arrangements of graphical objects which represent the hierarchy nodes. rectangles for (TREEMAPS [22] use nested representing hierarchies.)
-
Horizontal vs. radial Horizntal layouts use parallel horizontal lines for arranging nodes. Each line represents one hierarchy level. All nodes at the same hierarchy level are placed at the same related line. Radial layouts are based on concentric circles. Each circle represents one hierarchy level. Nodes of the same hierarchy level are placed along the same circle. The root node of the hierarchy is placed in the center of the concentric circles.
-
2D vs. 3D 2D layouts display hierarchies in a 2D presentation space based on 2D elements. In contrast, 3D representations are used to layout hierarchies in 3D space.
Traditional hierarchy drawing methods (explicit 2Dtechniques with horizontal layout) typically display about 100 nodes [18]. The HYPERBOLIC VIEWER [18] or the MAGIC EYE VIEW [16] (explicit techniques with radial layout) increase this number by applying FOCUS & CONTEXT mechanisms. Both techniques save screen space by showing only the nodes of special interest (focus) in an enlarged area while displaying the remaining hierarchy nodes (context) with reduced size. These techniques are able to depict hierarchies with about 1000 nodes. Popular examples for space-filling techniques are TREEMAPS [22] with horizontal and SUNBURST [23] with radial arrangement of geometric primitives. These techniquese
can also represent about 1000 nodes, and in special cases up to 5000 nodes. However, in these cases it is very hard to interpret the image. CONE TREES [21] are well-known 3D representations of hierarchical structures. A tree node is placed at the apex of a cone in 3D. The child nodes are arranged around the cone’s circular base. Disk Trees [14] extend CONE TREEs by introducing additional degrees of freedom for controlling the tree layout. It is obvious that 3D techniques require more resources than 2D techniques. In nearly all cases 3D exceeds the computational power of today’s pocket-sized devices. Furthermore, since traditional explicit horizontal techniques need more space than other techniques, they are also not very suitable for small displays, i.e. for mobile handhelds. To support navigation and orientation of complex information spaces by drawing the underlaying structure we need techniques which address the small screen space. FOCUS & CONTEXT-Techniques [19], [15] fulfill this requirement. They combine a detailed focus view and a reduced context view in one image. The context view provides an overview. The context view is distorted depending on the distance from the focus to reduce space requirements. These concepts are used for structure visualization as mentioned above, and apply to user interfaces on mobile handhelds as well [4],[10],[5]. Another approach for reducing the demand of display space is reducing the amount of displayed information. This can be achieved with information hiding techniques. A first approach to information hiding is the FILTER FISHEYE VIEW [11], where information is hidden based on the distance to a point of interest. Further examples of information hiding, especially useful for mobile handhelds, are EVENT HORIZON, which can be considered an abstraction of a certain subset of information elements [24], SECTION OUTLINING based on text filtering and generation of abstracts [6], or POWER BROWSER [5] with image removal or scaling. [17] uses FOCUS & CONTEXTTechniques together with information hiding for browsing the World Wide web via mobile handhelds.
3. Visualization of hierarchical structures on mobile handhelds Many structure visualization approaches have been developed for PCs and workstations. Using these techniques for mobile handhelds introduces many unsolved problems. Based on a description of these problems we will derive requirements and show a general procedure how to adapt or design visualization techniques for mobile handhelds. Moreover, we will discuss 2 case studies for visualizing hierarchies on palmsize devices.
3.1. Requirements Since mobile handhelds suffer from limited resources, such as screen space, interaction facilities and computational power, visualization techniques have to be adapted in order to be used on pocket-sized devices. Therefore the following three aspects have to be considered: - Reducing the computational complexity of the visualization techniques, - Addressing the limited screen space, and - Adaptation of the user interface. Reducing computational complexity of visualization techniques Supporting efficient and smooth navigation of complex information spaces requires high framerates, i.e. fast display updates. In order to achieve this on mobile devices the computational requirements of the visualization techniques have to be reduced. This can be done by decreasing the complexity of the graphical presentations and/or by reducing the amount of displayed information. The computational costs for graphical output can be reduced significantly by: - using 2D primitives instead of 3D primitives, - using simple primitives instead of curved or complex primitives, - restricting the number of graphical features (e.g. αBlending), - applying simple output functions e.g. for distortion computations of context views. Information hiding techniques provide valuable mechanisms for reducing the amount of information that has to be displayed. In particular, these techniques can easily be applied to hierarchical structures. A simple but intuitive approach is restricting the number of displayed levels. The EVENT HORIZON [24] introduces an interesting concept to implement this idea. The approach exploits compression and expansion of graphical representations based on radial movement of objects. Each object is placed at a certain distance from a so-called event horizon in the center of the display. This event horizon serves as a virtual container (sink) in which objects are stored when the display is compressed, i.e. objects “disappear in the sink” when moved radially towards the center of the display. Thus, the event horizon can be considered a graphical abstraction of a certain set of objects according to user interaction. This concept can be applied to hierarchy visualization as well. In the beginning, the event horizon contains the root of the hierarchy. Navigation is performed by moving nodes towards the event horizon. Note that all nodes of a hierarchy level are “sucked in the sink” at the same time. If the set of nodes in the event
horizon is large, i.e. a substantial number of upper levels is hidden - deeper hierarchy levels can be explored. If this set is relatively small, upper levels near the root node are visible. Another way of information hiding is restricting the number of displayed subtrees. Subtrees of less importance are folded, i.e. only interesting parts of the hierarchy remain visible in the display. [13] describes an approach for folding and unfolding substructures automatically. Unfortunately, this approach is expensive in terms of computational costs and therefore hard to use on mobile handhelds. Interactive functions have to be provided instead for selecting nodes and folding the entire subtree below. Folded nodes have to be marked by color or shape. Selecting a folded node restores the previous structure by unfolding the subtree below. Addressing the limited screen space Limited screen space is a key limitation of ultra mobile handhelds. While computational power or color capabilities are growing steadily, screen size will remain a limiting factor in the future. That means, reducing space requirements will be a persistent research request. There are two main approaches for handling the small screen size. One suitable concept is applying information hiding methods as discussed above. Another approach is using FOCUS & CONTEXT-Techniques. Since the focus area is always a restricted portion of the whole information space, reducing the size of the elements in the context area decreases the size of the graphical representation considerably. An example for this is given in [17] which describes the output of large raster images on small displays. Adapting the user interface Desktop PCs and mobile handhelds have different input capabilities. While keyboard and mouse are the typical input devices of a PC - handhelds usually work based on input pens. Moreover, interaction with elements is much harder on small displays because of the very small element sizes and small distances between them. Therefore, we have to simplify interaction by providing a few basic and easy to handle input functions. Considering the visualization of hierarchies on palmsize devices, we need at least the following input functions: - Clicking nodes for annotation, folding and unfolding subtrees, selecting focus nodes etc., - Clicking buttons for activating special functions such as controlling the display, resetting transformations, selecting or changing the representation of the graphical output, browsing different views including textual output, etc, - Clicking menu items for more general functions such as loading a file or setting graphical attributes.
Note that mobile handhelds do not have graphical or mouse cursors. Mouse events such as “mouse over . .” do not exist. That’s why clicking has to be implemented based on a pen by pointing or staying at a position, or moving the pen. Summarizing the previously discussed requirements we can derive a general procedure for adapting visualization techniques for mobile handhelds: -
Reduce the number of elements to be displayed: o Define appropriate limits for the display (e.g. number of levels of a tree which can be presented). o Include appropriate mechanisms for selecting and hiding information elements. o Specify intuitive mechanisms to access hidden information.
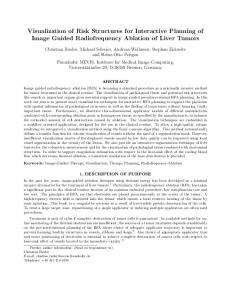
projection is introduced in order to achieve a FOCUS & CONTEXT display. Applying this projection allows smooth transitions between focus area and context regions. For this projection, rays are computed from the center of projection p0 which is initially located at the hemisphere’s origin through each node on the hemisphere, i.e. the directions of the rays are determined by the nodes’ initial positions at the hemisphere. For changing focus, the center of projection p0 can be moved arbitrarily, whereby the directions of the rays are retained. New positions of the hierarchy nodes are obtained by computing the new intersection points of the rays with the hemisphere. Thus the distances between nodes are increased or decreased depending on the position of p0. By increasing the distance between nodes we obtain more space for showing details (focus) while maintaining context information (see figure 1).
- Reduce the complexity of the graphical output o o o o
Use 2D graphics. Simplify graphical primitives. Decrease the number of colors to be used. Substitute (if necessary) more complex graphical facilities by easier functions (e.g. replace αBlending by a simple overwrite modus).
-
Integrate mechanisms to address the small display area. o Decide which elements have to been drawn in which granularity. o Specify an appropriate mechanism to combine overview and detail views (by linking different views or by applying FOCUS & CONTEXTTechniques).
-
Reduce and simplify interaction functionality. o Define suitable default actions. o Integrate actions that are easy to handle by a pen. o Use (if possible) little buttons with easy to understand icons instead of textual menus.
We have applied the procedure discussed above in 2 case studies for structure visualization on mobile handhelds. First we show the adaptation of the technique MAGIC EYE VIEW for visualizing hierarchies. Secondly we introduce the RECTANGULAR VIEW, a new technique designed for displaying more general networks on mobile handhelds.
3.2. The MAGIC EYE VIEW for mobile handhelds The MAGIC EYE VIEW [16] was designed for regular PCs or workstations. The technique is based on a 2D hierarchy layout, which is mapped onto a hemisphere such that each hierarchy node is located at the hemisphere’s surface after the mapping. Furthermore a
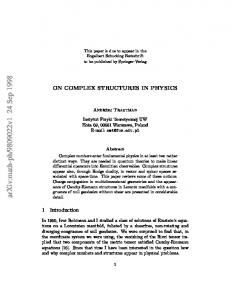
Figure 1: Projection rays before and after moving p0 Furthermore, we introduce colored rings for minimizing the amount of confusion which may be caused by applying the projection. Based on different colours hierarchy levels can be distinguished very easy (fig 2).
Figure 2: An orthogonal View of the MAGIC EYE VIEW with about 1000 nodes
Since real interactive 3D FOCUS & CONTEXT visualization exceeds the capabilities of pocket-sized devices we have to customize this technique in order to use it on mobile handhelds. According to the procedure discussed in 3.1 the steps described below have been applied (see [8]):
Reducing the number of elements to be displayed The user has to specify the maximum number of levels which can be displayed at a time. This should be done interactively. Users experience is needed especially because of the different display capabilities of today’s variety of mobile handhelds and due to different application requirements. Determining visible levels in the EVENT HORIZON [24] is done as discussed in the previous section. An effective exploration of hierarchical structures based on the EVENT HORIZON requires to provide visual feedback about how many nodes (levels) are inside the event horizon (sink). A small circle is used to depict the current state of the event horizon or “sink”. This circle can be drawn in one of the following 3 different styles: -
Minigraph The structure inside the event horizon is abstracted by an iconographic view. Only little edges are used to create a minimized representation of the level structure inside the sink.
-
Circlets (concentric circles) The sink is represented by small concentric circles. Each circles represents one hierarchy level inside the sink.
-
Symbol One little color coded circle is drawn whereas the color reflects the number of nodes in the sink.
Figure 3: Different views of the event horizon: Minigraph with Circlets, Symbols
The three alternatives try to provide a tradeoff between minimum loss of information (Minigraph) and minimum space requirements in the display (Symbol). Figure 3 illustrates the drawing styles. Furthermore, subtrees can be folded and unfolded to reduce the complexity of the hierarchy. Arbitrary nodes of the structure can be selected and the entire subtrees below will be folded (hidden). Only the root node of a folded tree (i.e. the previously selected node) remains visible and is marked as folded. The reverse operation is applied
when selecting a folded node, i.e. the entire subtree below will be unfolded and displayed. Reducing the complexity of the graphical output Instead of 3D, a 2D representation of the Magic Eye View is used. This is done by an orthogonal projection of the hierarchy onto a circular 2D display region. Furthermore, simple graphical primitives such as circles, triangles and straight lines are used instead of 3D primitives and curves. Replacing curves with straight lines for edge drawing curves may cause overlapping problems. Therefore, curve drawing is still offered as an option at the cost of slowing down display performance. Integrating mechanisms to address the small display area The original MAGIC EYE VIEW provides FOCUS & CONTEXT-functionality by defining and moving a center of projection in 3D space. Since we are using a 2D approach the FOCUS & CONTEXT-view is simplified by moving nodes in 2D either towards (moving into focus) or away (moving into context) from the center of the circular display region. Figure 4 gives an example for the MAGIC EYE VIEW on a mobile handheld.
Figure 4: Visualization of hierarchical structures the MAGIC EYE VIEW on a mobile handheld
Simplifying interaction functionality The original MAGIC EYE VIEW provides rich interaction functionality such as 3D transformations (zoom, rotation or translation), focusing areas, folding and unfolding subtrees, changing parameter values, annotations etc. While 3D functions are not needed for mobile handheld the remaining operations are implemented based on the available input mechanisms. Nearly all interactions can be done via the input pen especially pointing with the pen (for annotation or folding) or moving the pen for focusing should be mentioned.
Summarizing the discussion above, we can state that it is possible to use the MAGIC EYE VIEW on mobile handhelds for about 1000 nodes in interactive time. Among other things we have used the original Magic Eye View as a visual interface to represent a huge ontology in the field of tourism industry. Now, we can provide this functionality at mobile handhelds as well. For example a mobile user can click at a node on his handheld, representing relevant topics from tourism industry, to be informed e.g. about hotels, restaurants or cultural events in his direct environment.
3.3. The RECTANGLE VIEW for mobile handhelds The RECTANGULAR VIEW was developed for displaying and interacting with large networks on mobile handhelds. The scenario to use these technique is: a user can browse on a network of nodes and edges in a level of detail and select nodes which represents other levels or pieces of information. New levels or underlying information can be provided in conjunction with a server if necessary. First of all, one might ask - what kind of graph is easy to compute and to display on a mobile handheld with a small display area and a 33 MHz CPU? Hierarchical structures containing a root node and nodes arranged in levels offer advantageous preconditions to compute effective layouts, especially for mobile handhelds. This is not the case with more general networks. In our example we want to display a given large graph with 3389 nodes and 7311 edges on a Palm handheld. We have to find appropriate layouts for these graphs. These layouts should be easy to compute und should not produce edge crossings or unnecessary holes. Most layout algorithms for networks are very expensive to compute, such as force directed methods which compute optimal layouts based on the physical analogy of spring forces. Another common problem with existing graph layouts are undesired global layout changes when nodes or subgraphs are inserted or deleted from the graph. Thus we use a hierarchical layer based algorithm for graph display on mobile handhelds: the original method presented by Sugijama, Tawa and Toda 1981. Improvements of the algorithm are introduced and published in [2]. The algorithm contains three steps: -
Layer Assignment The nodes of the graph are assigned to layers. Dummy nodes are inserted if nodes are more than on layer apart.
-
Crossing reduction The nodes and subgraphs are permuted to minimize the number of edge crossing.
-
Alignment The nodes in a layer are aligned horizontally.
As mentioned above classical horizontal layouts can only display about 100 nodes. In order to extend the number of displayable nodes we apply a radial layout, but arrange the levels as squares, and not as circles around the root in the centre of the screen. Thus we exploit the rectangular screen space more efficient. Moreover, this approach is very fast because node alignments require only one incremental integer addition per node. However, a disadvantage of this method is the necessary decision, at which side of the square a node has to be placed. If one node is mapped onto one side of the square the subtree below has to be placed at the same side. Thus arranging the children of the root along the four sides of the square influences the appearance of the layout tremendously. This arrangement is done by exploring the complexity of the substructures. The introduced approach exceeds the computation power of a Palm-device. Therefore we have to decide which parts of the algorithm have to be computed on a PC and which on the mobile handheld. One suitable way is computing layer assignment and crossing reduction on the PC, and transferring a hierarchical graph to the mobile handheld. Each transferred node is associated with a level of the hierarchy and a side of the square. The mobile handheld provides the following functions: Specifying the number of levels to be displayed, computation of the exact position in the RECTANGLE VIEW, and interaction facilities with the graph. Since computing and drawing hierarchies of large graphs is time consuming and complex, we restrict the dimension of the hierarchy to be computed. Our solution uses the Coffmann-Graham-Layering to find layers with a minimum width (number of nodes without dummy nodes per layer). Nodes which were not assigned by this procedure are stored in separate substructures. In our example the graph with 3389 nodes was transformed into a hierarchy with 332 nodes and several substructures. The hierarchy and the subgraphs are converted into separate data bases and transferred to the Palm. The described procedure fulfils the requirements of section 3.1 as follow [20]: Reducing the number of elements to be displayed Not all nodes of the original graph are inserted into the hierarchy. The hierarchy is limited to 400 nodes. This is because we have found that it is impossible to display more nodes at the same time on mobile handhelds. The number of displayed layers can be adjusted by zooming. Moreover, subgraphs can be folded in order to provide more space for the remaining nodes.
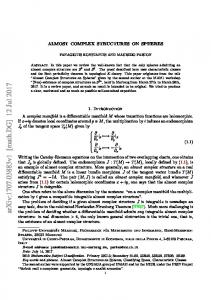
Reducing the complexity of graphical output The RECTANGULAR VIEW is a 2D-technique. Only simple primitives such as lines and points are used. The calculations of node positions only require incremental integer addition. Therefore, changes of the layout are fast and easy to compute. Furthermore, color-coding of nodes is restricted to a very few colors. Leaf nodes are green, nodes with children are red and folded nodes are brownish. Thus it is easy to distinguish “root nodes” of folded subtrees from real leafs. An extra color is used to mark all nodes with underlying graphs (see Figure 5).
Figure 5: Visualization of a graph with the RECTANGULAR VIEW: Left: Full hierarchy with 332 nodes; Right: Zoomed hierarchy with many folded subgraphs - nodes with underlying graphs are black
Integrating mechanisms to address the small display area Applying radial layouts in order to avoid scrolling amplifies the cognition of the graph. Using a square instead of a circle enlarges the available space for each layer, if the diameter of the circle and the edge size of the square are equal. Placing a node and its entire subtree at the same side of a square (as it is done by the layout algorithm) has another major advantage - user orientation after folding subtrees is supported much better than in a circle based layout.
Simplifying interaction functionality The presentation starts with the full hierarchy. The layout can be changed by selecting nodes and folding its subgraphs below. An alternative for changing the presentation is using toolbar buttons. The buttons (at the left hand side) can be used for zooming in and out, showing the mark of a node, drawing the underlying graph or showing a history. Textual information can be presented at the status bar at the bottom of the window.
4. Conclusions The visualization of information structures on mobile handhelds requires special algorithmic solutions to address the limited resources of these devices such as screen space, computational power and interaction capabilities. However, this is an interesting and promising research task. Since only small parts of complex information spaces can be present at once, different views of information subsets have to be interconnected, and navigation and user orientation have to be supported. Visualizing the relationships between those information objects which represent the main characteristics of the entire information space is a suitable way to solve this task. We have discussed general aspects of presentation generation at mobile handhelds. Moreover, we described two techniques for hierarchy visualization for these devices. Both techniques work in real time on palms. The RECTANGULAR VIEW is able to handle structures with 3389 nodes at once. We found this is a good number to show relevant parts of complex information spaces.
5. Acknowledgement The authors wish to thank our students Robert Repnak and Oliver Dannat for their dedicated work while implementing the introduced concepts on CE devices. Special thanks to Jeff Korn from AT&T Shannon research labs at Florham Park, NJ for proof reading our English.
10. References
Figure 6: A hierarchy node’s underlying graph.
[1] Abello J.; Korn, J.: MGV: A system for visualizing massive multi-digraphs, Transactions on Visualization and Computer Graphics, 2001. [2] Di Battista, Giuseppe; Eades, Peter; Tamissia, Roberto; Tollis, Ionnis, G.: Graph Drawing. Prentice Hall , New Jersey 1999. [3] Bertin, J.: Graphics and Graphic Information Processing, deGruyter Press, Berlin 1977 . [4] Björk,S.; Holmquist, L.E.; Redström, J.; Bretan, I. Danielson, R.; Karlgren, J.; Franzén, K.: West: a Web Browser for small terminals. Proc. ACM Conference on User Interface Software an Technology 1999, ACM Press, 1999.
[5] Buyukokten, O.; Molina, H.G.; Paepcke, A. Winograd, T.: Power Browser: Efficient web browsing for pdas. Technical report, Stanford University, Stanford, 2000. [6] Brown, M.H.; Weihl, W.E. : Zippers: A focus+context display of web pages. Technical Report SRC-140, Digital SRC Research Report, 1996. [7] Card, S. K.; Mackinlay, J. D.; Shneiderman, B. (eds.): Readings in Information Visualization – Using Vision to Think. Morgan Kaufman, San Francisco, CA, 1999. [8] Dannat, O.: Visualisierung von Hierarchien auf dem PDA, Studienarbeit, Department of Computer Science, University of Rostock, 2002, in German [9] DiBattista et al: Graph Drawing Algorithms for the Visualization of Graphs. Prentice Hall, Upper Saddle River, N.J., 1999. [10] Fishers, B.; Agedelidis, G..; Dill, J.; Tan, P.; Collaud, G.; Jones, C.: Czweb: Fisheye views for visualizing the world-wide web, 1997. [11] Furnas, G.W.: The fisheye view: a new look at structured files. Technical Report, Bell Laboratories, 1981. [12] Hearst, M.A.: User Interfaces and Visualization, in: Baeza-Yates, R.; and Ribeiro-Net, B. (eds.): Modern Information Retrieval, Addison-Wesley, Harlow, 1999. [13] Herman, I.; Melançon, G.; Delest, M.: Tree Visualization and Navigation Clues for Information Visualization. Computer Graphics Forum, Vol. 17, 1998, pp. 153-165. [14] Jeong, C.-S.; Pang, A.: Reconfigurable Disc Trees for Visualizing Large Hierarchical Information Space. Proc. Vis’98, IEEE Visualization, Research Triangle Park NC, 1998. [15] Keahey, T.A.: The Generalized Detail-In-Context Problem. Proc. Vis’98, IEEE Visualization, Research Triangle Park NC, 1998.
[16] Kreuseler, M.; Lopez, N.; Schumann, H.: A scalable Framework for Information Visualization; INFOVIS'2000, Salt Lake City, USA, Oktober 2000 [17] Karstens, B.; Rosenbaum, R.; Schumann, H.: Visual Interfaces for Mobile Handhelds. Proceedings HCII, Crete, Greece, Juni, 2003 [18] Lamping, J. et al.: A focus+context technique based on hyperbolic geometry for viewing large hierarchies. ACM Proceedings CHI’95, Denver, May, 1995, pp. 401-408. [19] Leung, Y.K.; Apperley, M.D.. A Review and Taxonomy of Distortion – Oriented Presentation Techniques. ACM Transactions on Computer-Human-Interaction, Vol. 1, 2, 1994, pp. 126-160. [20] Repnak, R.: Darstellung von Netzwerken auf mobilen Handhelds, Master thesis, Department of Computer Science, University of Rostock, 2002, in German [21] Robertson, G.G; Mackinlay, J.D.; Card, S.K.: Cone Trees: Animated 3D Visualizations of Hierarchical Information. Proceedings ACM CHI International Conference on Human Factors in Computing (CHI’91), 1991, pp. 189-194. [22] Shneiderman, B.: Tree Visualization with Treemaps: A 2D Space Filling Approach. ACM Transactions on Graphics, Vol.11, No. 1, 1992, S. 92-99 [23] Stasko, J.; Zhang, E.: "Focus+Context Display and Navigation Techniques for Enhancing Radial, Space-Filling Hierarchy Visualizations, Proc. IEEE Information Visualization 2000, Salt Lake City, UT, Oct. 2000, pp. 57-65. [24] Taivalsaari, A.: The Event Horizon Interface Model for Small Devices, Technical Report TR-99-74, SUN Microsystem Laboratories, 1999