Methodology we propose was tested by an experienced radiologist in a blind study using 40 images from the University of South Florida Digital Database.
Wavelet Image Interpolation (WII):A Wavelet-based Approach to Enhancement of Digital Mammography Images G. Derado1 , D. Bowman1 , R. Patel2 , M. Newell3 , B. Vidakovic4 1
Emory University, Atlanta, GA Emory University / Amgen Inc. 3 Winship Cancer Institute, Atlanta, GA Georgia Institute of Technology and Emory University, Atlanta, GA 2
4
Abstract. Cancer detection using mammography focuses on characteristics of tiny microcalcifications, including the number, size, and spatial arrangement of microcalcification clusters as well as morphological features of individual microcalcifications. We developed state-of-theart wavelet-based methods to enhance the resolution of microcalcifications visible in digital mammograms, thereby improving the specificity of breast cancer diagnoses. In our research, we develop, refine, and evaluate a Wavelet Image Interpolation (WII) procedure and create accompanying software to implement it. WII involves the application of an inverse wavelet transformation to a coarse or degraded image and constructed detail coefficients to produce an enhanced higher resolution image. The construction of detail coefficients is supervised by the observed image and innate regular scaling assessed by a statistical model. Methodology we propose was tested by an experienced radiologist in a blind study using 40 images from the University of South Florida Digital Database for Screening Mammography (DDSM) (Heat et. al. [10]).
1
Introduction
In the United States, breast cancer is the second leading cause of death in women. One out of eight women will develop breast cancer in their lifetime. Studies have indicated that early detection and treatment improve the chances of survival for breast cancer patients (Curpen et al. [6], Smart et al [20]). At present, mammography is the only proven method that can detect minimal breast cancers. Attempts to increase the specificity of mammmographic diagnoses, and therefore to reduce the number of unnecessary surgical operations, are based on the evaluation of the number , size, and spatial arrangement of clustered microcalcifications (Millis et al [18]) as well as morphological features of single microcalcifications (Egan et al. [8]). We propose the development and application of novel wavelet-based methods for improving cancer diagnoses by enhancing key features of microcalcifications in digital mammography. Although there are several objects/features in a mammogram image that are critical for diagnosis of cancer (Fibroadenomas, phylloides, etc.), our research
focuses on microcalcifications. About half of the cancers detected by mammography appear as a cluster of microcalcifications. Microcalcifications are the most common mammographic sign of ductal carcinoma in situ (DCIS), which is an early stage cancer confined to the breast ducts. Almost 90% of DCIS cases are associated with microcalcifications. In addition to specific clustering, the irregularity of microcalcification shapes is an important attribute. Pleomorphic, polymorphic or multiform are synonyms for an irregular shape or variability of shapes which can indicate DCIS. Such microcalcifications are usually more conspicuous than the amorphic forms (Coakley and van Doorn [5]). Another malignant form includes fine, linear or fine, linear, branching calcifications. These are thin, irregular calcifications that appear linear, but are discontinuous and under 0.5 mm in width. Their appearance suggests filling of the lumen of a duct involved irregularly by breast cancer. The main goal of this research was to generate a procedure for enhancing the digital mammography images, based on wavelet transform methods. 1.1
Brief Overview of the Discrete Wavelet Transformation (DWT)
Let y be a data-vector of dimension (size) n. For the simplicity we choose n to be a power of 2, say 2J . Suppose that the vector y is wavelet-transformed to a vector d. This linear and orthogonal transform can be fully described by an n × n orthogonal matrix W. In practice, one performs the DWT without exhibiting the matrix W explicitly, but by using fast filtering algorithms. The filtering procedures are based on so-called quadrature mirror filters which are uniquely determined by the wavelet of choice and fast Mallat’s algorithm (Mallat [15]). The wavelet decomposition of the vector y can be written as d = (H` y, GH`−1 y, . . . , GH2 y, GHy, Gy).
(1)
Note that in (1), d has the same length as y and ` is any fixed number between 1 and J = log2 n. The operators H and G are defined coordinate-wise (Ha)k =
X m∈Z
hm−2k am , and (Ga)k =
X
gm−2k am , k ∈ Z
m∈Z
where g and h are high- and low-pass filters corresponding to the wavelet of choice. Components of g and h are connected via the quadrature mirror relationship gn = (−1)n h1−n . For all commonly used wavelet bases, the taps of filters g and h are readily available in the literature or in standard wavelet software packages. The elements of d are called “wavelet coefficients.” The sub-vectors described in (1) correspond to detail levels in a levelwise organized decomposition. For instance, the vector Gy contains n/2 coefficients representing the level of the finest detail.
In general, jth detail level in the wavelet decomposition of y contains 2j elements, and is given as GHJ−j−1 y = (dj,0 , dj,1 , . . . , dj,2j −1 ).
(2)
Wavelet transform of 2-D objects (images) is performed by applying the univariate transform on rows and columns of a 2-D object. One step of the decomposing algorithm is described next. Consider a digital image A, which is in fact a matrix comprised of pixel values. The process of wavelet decomposition begins by applying the wavelet low pass filter H and high pass filter G to the rows of the matrix A. This step produces two matrices Hr A and Gr A, both of dimension 2n × 2n−1 (the subscripts r suggest that the filters are applied on rows). Next, the filters H and G are applied to the columns of matrices Hr A and Gr A obtained from step one, producing matrices Hc Hr A, Gc Hr A, Hc Gr A and Gc Gr A, each of dimension 2n−1 × 2n−1 . The matrix Hc Hr A is an average or smooth representation of the original image, while the matrices Gc Hr A, Hc Gr A and Gc Gr A contain details lost by degrading A to Hc Hr A. The transform is further carried out by repeating the process on the average matrix Hc Hr A in place of A. 1.2
Previous work
Many computerized methods for detecting clustered microcalcifications based on wavelets have been proposed. Yoshida et.al. [25] use a combined difference-image technique and wavelet transform to detect subtle microcalcifications. First the difference-image technique is used to increase the signal-to-noise ratio of microcalcifications, then the wavelet-based scheme is applied to detect the subtle microcalcifications missed by the first step. To extract small-scale structures, WT uses a fine “probe” that is represented by a small wave. In Lado et.al. [13] a computerized scheme for detecting “both individual microcalcifications in regions of interest (ROIs) and clustered microcalcifications over the complete mammograms, based on the application of two different wavelet transform techniques”(one-dimensional and two-dimensional WT) was proposed. In Wang et. al. [24], an approach for detecting microcalcifications in digital mammograms employing wavelet-based subband image decomposition is presented. In Anastasio, Yoshida et.al. [2] the wavelet transform is employed as a preprocessing step whose goal is to enhance the microcalcifications and suppress the background structure in the mammogram. A parallel-genetic algorithm is used in performing the optimization of the CAD procedure. Strickland et.al. [21] developed a 2-stage method based on wavelet transforms for detection and segmentation of calcifications. The first stage is based on undecimated wavelet transform. In the second stage, detected pixel sites in HH and LH+HL are dilated then weighted before computing the inverse wavelet transform. In Bruce and Adhami [3] the discrete wavelet transform mod-max method was applied to the problem of mammographic mass classification. This method was used to extract multiresolution features that quantify the mass shapes. They
showed that when utilizing a statistical classification system with Euclidian distance measures in determining class membership, the use of multiresolution features significantly increases the classification rates. Ferrari et al. [9] presented a method for the identification of pectoral muscle in MLO mammograms based on the multiresolution technique using Gabor wavelets. Chang et al. [4] developed an enhancement algorithm relying on multiscale wavelet analysis and extracted oriented information at each scale of analysis wa investigated. Another approach to image enhancement of digital mammography images in introduced by Serˇsi´c and Lonˇcari´c in [19]. It consists of three steps: low-frequency tissue density component removal, noise filtering, and microcalcification enhancement. An overview of automatic methods for detection of microcalcifications was given in a recent publication by Thangavel et.al. [22].
2
Description of the data
The collection of images we analyzed was obtained from the University of South Florida’s Digital Database for Screening Mammography (Heat et al. [10]). (http://marathon.csee.usf.edu/Mammography/Database.html). The DDSM is described in details in Heat et al. [11]. Images containing suspicious areas have associated pixel-level “ground truth” information about the locations and types of suspicious regions. We selected a set of cases(studies) from the DDSM from volumes 6 and 7. Each case contains four mammograms (two for each breast, the craniocaudal (CC) and mediolateral oblique (MLO) projections) from a screening exam. We analyzed the data from 10 benign cases and 8 malignant cases, each containing calcifications. The images were scanned on either a HOWTEK 960 or HOWTEK MultiRAD 850 digitizer with a sample rate of 43.5 microns per second at 12 bits per pixel. They were stored in a format using lossless JPEG compression. However, even with the compression, each image file is quite large because the films were scanned with resolution between 42 and 100 microns. The source code for the program used to compress, as well as the program used to uncompress the images are available to download from the web site.
3
Methodology
Wavelets have been applied for image enhancement since the early 1990’s, and some of the prime applications are in digital mammography (Aldroubi and Unser [1], Heinlein et al. [12], Lemaur et al. [14], McLeod et al. [16]; Wang and Karayiannis [24], etc.) Most wavelet-based approaches involve thresholding, a procedure that eliminates background noise. Wavelets are also applied to generate “difference” images in which nonessential background is eliminated. The method proposed in this paper is novel and involves inverse wavelet transforms of low-resolution images. To simplify the exposition of our methods, we present a conceptual description of wavelet image decompositions and illustrate the application of wavelet decompositions in a general setting using a standard
image template from the image processing community. Subsequently, we present a conceptual description of the WII procedure and demonstrate the utility of this approach for digital mammography. Our approach consists of several steps. First, an image enhancement method is used to detect the regions of interest on each image. The area(s) with ROIs are then cropped from the original image. (From now on we will refer to those cropped images as the “original images.”) To confirm that the correct regions were identified, we compare our ROIs with the information available from the DDSM where abnormalities were marked by experienced radiologists. After detecting the regions of interest on images from our data set, a three-level wavelet decomposition is applied to each image. In order to construct informative detail spaces, the WII procedure is combined with a linear regression approach, based on pixel intensity scaling after which thresholding is applied on the resulting images. Finally, the 2-D inverse wavelet transform was applied with the original image as the smooth part and the estimated informative details to obtained the higher resolution enhanced image of microcalcifications. We now describe each of these steps in more detail.
3.1
Detection of Regions of Interest (ROI)
We first consider an algorithm similar to that presented in Serˇsi´c and Lonˇcari´c [19] which aims to detect microcalcifications between 0.1mm and 1mm in diameter. Thus, in an original digital mammogram of 50µm × 50µm resolution, a microcalcification may appear to be 2 to 20 pixels wide. A 5-level redundant 2D wavelet decomposition on the original mammogram yields detail coefficients with a spatial resolution from 0.1mm×0.1mm to 1.6mm×1.6mm, thus encompassing the range of microcalcification size considered. Wavelet coefficient images corresponding to the first level detail coefficients seem to mostly spatially white noise in the absence of microcalcifications between 0.05mm and 0.1mm in diameter. However, the detail coefficients of levels 2 − 5, the mammogram signal becomes apparent and microcalcifications begin to visually emerge from the background noise. The approximation coefficients at the 5th level contain the low frequency mammogram information such as tissue density and breast shape information. Several different wavelet families are considered for the ROI detection algorithm, but 2D polyharmonic B-spline wavelets with quincunx subsampling (see Van de Ville et. al. [23]) are utilized due to their symmetry and lack of directional (horizontal, vertical, and diagonal) bias in the detection of microcalcifications. A significant difference between the algorithm presented here and that given in [19] is the use of a 2-D non-separable polyharmonic wavelet basis which introduces no directional bias due to the quincunx based subsampling scheme. The algorithm presented by [19] utilizes recursive 1-D decompositions which favor horizontal, vertical, and diagonal directions which may bias the structure of the microcalcifications.
3.2
WII procedure
The proposed WII procedure is conceptually simple. If the forward wavelet transform, described previously, degrades an image by decomposition into a smooth part and the details, then the inverse wavelet transform performed on a degraded image will interpolate the image and reveal a higher degree of details. Operationally, the procedure proceeds as follows: 1. One starts with an empty image (all entries 0) and performs k wavelet decomposition steps. Of course, the transform is linear and the resulting smooth and detail sub-matrices are all zero-matrices. 2. The degraded image from a digital mammogram is inserted into the position of the smooth matrix containing zeros. This step requires that the degraded input image and the original smooth part have equal dimensions. The detail matrices from step 1 retain the 0 values in all entries. 3. Back-transform the object by k steps. This process increases the resolution of the degraded, pixelized image and contains 4k times the number of pixels in the original input For example, a three-step transform produces an enhanced image with 64 times the number of pixels in the original degraded image. The main contribution of our algorithm is building detail spaces based on degraded image and general scaling properties of natural images. 3.3
Imputing Details
In wavelet-inverting the structure consisting of pixelized image as the smooth part and three matrices of the same size as details we assumed that the detail coefficients are all zeros. Such assumption was equivalent to wavelet-based interpolation of the pixelized image. It is natural to propose utilization of detail spaces to further enhance the information in the interpolated image. Several avenues are possible: template details, background details, wavelet-bootstrap by resampling the details, etc. Our proposal is to utilize the self-similarity of wavelet decompositions in building informative detail spaces. Most of the natural images scale and this scaling can be assessed in the wavelet domain. Informally, scaling means that the “energy” (squared wavelet coefficients) cascades when the resolution of wavelet decomposition changes. This is particularly true for some medical images (tissue, bones, cancer, etc). This scaling was described and utilized in statistical inference by many researchers, see Aldrubi and Unser [1] and the references therein. When an image possesses regular scaling this means that the logarithms of average energies in the detail spaces decay linearly when the resolution of scale increases. The standard 2-D wavelet transform have three detail hierarchies: horizontal, vertical, and diagonal; all are characterized by their intrinsic scaling.
In the standard multiresolution hierarchy of images, the representation space Vj is decomposed as (h)
(v)
(d)
Vj = Vj−1 + Wj−1 + Wj−1 + Wj−1 , (h)
(v)
(d)
where the Vj−1 is the coarser representation and Wj−1 , Wj−1 , Wj−1 are spaces of horizontal, vertical, and diagonal details. This representation is nested, and the coarse representation space Vj−1 can be further split in the same fashion. Assume that the direction (h), (v), or (d) of detail spaces is fixed. Suppose that dj;k1 ,k2 is the wavelet coefficient at scale j at the location P (k1 , k2 ) and that Ej is the average of d2j;k1 ,k2 for all (k1 , k2 ), i.e., Ej = N1 (k1 ,k2 ) d2j;k1 ,k2 , where N is total number of coefficients at this particular detail space. By a convention, j is a dyadic index corresponding to a logarithm for base 2 of the scale. The scale decreases (resolution increases) with the increase of index j. Then, log Ej = β0 + β1 × j,
(3)
with the slope β1 characterizing regular scaling. The parameters β0 and β1 in (3) are estimated from the wavelet decomposition by the least-square linear regression on pairs (j, log Ej ) for a properly selected range of scale indices j, j0 ≤ j ≤ j1 . We utilize the intrinsic scaling in natural images to construct informative detail spaces. The algorithm is detailed below. Algorithm description. The procedure begins with a three-level wavelet decomposition of the original coarse image. We denote the components of the first level decomposition by A1 , H1 , V1 , and D1 , and the components of level 2 and level 3 decomposition correspondingly. Data sets were transformed to the wavelet domain utilizing the Daubechies 4 wavelet. To estimate the detail components, we then apply the following regression steps on the components (here illustrated only for horizontal details component): (1)
(1)
H12 = β0 + β1 H22 e
and
(2)
(2)
H22 = β0 + β1 H32 e,
where the components are reshaped into vectors and H22 e and H32 e denote (2) (2) H2 and H3 vectors upsampled using the WII method. As we pointed out, the constant β1 < 0 is connected to the global Hurst exponent; it describes intrinsic self-similarity of the image. Intercept β0 depends on the total energy of the image and does not affect scaling. In our analysis we actually found that the non-intercept model is appropriate. ˆ 1 and H ˆ 2 are estimated as Next, H ˆ 1 = [βˆ(1) + βˆ(1) H 2 e]1/2 H 2 0 1
and
ˆ 2 = [βˆ(2) + βˆ(2) H 2 e]1/2 . H 3 0 1
The sign of the generated detail coefficients is assigned to be the same as the sign in the observed coefficients in the degraded image. From the scaling
property, the scaling coefficient k equals k=
log Ej−1 − log Ej Ej−1 = log . j − (j − 1) Ej
(4)
We then calculate the scaling coefficient k and use it to estimate the horizontal detail component H0 as follows k = log
µ ¯ˆ 2 ¶ H 1
2
¯ˆ H 2 e
µ ¯2 ¶ H0 ⇒ k = log . ¯ˆ 2 H 1 e
From this we approximate H0 as ˆ 2 e]1/2 . ˆ 2 e i.e. H0 = [ek · H H02 = ek · H 1 1 The generated object is “rich” in coefficients; to reduce dimension we apply the threshold, setting small detail coefficients to 0. We choose universal threshold (Donoho and Johnstone, [7]) and note that other shrinkage strategies are possible. √ The threshold λ = 2 log N ·σ is applied on the estimated wavelet coefficients. As an estimator of σ we use MAD (median absolute deviation from the median): σ ˆ=
1 · MAD[d(J−1) ] = 1.4828 · median[|d˜(J−1) − median(d˜(J−1) |], 0.6745
where d˜(J−1) is the vector of finest detail coefficients associated to the multiresolution subspace WJ−1 (assuming the original data “reside” in VJ ). This procedure is repeated for the other two detail components (the vertical and the diagonal). Once we have the estimated detail components, we apply the inverse wavelet transform with our original coarse image as the smooth part and estimated detail components as details, to obtain a higher resolution enhanced image.
4
Results
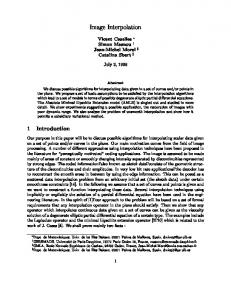
The data analyzed in our study are from the University of South Florida’s Digital Database for Screening Mammography (DDSM) [10]. (For more information see Section 2). We analyzed 8 malignant and 10 benign cases; each case contains 4 mammograms. First the ROI detection method described in Section 3.1 was applied to each of the images. ROIs were cropped to smaller images, which contain calcifications of approximately 0.05-1mm in dimension (in terms of pixels: 20 × 20 to 50 × 50 pixels). Our main algorithm explained in 3.3 can be applied to 2n × 2m pixels size images, it will here be illustrated on 64 × 64 images . Figure 1 shows the result of applying the WII algorithm on an image of a malignant case. We notice a significant improvement from level 0 to level 1 and from level 1 to level 2, while the difference between levels 2 and 3 is barely noticeable.
ca a 1131 right mlo, level 0 5
level 1 10
10
20
15
30
20 40
25 10
20
30
10
level 2
20
30
40
50
level 3
20
50
40 100 60 150
80 20
40
60
80 100
50
100
150
200
Fig. 1. Results of applying WII method on an image of a malignant calcification
The images on Figure 1 were obtained by imputing zeros into the details components of the WII algorithm, with the original image as the smooth part. Figure 2(left) shows another malignant case image (original image) with a cluster of microcalcifications. Figure 2(right) shows the result of our image enhancement algorithm, described in 3.3, applied on image on Figure 2(left). We used the gray scale representation of the image since it was preferred by the clinical radiologist who was making the assessment of the images.
Original
10
20
20
40
30
60
40
80
50
100
60
120 10
20
30
40
50
60
20
40
60
80
100
120
Fig. 2. Results of applying WII algorithm on an image of a malignant calcification(s); left: original image, right: enhanced image
Figure 3(left) shows a benign case image (original image). Figure 3(right) shows the result of the image enhancement algorithm, applied on image on Figure 3(left).
5
Conclusions
Motivated by the ubiquitous presence of regular scaling in the medical images, we propose regression based approach to extrapolate on wavelet coefficients of an image to be enhanced. The observed image and its extrapolated details are then transformed by an inverse wavelet transform and the image of higher resolution is obtained. This process corresponds to a wavelet based image interpolation that is improved by information about regular scaling in detail coefficients. It is found that proposed procedure is efficient and useful in capturing relevant clinical information in the context of mammography imaging. This assessment is made by a clinical radiologist in a blind study involving the 18 cases. Several research avenues are envisioned for a future research. We plan to (i) develop new shrinkage strategies and replace the traditional universal thresh-
Original
10
20
20
40
30
60
40
80
50
100
60
120 10
20
30
40
50
60
20
40
60
80
100
120
Fig. 3. Results of applying WII algorithm on an image of a benign calcification(s); left: original image, right: enhanced image
olding, (ii) select the wavelet optimal for the particular case in hand, and (iii) formalize and expand the evaluation phase with several radiologists involved in a blind repeated measure design study involving an extensive number of cases.
References 1. Aldroubi, A. and Unser, M. A. (1996). Wavelets in Medicine and Biology., CRC Press, Boca Raton FL, 616 p. 2. Anastasio, M., Yoshida, H., Nishikawa, R., Giger, M, dio, K., ”Global Optimization of Wavelet-Based Computer-Aided Diagnosis (CAD) Scheme for the Detection of Clustered Microcalcifications in Digital Mammograms”, Kurt Rossmann Laboratories for Radiologic Image Research, Research Report ... 3. Bruce, L.M. and Adhami, R.R., ”Classifying Mammographic Mass Shapes Using the Wavelet Transform Modulus-Maxima Method”, IEEE Transactions on Medical Imaging, pp. 1170–1177, vol. 18 (12), 1996. 4. Chang, C-M. and Laine, A., ”Coherence of Multiscale Features for Enhancement of Digital Mammograms”, IEEE Transactions on Information Technology in Biomedicine, pp. 32–46, vol. 3(1) 1996. 5. Coakley, K. and van Doorn T. (1995). Invariant moment shape description of microcalcifications in digital mammograms. Australas Phys Eng Sci Med. Jun. 18 (2), 114–118. 6. Curpen, B. N., Sickles, E. A., Sollitto R. A. (1995). The comparative value of mammographic screening for women 40-49 years old versus women 50-59 years old. AJR, 164, 1099–1103. 7. Donoho, D. L. and Johnstone, I. M., “Ideal spatial adaptation via wavelet shrinkage”, Biometrika, 91:425-455, 1994. 8. Egan, R., Sweeney, M., and Sewell, C. (1980). Intramammary calcifications without an associated mass in benign and malignant diseases, Radiology.
9. Ferrari, R.J. Rangayyan, r.M., Desautels, J.E.L., Borges, R.A. and Frere, A.F., ”Automatic Identification of the Pectoral Muscle in Mammograms”, IEEE TRansactions on Medical Imaging, pp. 232–245, vol. 23 (2), 2004. 10. Heath, M., Bowyer, K.W., Kopans, D. et al,“Current status of the Digital Database for Screening Mammography”, pp 457–460, Digital Mammography, Kluwer Academic Publishers, 1998. 11. Heath, M., Bowyer, K., Kopans, D., Moore R., and Kegelmeyer P. Jr. (2000). The Digital Database for Screening Mammography, in The Proceedings of the 5th International Workshop on Digital Mammography (Toronto, Canada, June 2000), Medical Physics Publishing (Madison, WI), ISBN 1-930524-00-5. 12. Heinlein P., Drexl J., and Schneider W. (2003). Integrated wavelets for enhancement of microcalcifications in digital mammography. IEEE Trans. Med. Imag. 22 (3), 402–413. 13. Lado, M.J., Tahoces, P.G., M´endez, P.G., Souto, M. and Vidal, J.J., “A Waveletbased Algorithm for Detecting Clustered Microcalcifications in Digital Mammograms”, Med. Phys., 26(7), July 1999, pp. 1294–1305. 14. Lemaur, K., Drouiche, J., DeConinck, (2003). Highly Regular Wavelets for the Detection of Clustered Microcalcifications in Mammograms, IEEE Trans. Med. Imag., 22(3), 393–401. 15. Mallat, S. (1989). A theory for multiresolution signal decomposition: The wavelet representation. IEEE Trans. Pattern Anal. Machine Intell., 11, 674–693. 16. McLeod G., Parkin G. J. S., and Cowen A. R. (1996). Automatic detection of clustered micro-calcifications using Wavelets, In: , Eds. Doi K, pages 311–316, Publisher: Elsevier Science BV (Amsterdam). 17. Menges, V., Wellauer, J., Engeler, V., and Stadelmann, R. (1973). Correlation of numerically detected microcalcifications on the mammogram and in this manner diagnosed carcinomas and mastopathies, (in German), Radiologe. Nov, 13 (11), 468–476. 18. Millis, R., Davis, A., Stacey, M., Phil, M. (1976). The detection and significance of calcifications in the breast: A radiologic pathologic study, Br. J. Radiol. 19. Serˇsi´c, D. and Lonˇcari´c, S., ”Enhancement of Mammographic Images for Detection of Microcalcifications”, Proceedings of the IX European Signal Processing Conference, Vol. 2, pp. 693-696, Island of Rhodos, Greece, 1998. 20. Smart, C. R., Hendrick, R. E., Rutledge J. H., and Smith, R. A. (1995). Benefit of mammography screening in women ages 40 to 49 years: current evidence from randomized controlled trials, Cancer,75, 1619–1626. 21. Strickland, R.N. and Hahn, H.I., “Wavelet Transform for Detecting Microcalcifications in Mammograms”, IEEE Transactions on Medical Imaging, Vol. 15, No.2, 1996, pp. 218–229. 22. Thangavel, K., Karnan, M., Sivakumar, R. and Mohideen, A.K., “Automatic Detection of Microcalcifications in Mammograms - A Review”, ICGST International Journal on Graphics, Vision and Image Processing, GVIP, 2005. 23. Van de Ville D., Blu T., Unser M., “Isotropic Polyharmonic B-splines: Scaling Functions and Wavelets”, IEEE Transactions on Image Processing. in press. 24. Wang T.C, Karayiannis N.B., “Detection of microcalcifications in digital mammograms using wavelets”, IEEE Trans Med Imaging. 1998 Aug;17(4):498–509. 25. Yoshida, H, Doi, K., Nishikawa, R.M., Ginger, M.L., Schmidt, R.A., “An Improved Computer-Assisted Scheme Using Wavelet Transform for Detecting Clustered Mirocalcifications in Digital images”, Acad Radiol, 1996 (3), pp. 621–627.