Weighted Least-Squares Finite Elements Based On Particle Imaging Velocimetry Data J. J. Heys a,∗ T. A. Manteuffel b S. F. McCormick b M. Milano c J. Westerdale c M. Belohlavek d a Chemical
and Biological Engineering, Montana State University, Bozeman, MT 59717-3920
b Department
of Applied Mathematics, University of Colorado at Boulder, Boulder, CO 80309
c Mechanical
and Aerospace Engineering, Arizona State University, Tempe, AZ 85287
d Translational
Ultrasound Research Laboratory, Division of Cardiovascular Diseases, Mayo Clinic, Scottsdale, AZ 85259
Abstract The solution of the Navier-Stokes equations requires that data about the solution is available along the boundary. In some situations, such as particle imaging velocimetry, there is additional data available along a single plane within the domain, and there is a desire to also incorporate this data into the approximate solution of the Navier-Stokes equation. The question that we seek to answer in this paper is whether 2-dimensional velocity data containing noise can be incorporated into a full 3-dimensional solution of the Navier-Stokes equations in an appropriate and meaningful way. For addressing this problem, we examine the potential of least-squares finite element methods (LSFEM) because of their flexibility in the enforcement of various boundary conditions. Further, by weighting the boundary conditions in a manner that properly reflects the accuracy with which the boundary values are known, we develop the weighted LSFEM. The potential of weighted LSFEM is explored for three different test problems: the first uses randomly generated Gaussian noise to create artificial ‘experimental’ data in a controlled manner, and the second and third use particle imaging velocimetry data. In all test problems, weighted LSFEM produces accurate results even for cases where there is significant noise in the experimental data. Key words: least-squares, finite element, data assimilation, particle imaging velocimetry
Preprint submitted to Elsevier
22 July 2009
Introduction
The solution of the Navier-Stokes equations requires the specification of a domain and data along the boundaries of that domain (i.e., boundary conditions). The development of new experimental techniques, including particle imaging velocimetry (PIV), has created a situation in which additional data may be available along a lower-dimensional region of the domain. For example, data may be available along a 2-dimensional plane within a 3-dimensional domain. Further, it may be desirable to incorporate this experimental data into the solution of the Navier-Stokes equations. For example, echocardiologists can use FDA-approved microbubbles and PIV to determine two components of the blood velocity along a single plane within the left ventricle of the heart [11,23,24]. Despite the abundance of data, ultrasound and PIV alone are insufficient for calculating the flow properties of interest to clinicians, such as the pressure gradient and total energy loss, which require knowledge of the full three-dimensional velocity field. This is an example of an application where it may be useful to assimilate 2-dimensional velocity data into a 3-dimensional solution of the Navier-Stokes equations, which is distinctly different from using experimental data (e.g., PIV) to validate a computational fluid dynamics result (e.g., [10,25]). The most obvious approach for assimilating additional data into a standard finite element or finite volume computational fluid dynamics algorithm is to include the data as an essential boundary condition along an internal 2-dimensional plane with the domain, but we would immediately run into numerous difficulties, including: • the error in the experimental data could result in external boundary conditions that, overall, do not conserve mass (e.g., more flow into the domain than out of the domain); • similarly, the experimental error may prevent global momentum conservation; and • high-frequency error in the experimental data could contaminate the approximation beyond the plane (or subregion) where it is given. The lack of mass conservation is especially troublesome, and has been shown to have a significant impact on the approximate solution for most standard approaches [12]. We could project the boundary data onto a divergence-free subspace, but this projection could increase the error in the boundary data. We seek to determine if a numerical approach for solving the Navier-Stokes equations can overcome these difficulties, including boundary conditions that do not conserve mass exactly. Since the boundary data has error (uncertainty), one approach would be to run a large number of computational simulations that cover the entire range of possible boundary conditions [1]. This approach does not produce a single prediction but, instead, a probability distribution of predictions. It can also produce information such as the most likely or mean prediction. Unfortunately, this information comes at a significant computational cost. For example, PIV data often contains 100’s or 1000’s of data points so more than 105 simulations ∗ Corresponding author. Email address:
[email protected] (J. J. Heys).
2
Γ1 Ωa
Ωb
Γ2
Γv
Fig. 1. Two domains sharing a common boundary, Γv , and unshared external boundaries, Γ1 and Γ2 .
may be required to simulate the entire space of possible values for the data. The objective here is to obtain an average prediction using a single predictive simulation. A simplified version of the data assimilation problem is shown in Figure 1, which contains two domains (Ωa and Ωb ). Let Ω = Ωa ∪Ωb , and let Γv be the common boundary between the two domains. Finally, each domain (Ωa and Ωb ) has an external, unshared boundary given by Γ1 and Γ2 , respectively. Assume that a well-posed, first-order linear operator equation Lx = f applies on Ω with boundary conditions x = g1 on Γ1 , x = g2 on Γ2 , and x = gv on Γv . If the boundary data, g1 , g2 , and gv , are known exactly, then any suitable approximation method can be used on each individual domain, Ω1 and Ω2 . The only reason, in this case, to use an approximation method on the full domain, Ω, is to achieve increased continuity of the approximation across gv . However, as we show below, if some or all of the boundary conditions are not known exactly and completely, then it may be advantageous (or necessary) to solve a single problem on the full domain. One technique for solving this problem on a full domain is a least-squares finite element method (LSFEM), which begins by rewriting the linear operator equation as an optimization problem based on the functional Gx (x; f, g1 , g2 , gv ) := kLx − fk20,Ω + kx − g1 k21/2,Γ1 + kx − g2 k21/2,Γ2 + kx − gv k21/2,Γv . (1) The L2 norm is kxk0,Ω =
Z
Ω
1
2
|x|
2
,
(2)
3
and the H 1/2 norm is n
o
kxk1/2,Γ = inf kgk1,Ω : g ∈ H 1 (Ω) , trace g = x on Γ
.
(3)
The exact solution is found as the unique minimum of equation 1 over an appropriate Sobolev space. The solution could be approximated by minimizing equation 1 over a finitedimensional finite element space, but the boundary functional would be difficult to evaluate. Instead, inverse inequalities are used, which are valid over the finite element space [9]. Here, ˆ h in a finite element the H 1/2 norm is replaced by an L2 norm weighted by h1 , since for x space kˆ xh k1/2,Γ ≤
C h kˆ x k0,Γ . h
(4)
The effect of replacing the H 1/2 norm with the scaled L2 norm is that the oscillatory component of x is de-emphasized relative to the H 1/2 norm. Replacing the H 1/2 norm leads to the functional ˆ x (x; f, g1 , g2 , gv ) := kLx − fk2 + 1 kx − g1 k2 + 1 kx − g2 k2 + 1 kx − gv k2 . (5) G 0,Ω 0,Γ1 0,Γ2 0,Γv h h h The functional given by equation 5 is of the form normally used for first-order linear operators with exact boundary conditions. This same functional is also appropriate when the boundary data are not known exactly (i.e., g1 , g2 , and gv contain experimental error), but the error or uncertainty in the boundary data is identical for all boundaries (i.e., the standard deviation of the boundary data is the same for all boundaries). A final, special case occurs when only g1 and g2 are known exactly, but gv includes experimental error, which is assumed to be Gaussian with standard deviation σv . In this case, the final term in the functional, 1 kx − gv k20,Γv , should be eliminated because utilizing that term corrupts the approximation h with experimental error and optimality will be lost. The error in gv pollutes the convergence of the approximation as h → 0. It is possible that if the domain (and, consequently, h) is sufficiently large and σv sufficiently small, it may be beneficial to incorporate the final term, but this extreme case is beyond the scope of this paper. For most practical problems, the final term should be eliminated if σv > 0 but g1 and g2 are exact. While the functional given by equation 5 is appropriate for exact boundary conditions or the case when all boundary conditions contain the same error, it is not appropriate for the general case when all boundary conditions contain error and those errors are not of equal size, such as that occurring when PIV data is used as an additional, internal boundary condition in a numerical simulation. The objective here is to develop a new functional, similar to equation 5, that can account for error in the boundary conditions assuming that the size of the uncertainty is known (i.e., that the standard deviation of the boundary data is given by σ1 , σ2 , and σv for boundaries conditions g1 , g2 , and gv , respectively). A functional that meets this objective is described in the next section. We then examine the performance of the functional and resulting numerical algorithm on different test problems. 4
Methods
The previous problem description contained a first-order linear operator, L. Many problems of interest, however, are based on higher-order and nonlinear operators. For example, blood flow in the left ventricle is typically modeled using the Navier-Stokes equation or a similar equation with a non-Newtonian viscosity [14,18]. Extensive research has established techniques for converting the higher-order, nonlinear operators into first-order linear operators that can be treated efficiently with iterative matrix solvers [4,6,17]. Here we only illustrate one process for converting the Navier-Stokes equations into a first-order system of equations, and we refer the interested reader to [15] for additional details of this processes. The steady Navier-Stokes equations for an incompressible, Newtonian fluid are √ − Re (v · ∇v) − ∇ p +
√1 ∆v Re
= 0 in Ω,
(6)
(7)
∇ · v = 0 in Ω,
where p is the non-dimensional pressure, Re is the Reynolds number, and v = (vx , vy , vz ) is the dimensionless velocity. To rewrite equations 6 and 7 as a first-order system of equations, we use the identity 1 (v · ∇)v = ∇|v|2 − v × (∇ × v), 2
(8)
and define the negative vorticity, ω, by ω = −∇ × v ,
(9)
and another new variable, r, by
r = ∇p +
√
Re ∇|v|2 = ∇ 2
√
Re 2 |v| + p 2
!
,
(10)
which is the gradient of the the total head (commonly referred to as the gradient of “pres5
sure” [2]). A first-order system reformulation of the Navier-Stokes equations is as follows: ∇×v+ω
= 0 in Ω,
∇·v
√1 ∇ Re
×ω−r−
√
∇·ω ∇×r ∇·r−
= 0 in Ω, Re(v × ω) = 0 in Ω,
(11)
= 0 in Ω, √
= 0 in Ω, Re(ω · ω) − Re(v · r) = 0 in Ω .
The corresponding functional for the new formulation is GΩ (ω, v, r) := kω + ∇ × vk20,Ω + k∇ · vk20,Ω + √ k − r + √1Re ∇ × ω − Re(v × ω)k20,Ω + k∇ · ωk20,Ω + √ k∇ × rk20,Ω + k∇ · r − Re(ω · ω) − Re(v · r)k20,Ω .
(12)
The functional for the linearized equations, along with the boundary conditions described below, are minimized using standard techniques from the calculus of variations to obtain the weak form (e.g., [2,3]). A finite element basis is then chosen so that the weak form generates a matrix problem, which can be solved using a wide variety of linear solvers [13,17]. The boundary conditions used here for velocity and the new variables introduced in the process of creating a first-order system are summarized in Table 1. A large range of alternative boundary conditions may be used for flow problems [2]. It is important to note that internal boundary conditions along a plane are usually not enforced on ω or r because the experimental velocity data is discrete and, thus, not differentiable. Further, PIV, for example, often only provides two velocity components and not the full 3-dimensional field because out of plane particle motion is not measurable (except when using stereo PIV). Boundary conditions are typically enforced weakly (i.e., included in the functional as shown in equation 5), but they may also be enforced strongly (i.e., enforced on the finite element approximation space) if they are known exactly. For example, if all the velocity components along the wall (Γw ) are exactly zero and enforced strongly, but the remaining boundary conditions are enforced weakly, then the boundary functional along the wall is GΓw (ω, r) :=
1 kn h
· ωk20,Γw + h1 kn · r − n ·
√1 ∇ Re
× ωk20,Γw .
(13)
Assume that we have three types of external boundaries: (1) inflow – Γin , (2) outflow – Γout , and (3) walls – Γw . Assume that we also have internal boundaries, Γv , with additional experimental data (e.g., PIV data). Then the full functional is G(ω, v, r) := GΩ + GΓin + GΓout + GΓw + GΓv , 6
(14)
Inlet
n · v = gin
Boundary
n×v =0
Conditions
n·ω =0
Outlet
√1 ∇ × ω = 0 Re √ n · 1Re ∇ · ∇v =
n·r−n·
or
n·r−
0
n · ∇(v · n) = 0
Boundary
n×v =0
Conditions
n·ω =0
√1 ∇ × ω = 0 Re n · √1Re ∇ · ∇v =
n·r−n·
or
n·r−
0
Wall
n·v =0
Boundary
n×v =0
Conditions
n·ω =0
Internal
√1 ∇ × ω = 0 Re √ n · 1Re ∇ · ∇v =
n·r−n·
or
n·r−
0
n × v = n × gv
Boundary Conditions Table 1 Boundary conditions used for the first-order formulation of the Navier-Stokes equations.
where the GΓ ’s contain the boundary functional terms for each type of boundary. As described in the introduction, functional G(ω, v, r) (Equation 14) is appropriate when all boundary conditions are exact and the boundary terms in the functional are similar to equation 13 with each term weighted by the same amount, h1 . However, we are interested in the general case where the boundary conditions are not known exactly and the error in the boundary conditions varies from boundary to boundary. When the assumption of equal standard deviation between the different boundary data and experimental data is not valid, we need the boundary terms in the functional to be weighted so that data with large standard deviation is downweighted, and this is accomplished using the weighted LSFEM (WLSFEM, [19,20]). We introduce the functional Gw (ω, v, r) := GΩ + win GΓin + wout GΓout + ww GΓw + wv GΓv ,
(15)
where win , wout , ww , and wv are the weights given to the different boundary terms in the functional based on the error in that boundary data. For example, the weighted functional 7
term for the internal boundary is wv GΓv (v; gv ) :=
wv kn h
× v − n × gv k20,Γv ,
(16)
and the other boundary functionals have a similar form. To determine appropriate values for the boundary weights, win , wout , ww , and wv , it is useful to expand the boundary data in terms of the data error for one boundary and to rewrite the associated boundary functional accordingly. For example, assuming gv ∗ is the exact boundary value, which is not known, and the error is ǫ, then the weighted internal boundary functional could be written wv GΓv (v; gv ) :=
wv kn h
× v − n × gv ∗ + ǫ(O(σv ))k20,Γv ,
(17)
where σv is the standard deviation for the boundary data, gv . As stated in the introduction, if all boundary conditions are exact (e.g., σv = 0), then all boundary condition weights should equal 1 (e.g., wv = 1) and, as σv increases relative to the other boundary conditions, we would like wv to decrease in a reciprocal manner. Since the goal is to scale the functional so that ǫ is the same for each boundary, we can simply divide v and gv ∗ by σv . Factoring 1/σv2 out of the norm indicates that wv should be set to the reciprocal of the variance, σv2 , of the experimental boundary data: wv = 1/σv2 , which is consistent with weighted least squares regression [7,8,22]. To simplify this process, we typically set the weighting on the boundary functional to 1 for the most accurate boundary data. Then, all the other boundary functional weights are set to the variance for the most accurate data divided by the variance for that particular boundary data. For example, if the velocity along the inlet is known with a variance of 0.001 cm2 /s2 , which is the smallest variance for all boundaries, and the velocity along the internal boundary is known with a variance of 0.1 cm2 /s2 , then win = 1 and wv = 0.01. Typically, the velocity along the wall will have the smallest variance (unless the location of the wall is difficult to determine), and the experimental data will have the largest variance, so wv < 1 is normally used.
Results The performance of WLSFEM is examined on three different test problems. The first case uses ‘experimental’ data from a random number generator and not an actual experiment, while the second and third cases uses PIV data from an actual experiment. It is difficult to quantify the performance of a numerical method when neither an analytical solution or a highly refined solution is available, which is the case here when the boundary conditions contain noise. For the first two test problems, which are both flow through a cylindrical tube, qualitative comparison is possible because the solution, even with the noise in the boundary condition, should be relatively straight and smooth. However, to achieve a quantitative 8
comparison, we can take advantage of the fact that we are using a least-square formulation of the problem and use the value of both the full functional, Gw , and internal functional GΩ , as a measure of the quality of the solution. The value of the full functional, Gw , measures how well the approximate solution satisfies both the Navier-Stokes equations and the boundary conditions. Further, if the functional value with the internal PIV data included is compared to the functional value without the internal data, the ratio should be small if the internal data is consistent with the external boundary data and the Navier-Stokes equations. In other words, if the functional value changes significantly when the internal PIV data is included, it is indicating that the PIV data is over-weighted or some other error exists in the model. The drawback of the full functional is that it contains the weights being applied to the boundary conditions, so it is difficult to compare the performance of different boundary condition weights using a functional that contains the weight. On the other hand, for the internal function, GΩ , smaller values imply that the solution better satisfies the first-order system of equations (eq. 11), and, ultimately, better satisfies conservation of momentum and mass (i.e., the Navier-Stokes equations). The internal functional, has the advantage that the weighting of the boundary functional terms does not bias the functional value used in the comparison. Both the full functional, Gw , and internal functional, GΩ , are reported for each test case.
Straight Tube with Artificial Data The geometry for the first test problem is a three-dimensional straight cylindrical tube with an aspect ratio (length-to-diameter) of 5.0, and the flow is assumed to have a Reynolds number of 100 (all variables are non-dimensional). The central axis of the tube lies along the z-axis of the coordinate system, and the flow is assumed to be fully developed so that the problem with exact boundary conditions has an analytical solution of v = [0, 0, 1 − (x2 + y 2 )/R2 ], where R is the radius of the tube. The boundary conditions used are those described in Table 1, and gin is set using the analytical solution. A small amount of Gaussian noise with zero mean and standard deviation σ = 0.01 is added to external boundary conditions using a Box-Muller transformation for mapping a uniform distribution to a Gaussian distribution [5]. If the Gaussian noise is not included on the external boundaries and the exact boundary conditions are used instead, then, as described in the methods section, a weight of wv = 0 should be used so that the internal boundary conditions with error are ignored. The internal boundary is given by the x = 0 plane, along which gv is set to the y- and z-components of the analytical solution plus some Gaussian noise with zero mean and standard deviation σv = 0.1. As a result of the standard deviations for the various boundary conditions, win = wout = ww = 1.0 and wv = 0.01. This test problem has numerous advantages for analyzing the performance of WLSFEM. First, when a triquadratic finite element basis is used in conjunction with 27-node hexahedral brick elements, the analytical solution is nearly in the approximation space, though not exactly: triquadratic elements cannot exactly represent a cylindrical surface and, in any case, a small amount of Gaussian noise was added to the external boundary conditions. The result of having the numerical solution nearly in the approximation space is that, with 9
wv
value Gw
value GΩ
0
1 × 10⁻³
8 × 10⁻⁴
8.1 × 10⁻²
5.5 × 10⁻²
1
0.34
0.20
strong
5.3
5.2
0.01
Table 2 Effect of different weights on the internal boundary condition. wv = 0 results in no internal boundary condition, wv = 0.01 is the calculated weight for WLSFEM, wv = 1.0 gives the same weight to all boundary conditions regardless of the size of the error in the data, and the last row is strong enforcement of the internal boundary condition.
the internal boundary weight set to zero, the value of both the total functional, Gw , and the internal functional, GΩ , can be used as a sharp measure of the error introduced by the noise from the internal boundary condition (i.e., the noise in the ‘experimental’ data). If the internal boundary condition did not exist, the value of the functional would be close to zero (more precisely, Gw = 1 × 10⁻³ and GΩ = 8 × 10⁻⁴ when the internal boundary data is not used, see Table 2). The ‘experimental’ data (i.e., the analytical solution plus Gaussian noise) used for the internal boundary condition is shown in Figure 2a. Most numerical algorithms for approximately solving the Navier-Stokes equations strongly enforce velocity boundary conditions and, as a result, would strongly enforce the internal boundary data shown in Figure 2a. This noisy data impacts the global three-dimensional solution and affects convergence as the computational mesh is refined. If we enforce the internal boundary condition strongly and continue to use LSFEM to solve the Navier-Stokes equations, we then can see that the functional is very large after convergence to the functional minimizer (Gw = 5.3 and GΩ = 5.2; see Table 2), indicating that the equations shown in system 11 are not satisfied nearly as well as when the internal data is not used. If we look at a single plane of the approximate solution (the x=0.1 plane, Figure 2b), we can see that most of the noise present along the internal boundary plane (i.e., the x=0 plane) is damped out, but some noise remains. The diameter of the tube in the test problem is 1.0, and the noise from the internal boundary is further dampened at planes beyond the x=0.1 plane. When the same ‘experimental’ data shown in Figure 2a is enforced weakly with the correct boundary functional weighting (wv = 0.01), we observe a much more accurate solution, which is shown in Figure 3 both along the internal boundary condition plane (x = 0, Figure 3a) and along the x = 0.1 plane (Figure 3b). The size of the functional also reflects the improved approximation that results from using the proper weighting. The functional is 1×10⁻³ at the solution when the noisy experimental data is not used, 5.3 when the ‘experimental’ data is strongly enforced through the boundary conditions, and 8.1×10⁻² using the correct weighting on the weakly enforced boundary conditions. In fact, LSFEM without boundary weighting (i.e., all boundary weights set to 1) does an acceptable job of handling boundary conditions with error because the high frequency errors are de-emphasized by the approximate H 1/2 boundary norm and, as a result, even without the proper boundary weight, the LSFEM 10
(a)
(b)
Fig. 2. (a) The ‘experimental’ velocity data enforced on the internal boundary condition, which is equal to the analytical solution plus Gaussian noise with zero mean and σv = 0.1. (b) Flow in the tube domain (the x=0.1 plane is shown) using strong enforcement of the internal boundary condition (the x=0 plane) for a tube with a diameter of 1.0.
approximation has a functional value of 0.34. A test was also done with the level of Gaussian noise added to the external boundary data and internal boundary data reversed so that σin = σout = σw = 0.1 for the external data and σv = 0.01 for the internal data. The boundary functional weights were also reversed, and the results were very similar to those shown in Figure 3a with the functional also changing little to 3 × 10⁻³ . If the size of the error in the experimental data is increased from σv = 0.1 to σv = 0.4 and the error in the other boundary data is increased by a proportional amount, then the numerical simulation becomes more difficult due to the additional noise. Figure 4a shows the experimental data with larger Gaussian noise added, and Figure 4b shows the simulation result along a the plane x=0.1 with the experimental data strongly incorporated into the numerical simulation. LSFEM does surprisingly well even with experimental data containing significant error being strongly enforced. However, the value of the functional, Gw , is 22.3 (GΩ = 21.6) when it is minimized over a triquadratic finite element space, indicating that the 11
(a)
(b)
Fig. 3. (a) The internal boundary plane with the ‘experimental’ data weakly enforced with the proper weighting of wv = 0.01. (b) The x=0.1 plane using weak enforcement (wv = 0.01) of the internal boundary condition (the x=0 plane) for a tube with a diameter of 1.0.
approximate solution is really not satisfying the functional even though it visually appears acceptable. When WLSFEM is used on the larger error data shown in Figure 4a and proper weighting is included on the boundary terms in the functional, an improved result is obtained, as shown in Figure 5. This is an interesting result because most of the inlet boundary data has a small amount of error (σv = 0.04), but the data along the x = 0 plane of the domain has a larger error (σv = 0.4). The proper method for handling this situation is to weight the x = 0 plane with wv = 0.01 and the inlet with win = 1.0, except for the elements with edges on the x = 0 plane that should be weighted with wv = 0.01. In this case, the entire inlet plane had a weight of win = 1.0, resulting in a larger-than-optimal weight for the line x = 0 along the inlet. However, this change reveals the ability of WLSFEM to quickly dampen those errors and still achieve a high quality solution for most of the domain away from the inlet as shown in Figure 5. This result indicates that, when a larger-than-optimal weight is used for one or two isolated boundary conditions, the overall solution quality can still remain acceptable. 12
(a)
(b)
Fig. 4. (a) The ‘experimental’ data containing more Gaussian noise (σv = 0.4), and (b) The x=0.1 plane using strong enforcement of the internal boundary condition (the x=0 plane) for a tube with a diameter of 1.0.
Fig. 5. The internal boundary plane with the ‘experimental’ data weakly enforced with the proper weighting of wv = 0.01 applied everywhere except along the edge of the inlet where a weight of wv = 1.0 is applied.
The value of the functional is Gw = 0.89 (GΩ = 0.47) for the WLSFEM solution, which is much smaller than Gw = 22.3 for the strongly enforced experimental data solution. 13
Fig. 6. Time averaged laser PIV data from a flow through a cylinder at a Re = 1 × 10⁴ . The data covers the inner 4/7 of the cylinder diameter.
Straight Tube with Real Data The second test problem uses laser PIV [16] data from a flow of water through a straight cylindrical tube. The Reynolds number for the experimental flow is 1 × 10⁴ ; so, instead of solving the time dependent Navier-Stokes equation, the Reynolds-Averaged Navier-Stokes equations are solved because initial condition data is not available for the entire flow domain [21]. The time-averaged laser PIV data is used as an internal boundary condition on a plane crossing the axis of the cylinder. An additional complication is that the PIV data is not available out to the edges of the cylinder but is limited to the inner 4/7 of the cylinder diameter as shown in Figure 6. Before the PIV data can be used in the WLSFEM simulation, two additional calculations must be performed. First, the PIV data is non-dimensionalized so that it can be used in conjunction with the dimensionless Reynolds Averaged Navier-Stokes equations. Second, the PIV data must be mapped onto the nodes of the finite element mesh used in the WLSFEM simulation. The mesh is generated so that a plane of nodes lie on the same plane as the laser PIV data, and the nodal density of the mesh is similar to the density of the experimental data. As a result, a simple weighted average based on distance for the 4 or 9 nearest nodes is all that is required to map the data onto the nodes of the finite element mesh. Changing from 4 to 9 nodes had only a negligible impact on the final nodal velocity, so 4 nodes were normally used. The result of strongly enforcing the PIV data on the finite element approximation space is shown in Figure 7. The contour lines in the figure are for the velocity component parallel to the axis of the tube. The laser PIV data is relatively accurate (the standard error is only 5%) and, as a result, strongly enforcing the boundary condition on the finite element space does not significantly contaminate the numerical approximation in the rest of the domain. The largest errors in the PIV data occur along the upper left of the data plane where the velocity decreases unexpectedly, and these errors make mass conservation difficult for the numerical solution to satisfy. Overall, however, the numerical approximation appears to be of acceptable quality. The value of the least-squares functional is 0.75 when the PIV data is strongly enforced (GΩ = 0.69), and it will be important to compare this value to the 14
(a)
(b)
Fig. 7. (a) Axial velocity contours for the tube domain using strong enforcement of the laser PIV data as an internal boundary condition on velocity. The simulation results are shown for the (a) x=0.0 plane and (b) x=0.1 plane.
functional value when the boundary condition is weakly enforced with the proper weighting. The error in the laser PIV data is small relative to some other PIV methods (the standard error is approximately 5% for this simple geometry), and is only slightly larger in magnitude than the error associated with the other boundary conditions, which are estimated to contain 1% error. We know, of course, that the velocity of the fluid is zero at the physical wall of the tube, but since the exact location of the wall is not known (and varies slightly throughout the length of the tube), the velocity of the fluid at the wall in the model has an error. As a result of the error in the various boundary conditions, all boundary conditions were given a weight of 1.0 (win = wout = ww = 1.0) except the portion of the internal boundary with the PIV data, which was given a weight of 0.012 /0.052 = 0.04. When this weight is applied along the portion of the boundary with the experimental data, the result is a smoother solution along both the x = 0 plane (Figure 8a) and the x = 0.1 plane (Figure 8b). Even with the proper boundary weighting, the WLSFEM solution still displays some slight slowing of the fluid due to the experimental data. And, while visual differences between the strongly enforced and weakly enforced experimental data are difficult to detect due to the relatively small errors in the laser PIV data, the change in the functional provides a more quantitative comparison. 15
(a)
(b)
Fig. 8. (a) Axial velocity contours in the tube domain using weak enforcement (wv = 0.04) of the laser PIV data as an internal boundary condition on velocity. The simulation results are shown for the (a) x=0.0 plane and (b) x=0.1 plane.
As stated previously, Gw = 0.75 and GΩ = 0.69 when the experimental data was strongly enforced, but Gw = 0.14 and GΩ = 0.08 when the experimental data was weakly enforced with the proper boundary functional weighting. This indicates that the approximate solution for the weakly enforced case is much more conservative for both mass and momentum as measured in the functional norm.
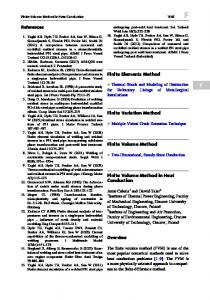
Transient Flow into a Box The final test problem also uses optical PIV data, but in this case the flow is a transient pulse of water into a cubic box that is 6 inches on each side. The flow into the box lasts for 200 ms, and the peak Reynolds number is 1100. PIV velocity data was acquired every 17.6 ms using a 3 ms time step between each image pair. The PIV data was collected on a 2.1 inch by 2.2 inch section of the PIV plane that was tilted as shown in Figure 9. It is important to note that the PIV technique used is stereo, so that, potentially, all three velocity components on the measurement plane can be resolved. In spite of the availability of the full three dimensional data along the PIV plane, only the velocity components tangential to the PIV plane were used in the WLSFEM simulation because only two dimensional data is available with many 16
Fig. 9. The experimental configuration for the third test problem is a cubic chamber, 6 inches on each side, and the PIV plane is tilted as shown in the figure above.
PIV techniques. The experimental PIV data was smoothed by taking a moving average over 2 adjacent time steps. This was necessary to reduce the error to the point that the data was usable in the simulations. In order to simulate a transient flow, the WLSFEM algorithm was modified by adding a backward (implicit) Euler time step. Potentially, any time step size could be used in the simulation, and the experimental data would only be used at time steps when it was available, but the results shown here employed the same time step size in the simulation as was used in the experimental measurements (17.6 ms). The implicit time stepping scheme avoids any time step size limitations due to numerical stability. A special mesh with a plane of nodes coinciding with the PIV plane was generated for simulating flow through this geometry. The mesh contained 105,984 hexahedral elements (approximately 48 elements on each edge) and both a trilinear and triquadratic finite element basis functions were used. The PIV data at the tenth time step (t=176 ms) is shown in Figure 10a. The data does not extend to the side wall of the experimental box, and the data represents only the velocity tangential to the PIV plane. If the experimental data is enforced strongly on the appoximate solution to the Navier-Stokes equations, the error in that data effects the entire solution. Figure 10b shows the simulation results along a 3 inch by 3 inch section of the PIV plane with the PIV data strongly enforced. However, if the PIV data is weighted (the standard error is again 5% and wv = 0.1 and win = wout = ww = 1.0) and enforced weakly on the 17
Fig. 10. (a) The experimental PIV data for the transient flow through a box problem. (b) The simulation results along the same plane as the PIV data using strong enforcement of the data. (c) WLSFEM simulation results along the PIV plane using properly weighted weak enforcement of the PIV data.
approximate solution to the Navier-Stokes equation, we see that both the noisy PIV data and the surrounding approximate solution are significantly smoothed as shown in Figure 10c. When the experimental data was strongly enforced, Gw = 62 and GΩ = 39, but Gw = 8.9 and GΩ = 7.3 when the experimental data was weakly enforced, indicating that the WLSFEM solution better satisfies the Navier-Stokes equations.
Conclusion
The assimilation of supplemental experimental data into a computational solution of the Navier-Stokes equations is of growing importance due to the the widespread expansion of experimental methods like PIV. The goal, ultimately, is to use the computational solution to the Navier-Stokes equations to fill in the gaps in the experimental data. Complications arise, however, when the experimental data has a different level of accuracy (or noise) from the other boundary data used in the simulation. WLSFEM is one approach that attempts to balance the boundary information based on the accuracy of the data. Further benefits of this approach include the fact that the approximate H 1/2 norm typically used in computations deemphasizes the oscillatory error in the boundary conditions, and boundary data may be enforced either weakly through the functional or strongly through the finite element approximation space. The effectiveness of the WLSFEM approach was first demonstrated on flow through a tube where the experimental data was generated by adding Gaussian noise to the analytical solution. Even for the case of large Gaussian noise, the WLSFEM gave an accurate result, and the error in the experimental data was quickly damped out away from the plane where it was known. WLSFEM was also tested on actual laser PIV data for two different geometries, and, again, the solutions with the weighted weak boundary condition was superior to the solutions that strongly incorporated the experimental data. Overall, the WLSFEM provides the flexibility needed to combine the numerical solution of the NavierStokes equations with supplemental experimental data. 18
Acknowledgements This work was supported by NSF grant DMS-0811275 and the Flight Attendant Medical Research Institute.
19
References [1] J. Anderson, An ensemble adjustment kalman filter for data assimilation, Mon. Weath. Rev. 129 (2001) 2884–2903. [2] P. Bochev, Analysis of least-squares finite element methods for the navier-stokes equations, SIAM J. Numer. Anal. 34 (5) (1997) 1817–1844. [3] P. Bochev, M. Gunzburger, Accuracy of least-squares methods for the navier-stokes equations, Computers Fluids 22 (4/5) (1993) 549–563. [4] P. Bochev, M. Gunzburger, Finite element methods of least-squares type, SIAM Rev. 40 (4) (1998) 789–837. [5] G. Box, M. Muller, A note on the generation of random normal deviates, Annals Math. Stat 29 (1958) 610–611. [6] Z. Cai, T. A. Mantueffel, S. F. McCormick, First-order system least squares for second-order partial differential equations: Part ii, SIAM J. Numer. Anal. 34 (2) (1997) 425–545. [7] R. Carrol, D. Ruppert, Transformation and Weighting in Regression, no. 30 in Monographs on Statistics and Applied Probability, Chapman & Hall, New York, 1988. [8] R. Carroll, C. Wu, D. Ruppert, The effect of estimating weights in weighted least squares, J. Amer. Stat. Assoc. 83 (404) (1988) 1045–1054. [9] P. Ciarlet, The Finite Element Method for Elliptic Problems, Classics in Applied Mathematics, SIAM, Philadelphia, 2002. [10] M. Ford, H. Nikolov, J. Milner, S. Lownie, E. DeMont, W. Kalata, F. Loth, D. W. Holdsworth, D. A. Steinman, Piv-measured versus cfd-predicted flow dynamics in anatomically realistic cerebral aneurysm models, J Biomech Eng 130 (2) (2008) 021015. [11] M. Gharib, E. Rambod, A. Kheradvar, D. Sahn, J. Dabiri, Optimal vortex formation as an index of cardiac health, Proc. Nat. Acad. Sci. 103 (16) (2006) 6305–6308. [12] P. Gresho, R. Sani, Incompressible Flow and the Finite Element Method, Advection-Diffusion and Isothermal Laminar Flow, John Wiley and Sons, New York, 1998. [13] J. Heys, T. Manteuffel, S. McCormick, L. Olson, Algebraic multigrid for higher-order finite elements, J. Comput. Phys 204 (2) (2005) 520–532. [14] J. J. Heys, C. G. DeGroff, T. A. Manteuffel, S. McCormick, First-order system least-squares (fosls) for modeling blood flow, Medical Engineering & Physics 28 (6) (2006) 495–503. [15] J. J. Heys, E. Lee, T. A. Manteuffel, S. F. McCormick, An alternative least-squares formulation of the Navier-Stokes equations with improved mass conservation, J Comp Physics 226 (1) (2007) 994–1006. [16] K. HINSCH, 3-dimensional particle velocimetry, Measurement Sci. Tech. 6 (6) (1995) 742–753. [17] B. Jiang, The Least-Squares Finite Element Method, Springer, Berlin, 1998.
20
[18] D. Ku, Blood flow in arteries, Annu. Rev. Fluid Mech. 29 (1997) 399–434. [19] E. Lee, T. Manteuffel, C. Westphal, Weighted-norm first-order system least squares for problems with corner singularities., SIAM J. Numer. Anal. 44 (2006) 1974–1996. [20] E. Lee, T. Manteuffel, C. Westphal, Weighted-norm first order system least squares for problems with three dimensional edge singularies., SIAM J. Numer. Anal. 46 (2008) 1619–1639. [21] D. Mavriplis, 3-dimensional multigrid reynolds-averaged navier-stokes solver for unstructured meshes, AIAA Journal 33 (3) (1995) 445–453. [22] T. Ryan, Modern Regression Methods, Wiley Series In Probability and Statistics, John Wiley, New York, NY, 1997. [23] P. Sengupta, B. Khandheria, J. Korinek, A. Jahangir, S. Yoshifuku, I. Milosevic, M. Belohlavek, Left ventricular isovolumic flow sequence during sinus and paced rhythms: new insights from use of high-resolutin doppler and ultrasonic digital particle imaging velocimetry, J. Am. Coll. Cardiol. 49 (8) (2007) 899–908. [24] P. P. Sengupta, V. K. Krishnamoorthy, J. Korinek, J. Narula, M. A. Vannan, S. J. Lester, J. A. Tajik, J. B. Seward, B. K. Khandheria, M. Belohlavek, Left ventricular form and function revisited: Applied translational science to cardiovascular ultrasound imaging, J. Am. Soc. Echocard. 20 (5) (2007) 539–551. [25] C. van Ertbruggen, P. Corieri, R. Theunissen, M. Riethmuller, C. Darquenne, Validation of cfd predictions of flow in a 3d alveolated bend with experimental data, J. Biomech. 41 (2008) 399–405.
21