Meaning. DPCM. Differential Pulse Code. Modulation. HVS. Human Visual System. IDCT. Inverse Discrete Cosine. Transform. MSE. Mean Squared Error. PSNR.
121
Tikrit Journal of Eng. Sciences/Vol.16/No.1/March 2009, (121-132)
DCT/DPCM HYBRID CODING FOR INTERLACED IMAGE COMPRESSION Dr. Saied Obied Abdul – Amir Assistant Prof Communication &Computer Dept. Al Mansour College
Khamies Khalaf Hasan Assistant Lecturer Electrical Eng. Dept. University of Tikrit
ABSTRACT By the nature of images, picture elements in local regions are highly correlated with one another. In such cases, image compression techniques are introduced to reduce the amount of data is needed to represent the same information, either exactly or approximately. In this work DCT/DPCM hybrid approach have been designed and implemented for interlaced images. The image signal was first transformed row-wise using discrete cosine transform (DCT) and a differential pulse code modulation (DPCM) scheme then was used column-wise to get difference signal. For still images the same 3-bit quantizer was employed which makes quantization process easier. For interlaced images 3-bit quantizer was used for the odd field and 2-bit quantizer for even field, since the difference signal of the even field was very small. A compression ratios of about 13:1 was obtained for interlaced image. Objective measurements showed a high peak to peak signal to noise ratio without noticeable impairment.
KEY WORDS: Interlaced, Hybrid image compression, DCT/DPCM, Discarding.
List of Abbreviations Abbreviation
Meaning
Abbreviation
Meaning
BR
Bit Rate Compression Ratio
1-D
One Dimensional
CR
2-D
Two Dimensional
DCT
Discrete Cosine Transform
bpp
Bit per pixel
DFT
Discrete Fourier Transform
Tikrit Journal of Eng. Sciences/Vol.16/No.1/March 2009, (121-132)
Abbreviation DPCM
Meaning
122
Differential Pulse Code Modulation
List of symbols
HVS
Human Visual System
Symbol
Description
IDCT
Inverse Discrete Cosine
dq
Quantized difference
I (r )
The one dimensional function
I ( r , c)
The two dimensional original image
. I(r,c)
The decompressed image.
Transform MSE
Mean Squared Error
PSNR
Peak to peak Signal to Noise Ratio
PCM
Pulse Code Modulation
RLC
Run Length Coding
SQ
Scalar Quantizer
L Number of gray levels
SNRRMS HVS IDCT
123
The root-mean-square signalto-noise ratio. Human Visual System Inverse Discrete Cosine Transform
MSE
Mean Squared Error
PSNR
Peak to peak Signal to Noise Ratio
PCM
Pulse Code Modulation
RLC
Run Length Coding
SQ
SNRRMS
Scalar Quantizer The root-mean-square signalto-noise ratio.
ri
Quantizer reconstruction levels.
S
Actual (present) sample value.
Tikrit Journal of Eng. Sciences/Vol.16/No.1/March 2009, (121-132) 123
INTRODUCTION Compression of digital images
full
frame.
Interlacing
works
by
has been a topic of research for many
scanning every odd line on the screen,
years
followed by every even line in the
and
compression
a
number
standards
of
image
have
been
second scan. [5, 6]
created for different applications. A
The image quality is measured
digital mage can be considered as two-
either subjectively or objectively. The
dimensional array of samples I(r, c). [1, 2]
parameters that decide if a picture to be
Due to the errors introduced by
considered is of high quality will differ
sampling and quantization of the actual
when either of them is used.
scene, it is only an approximation of an
The subjective visual quality
actual scene could be obtained. Number
measurement plays an important role in
of levels of intensity determines the
visual communications. It is natural that
Precision are expressed as the number
human viewers should judge the visual
of bits/sample. [3, 4]
quality of reconstructed images or video
It
is
well
known
that
an
analogue television picture is built up of
frames since they are the ultimate receivers of the data. [7]
lines. These pictures or frames are
Objective quality measurements
updated with a certain frequency (25 Hz
are
or 30 Hz). At such a low frame rate the
instrumentation. All types of objective
flicker in the TV picture is annoying. A
video or image quality assessments are
way to solve this problem would be to
done by measuring the distortion as the
increase the number of frames per
difference (error) between the original
second, to say 50 Hz; a method to
and the reconstructed image by a
increase the video update frequency and
predefined function.:
to lower the bandwidth usage is to use interlaced pictures. Interlacing doubles
conducted
by using
. error(r,c) I(r,c) - I(r,c)
electrical
(1)
the frame update frequency, the odd and the even field of each frame is transmitted consecutively. Each field contains only half the information of a
Where: I(r, c) = the original image,
. and I(r,c) = the decompressed image
Tikrit Journal of Eng. Sciences/Vol.16/No.1/March 2009, (121-132)
124
The root-mean-square error is defined by square root of the error
The bit rate and compression ratio are simply related by: [9]
squared divided the total number of
BR (BPP for origional image) CR (5)
pixel in the image ( N 2 ): Another related metric, the Peak Signal-to-Noise Ratio (PSNR) metric, is defined as:
Compression algorithms can be divided
into
lossless
and
lossy
algorithms depending on the type of PSNR dB 10 log10
………(2)
(L 1) 2 1 N2
N 1 N 1 .
I(r, c) - I(r, c) r 0 c 0
coding used which will be determined
2
by the particular needs of the user. Lossless compression of images
Where L = the number of gray levels
involves a completely reversible scheme
(e.g., for 8 bit L = 256) These objective measures are
by which the original data can be
often used in research because they are
reconstructed exactly; it can achieve a
easy
compression ratio of up to 3:1. Run-
to
generate
and
seemingly
Length coding and Huffman coding are
unbiased. [8] The most obvious measure of compression
efficiency
is
the
some of the lossless compression methods used in image compression. [10] In
Compression Ratio ( CR ) metric which
compression
is often employed and is defined as:
order
to
ratios
achieve with
high
complex
images, lossy compression methods are
CR
original image compressed image (3)
required. Lossy compression provides trade off between image quality and degree of compression.
is
In fact many lossy compression
instead quantified by stating the Bit
techniques are capable of compressing
Rate BR achieved by compression in
images with 10:1 to 20:1 and still retain
bpp (bits per pixel) and is defined by:
high quality visual information.. The
Sometimes
compression
lossy
original image size in bit BR No of pixels of the image (4)
methods
coding, transform
include
predictive
coding and the
combination of both which is called hybrid coding. [11]
Tikrit Journal of Eng. Sciences/Vol.16/No.1/March 2009, (121-132) 125
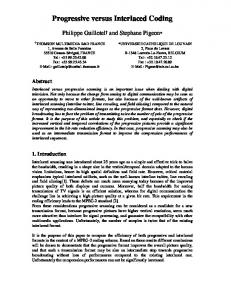
EXPERIMENTAL WORK The hybrid system consists of
blocks of the same length. Each block is
five main stages, see Fig. (1), firstly the
considered as a row vector, considering
encoding process of the input still image
the odd field represented by every odd
into interlaced image by dividing the
line in the image is the first field to be
original image into two fields. Then
coded.
each line in the field is divided into
1D DCT is applied to transform
coefficients
useful
(previous
spatial domain to frequency domain
coefficients, see Fig. (2), the third order
with
prediction is not possible.
same
dimension
to
be
represented in a more compact form.
energy, where the high frequency
vertical
odd
The predicted value of T4 is then
The few low frequency coefficients represent the DCT packing of the image
next
prediction
each row vector in the odd field from
the
and
for
given by:
T4 a7 T a8 T2
(6)
coefficient can be discarded with little loss
in
coefficients
energy; are
the
discarded
replaced
by
zero
.
Where:
.
T and T2
is
the
reconstructed coefficient of T and T2
coefficients. See Fig. (2). As mentioned previously that
respectively.
coefficients
same
prediction weighting coefficients for the
highly
even field. The prediction difference is
correlated, a one dimensional first order
then fed to the quantizer to obtain the
DPCM is used for encoding the odd
quantized difference which adds to the
field. The predictor uses the vertical
predicted value to get the reconstructed
coefficient value for the prediction
coefficient. Each field quantized in
according to the equation (6).
different quantizer, (2bits) quantizer is
DCT
horizontal
with
frequency
the are
But, for even field second order predictor is used because the current coefficient
has
two
neighboring
a 7 and
a8
are
the
used with the even field, while as for odd field (3bits) quantizer is used.
Tikrit Journal of Eng. Sciences/Vol.16/No.1/March 2009, (121-132)
The same DPCM system is used
Step 8: End. 126
to decode each field coefficients, and then the DPCM decoding coefficients is applied to 1D-IDCT to reconstruct the
SIMULATION RESULTS
original interlaced image data. The
To evaluate the hybrid system
hybrid system (DCT/DPCM) for the
performance with the applied Saturn
interlaced image is illustrated in the
image of size (256×256) with 256 gray
algorithm below.
levels. Two major measurements have
Algorithm 1:
been employed, namely the objective
Input: The original interlaced image
and subjective tests.
Output: The Compressed interlaced image
In this system each line is divided into blocks. Each block is
Step 1:
Selection of the original
considered as a row vector of 128
interlaced image.
pixels. 1D DCT is applied to convert
Step 2: Divide each field of the
each vector of pixels into a vector of
interlaced image into row vectors.
128 transformed coefficients. 1D DCT
Step 3: Apply One Dimension-Discrete
packing the energy into few numbers of
Cosine Transform (1D DCT) to each
transformed coefficients associated with
field row wise considering odd field
low frequencies, the high frequency
first.
coefficients are discarded and replaced
Step 4: Discarding the DCT coefficients
by zero coefficients. The discarding
that represent high frequencies.
process provides a tradeoff between CR
Step 5: Apply DPCM coding to DCT
and PSNR.
coefficients using first order prediction
Fig.3 ( b, c, d and e) show
for odd field , Second order prediction
the Saturn reconstructed images
for even field.
using
(64,
51,
low
frequency
39
and
32)
Step 6: DPCM reconstruction of the transformed coefficients.
coefficients
Step 7: Inverse DCT: Apply the inverse
respectively. They show a higher
1D
reconstructed
subjective quality. Comparing the
coefficients obtained from step 6 to get
reconstructed images with the
the reconstructed image.
original image, no noise in smooth
DCT
to
the
128
Tikrit Journal of Eng. Sciences/Vol.16/No.1/March 2009, (121-132)
127
area and no edge degradation are
Reduction”
evident.
California, PhDThesis,2000.
(Table 1) list the objective test based on CR and PSNR. Generally when the bit rate decreases the PSNR
University of
Southern
Website: http://sipi.usc.edu/~ortega/PhDTheses/C hristosChrysafis.pdf
will decreases and the quality will be corrupted by smearing in the edge
[2]- Salomon, D., “Data Compression ”, Springer-Verlag, second edition, 2000.
CONCLUSIONS From the results obtained, one can conclude the following points:
[3]- Gonzalez, R. C., and Woods, R. E., “Digital Image Processing”, Pearson Education Asia Pte Ltd., 2000.
1-The actual efficiency of the compression system depends to some extent on the original image quality.
[4]- Pasi, F “Image Compression”, “University of Joensuu”, lecture notes, 2002.
2-The discarding process of high frequency DCT coefficients provides a trade off between CR and image
[5]- Kaxe, B., “Synchronization of MPEG-2 Based Digital TV Services Over IP Networks”, Master’s thesis,
quality.
2000.Website:http://vvv.it.kth.se/docs/R 3-Using DCT by segmenting each line
eports/
into vectors may result in blocking artifacts. These artifacts are perceptually annoying and become prominent in the reconstructed images at very low bit-
[6]- Motta, G., “ Optimization Methods For
Data
Compression”,
Brandeis/University,PhD/Thesis,2002. Website:www.cs.brandeis.edu/~gim/Pa
rates.
pers/OptimizationMethodsForDataCom REFERENCES
pression.pdf
[1]-Chrysafis, C., “Wavelet Image
[7]- Lislevand, H., “The Connection
Compression
Rate
Between
Optimization
and
Distortion Complexity
Compression
Needs
,
Bandwidth and Quality for Multimedia Transfer in 3G System “ , Agder
128
Tikrit Journal of Eng. Sciences/Vol.16/No.1/March 2009, (121-132)
University College “ , Master’s thesis,
[10]- Subhi, A., “Interframe Coding for
2004 .
TV Signals”, Master’s thesis, College of Engineering,
[8]-Scott E. Umbaugh, “Computer
Al-Nahrain
University,
2000.
Vision and Image Processing”, Prentice Hall PTR, 1998.
[11]
Ali,
Compression [9]-Adamson,C.,”Lossless Compression of Magnetic Resonance Imaging Data”, Monash University, Master’s thesis, 2002.
A.
H., Using
”Image
Data
Adaptive
Methods”. University of Technology, Master’sthesis,2000
Tikrit Journal of Eng. Sciences/Vol.16/No.1/March 2009, (121-132)
129
Table (1): Objective Results for interlaced Saturn image.
Compression ratio
Bit per pixel (bpp)
PSNR (db)
64 column
6.4
1.25
36.2834
51 column
8.0314
0.9961
35.6303
10.5026
0.7617
34.6501
12.8
0.625
33.6895
Number of selected column /vector
39 column
32 column
Original egami
Reconstructed image
Interlaced image coding
DCT Transformation
Inverse DCT Transformation
DPCM Coding
DPCM Reconstruction
Fig. (1) Block diagram of the interlaced hybrid (DCT/DPCM) system.
Tikrit Journal of Eng. Sciences/Vol.16/No.1/March 2009, (121-132)
130 130
Increasing frequency odd
S3 S2
odd
deven
S5 S4
deven
T5 T4
odd
S1 So
odd
T1 To
deven
even d
odd
odd
deven
deven
odd
odd
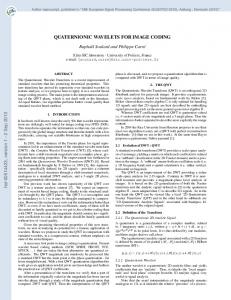
d (a) The dots ( ) represent the pixels values (S)
T3 T2
d dots ( ) represent the coefficients values (T) The
discarded coefficients Zero’s odd deven (c)
odd deven odd deven odd d
(b)
Tikrit Journal of Eng. Sciences/Vol.16/No.1/March 2009, (121-132)
131
Fig. (2) Procedures applied to each (row vector) of the interlaced image
(a) The original interlaced image. (b) 1D Transformed image. (c) Transformed coefficients after discarded high frequency coefficients.
(a)
(b)
(c)
(d)
(e) Fig. (3) Interlaced hybrid DCT/DPCM of Saturn image.
)Tikrit Journal of Eng. Sciences/Vol.16/No.1/March 2009, (121-132
(a) Original image with (8bpp). 132
(b) Reconstructed image with 64 columns/block (1.25 bpp). (c) Reconstructed image with 51 columns/block (0.9961bpp). الترميز ألهجيني DCT/DPCMفي ضغط الصور المتشابكة خميس خمف حسن
د.سعيد عبيد عبد األمير
مدرس مساعد
أستاذ مساعد
قسم هندسة االتصاالت والحاسبات
قسم الهندسة الكهربائية
المنصور
كمية
جامعة تكريت
الخالصة من خالل بيعةالا صورال تك ن ال ن ر ارالت صورال تن طال م الابم ماالططن منتصيبالا ي ال هذه صواالاتهك رميعالاه ضالطب صورال ت نخالنخطت ون يعال ناما أ ن تعيعاف نت نرمعت ن لعذ ظات هجع ياخالنخطصت ماال
صوجعالالم صوم لرال
معالا صومةبعالاه صومبي يالا ونم عال
يعالت مال يةضالاا صوالية
ف طال
لالع صومةي مالاه ومالا يرال تن
وضطب صور ت صومن اي اف عنت نا عال و الاتن صورال تن يانجالاه صورال
الالت عخالنخطت صونم عال صوتمالال صونلاضالالي صوت مال يانجالالاه صوةمال ط ويارال
ريالة و الالاتن
صولتم فياو خيا وير ت صوخا ا نت صخنخطصت م مت رالططل أمالا ويرال ت صومن الاي ا ط الط نالت صخالنخطصت لالع صوم مالت صوةالططل
ويمجالالا صولالالتطل
م مالالت رالالططل ص ال ويمجالالا صوا ج ال تن و الالاتن صولالالتم ويمجالالا صوا ج ال
ا الاله رالالطعتن جالالطصك أربالاله
صو عاخاه صوةميعا عما راوعا و خيا صإل اتن ووة صوض ضاء) (PSNRيط ن أل ن ه ميا ظف الكممات ألدالة :صومن اي اك ضطب صور ت صواجعنك صونتمعا أواجع
DCT/DPCMك بتح صولائ
ف