Drilling Events Detection Using Hybrid Intelligent Segmentation Algorithm Arghad Arnaout
Bilal Esmael
Rudolf K. Fruhwirth
Gerhard Thonhauser
TDE GmbH Leoben, Austria
[email protected]
University of Leoben Leoben, Austria
TDE GmbH Leoben, Austria
University of Leoben Leoben, Austria
[email protected]
[email protected]
[email protected]
Abstract— Several sensor measurements are collected from drilling rig during oil well drilling process. These measurements carry information not only about the operational states of the drilling rig but also about all higher level operations and activities performed by drilling crew. Automatic detection and classification of such drilling operations and states is considered as a big challenge in drilling industry. Furthermore, the possibility of detecting such events opens the door to detect and analyze hidden lost time of the drilling process. This paper presents a novel algorithm for drilling time series segmentation using Expectation Maximization and Piecewise Linear Approximation algorithms. The suggested algorithm shows that the incorporation of prior-knowledge about the drilling process is a key step to segment drilling time series successfully. The Expectation Maximization algorithm is used to segment drilling time series based on hook-load sensor measurements. In addition, Piecewise Linear Approximation is hired in our approach to slice standpipe pressure, pump flow rate and rotational speed (RPM) and torque of the top drive motor. Merging the results from both, Expectation Maximization and Piecewise Linear Approximation, gives the suggested algorithm the dynamic ability to detect all drilling events and activities. Keywords: Drilling Events Detection, Expectation Maximization, Timeseries Segmentation, Piecewise Linear Approximation
I.
INTRODUCTION
Automatic detection of drilling events and operations is considered as an urgent need in the drilling industry. Detecting these events gives services of drilling data analysis more aptitude to examine all actions which are done by the drilling crew at the rig site. Furthermore, automatic detection also provides essential mechanisms to judge the performance of the drilling machinery. Moreover, this leads to the possibility to perform sequence mining and analysis on particular drilling process sections. Usually sensors measurements are collected during the whole drilling process. Such measurements are used by drilling engineers and drilling crews to monitor the drilling process by action/response models. For example, any change in the hydraulic flow rate parameter causes a response in the pump pressure. Likewise, torque measurements are observed through altering the rotational speed of the drill string [2]. The cyclic nature of drilling processes exposes specific patterns for each drilling activity or event in sensor measurements. Furthermore, each sensor data time series
has specific statistical distribution. These distributions look very similar in almost all similar-type drilling rigs (offshore or land rigs). This gives the drilling process a similarity property. Here we can find a big possibility to generalize our findings and analyses [1] [2]. Expectation Maximization (EM) is a powerful tool to estimate the parameters of Gaussian distributions in the data. EM has ability to discriminate data into clusters if this data have the nature of mixture models. EM provides the possibility to find and describe main clusters in the data by estimating description parameters of each cluster. Segmenting of data based on a cluster will be a minor task if the parameters are estimated [3]. The Expectation Maximization algorithm is considered with stable performance in data with less amount of noise [4]. Piecewise Linear Approximation (PLA) is another useful tool for time series segmentation. Usually PLA is used to approximate main sections in time series. PLA has no tolerance to data with low of signal to noise ratio, but it can be applied to data with a specific S/N ratio [5]. II.
CONTRIBUTION
The contribution of this paper can be outlined as follows: 1. Automatic detection of different drilling events and operations. 2. Incorporation of prior-knowledge on drilling process is a main factor in hybrid intelligent algorithm. 3. Hiring Expectation Maximization algorithm as core algorithm for high-level segmentation. 4. Piecewise Linear Approximation algorithm is applied as low-level time series segmentation. 5. Combination of two algorithms (EM and PLA) to accomplish multi-level drilling time series segmentation. III.
DRILLING PROCESS AND MUD-LOGGING SYSTEMS
Oil well drilling is a process of making a hole in the ground in order to extract oil, gas or any other natural resources from the subsurface; usually performed by a rig. One of the most important parts of such a drilling rig is the drill-string. A drill-string is a chain of connected pipes usually having a length of 10 meters each. The bottom end of drill-string is made of special devices, denoted as bottom hole assembly (BHA). The last part of the BHA is drill-bit [6].
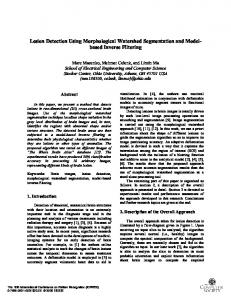
Numerous sensors are mounted at the rig to record different physical measurements during drrilling such as block position, hook-load, flow ratess, pump and circulation pressures, hole & bit depth and torque, among others [2]. Figure 1 shows a sketch of such sensoor data over a period of 20 hours, recorded with a resolutioon of 0.2 Hz.
Figure 1: Sketch of drilling time series (20 Houurs, 0.2 Hz)
The gray highlighted areas ”1” in Figuure 1 refer to a special state in drilling process; drill-stringg is hanging in the rig floor fixed by slips, thus such a statee is denoted as InSlips. The non-highlighted areas “2” reffer to converse situations denoted as OutOfSlips; this meeans that drillstring is hanging at hook of rig and thereforre applies force to the hook-load sensor [6]. Such a hoook-load sensor usually measures the weight of the drill-sstring together with weight of the hook; therefore the hoook-load is not zero at InSlips state. Two different patterns are formed by hook-load measurements during InSlips & OutOfSlips states [7]. At InSlips state, hook-load is low w, the measured value indicates the weight of the hoook only. At OutOfSlips state the hook-load is higher, thee weight of the hook plus the weight of the drill-string hangging at hook is measured. The separation of InSlips from OutOffSlips states is one of main steps of an automated drilling operations classification system [8]. Usually, drillingg experts set a threshold value manually for the hook-load to separate this states. Also the situations and states which are tagged in Figure-1 by “3”, “4”, “5”, “6” and “7” aree considered as usual and unusual events and states in the tiime series. “3”, “4” and “5” represent different levels of R RPM. The tag ”7” refers to a specific level of the pump floow rate flowIn. Tag “6” points to a standpipe pressure as rresponse of the flowIn level in tag “6”. From drilling expertt viewpoint, no clear reason explains why this level “6” iin flowIn time series happened.
IV.
DRILLING TIME SERIES SEGMENTATION USING EXPECTAION MAXIIMIZATION
In our approach we used the dataset d shown in Figure 1 incorporating the knowledge of o drilling experts. The approach is mainly based on hook-load sensor measurements. Figure 2 shows the histogram m of the hook-load data over a period of 10 days of drrilling. Applying drilling experts’ know-how, knowledge can c be explained on this histogram. It shows that hook-loaad data has the nature of Gaussian Mixture Models, i.e. th he data are composed at least out of 4 Gaussian distriibutions. Each of these distributions reflects information about a specific state of the rig. Obviously, two main disstributions are located in the data i.e. InSlips and OutOfSlips. The left most distribution certainly defines the InSlips I state. The statistical parameters of each e distribution provide information about the hook-load data for each state. The estimation of the threshold thaat discriminates InSlips states from other states is a significant step in segmentation. The segmentation,, which separates InSlips state from OutOfSlips state, is a high-level segmentation. The advantage of EM is that it caan be applied to big data set with acceptable performance. Arnaout et al. [3] discussed in n detail the use of hookload data to determine automaticcally the threshold value for separation of InSlips and OutO OfSlips states.
Figure 2: Histogram of hook-load data with indicator to location of OutOfSlips states. threshold between InSlips/O
After estimating the param meters of the particular cluster in the hook-load data, the second step is the calculation of the intersection n point, which is the threshold, used for separation off InSlips and OutOfSlips states.
The algorithm below shows how to calculate the intersection point between two clusters baased on Bayes’ theorem, using the clusters’ statistical parrameters, mean value and standard deviation. Intersection Point of two Clusters Input: Two univariate clusters C1 and C2 assumed to be Gaussian distributed with Θ1={µ1,σ1} and Θ2={µ2,σ2}.
Output:
The separation threshold xi of the two clusters.
Do
The probability density p(x|Ck) for the kth cluster of a Gaussian Mixture Model is given by µ
p(x|C )
e
(1)
According to Bayes’ theorem, the separationn threshold xi is located where the posterior probabilities P P(Ck|x) of both clusters are identical. Using
P(C | x) P(C | x)
( |C ) P(C ) ( |C )P(C )
(2)
( |C )P(C )
( |C ) P(C ) ( |C )P(C )
(3)
( |C )P(C )
merging costs is inevitable. The cost c of merging the actual segment with both, right and left l neighbors, must be calculated [5]. ment of OutOfSlips state Figure 3 shows detailed segm for sensors: hook-load, flow rate (flowIn), and Rotation Speed (RPM). In assistance off drilling experts, it is required that each change or event in those sensor measurements should be detectted. Applying Piecewise Linear Approximation on each of o those time series gives the possibility to detect main and d minor changes in these time series. The accuracy of deteection depends primarily on customized error cost function n of PLA. VI.
In this paragraph, the algorith hm of applying EM and PLA on drilling time series is preesented. The data showed in Figure 1 is used as sample dataa. Segmentation Algorithm Input Measurements of sensors as raw daata
Output Segments of time series
Do 1. 2.
and the prior probabilities P(C1) and P(C2) giveen by C
P(C )
(4)
the separation threshold xi can be estimatedd by solving the equation
P(C | x )
P(C | x )
(5)
End
V.
THE SEGMENTATIION ALGORITHM
3. 4. 5.
Estimate of clusters parametters in hookload data using Expectation Maximization alg gorithm. Calculate the intersection po oint, which is the threshold as specified earlier in Inteersection Point Calculation Algorithm. Create high-level segments (InSlips/OutOfSlips) based on the intersection point (threshold) and hook-load sensor data. vious paragraph to slice each Use PLA as specified in prev segment from previous step in nto smaller segments. Merge segments from previious two steps as resulting segments.
End
DRILLING TIME SERIES SEGMENTA ATION USING PIECEWISE LINEAR APPROXIMATIION.
The low-level segmentation is applied too each segment obtained from high-level segmentation as discussed above. In our approach Piecewise Linear A Approximation is applied to the hydraulic flow rate, denooted as flowIn, and the rotational speed of the drill strinng, denoted as RPM. The algorithm Bottom to Up [5] forms thhe base for the segmentation by Piecewise Linear Approxximation based on customized error cost function. The alggorithm begins by creating the finest possible approximatiion of the time series consisting of n samples by usingg initially n/2 segments. In a subsequent step, the costs off merging pairs of adjacent segments are calculated. T The algorithm iteratively merges the pairs with the lowesst costs until a stopping criterion is met. Merging pairrs of adjacent segments, i and i+1, bookkeeping about thee neighborhood
Figure 3: View of OutOf OfSlips section
Figure 3 illustrates detailed vieew of OutOfSlips section “1”. “2” and “3” point to the pump’s p startup/shutdown
procedures.”6” represents high level of rotational speed. “7” shows startup procedure of the rotary syystem over two phases. “8” shows lower level of rotationnal speed. “4” shows middle level of rotational speed. “55” indicates to procedure of shutting down the rotary system m. VII. RESULTS AND DISCUSSIO ON Figure 4 illustrates the results oof high-level segmentation using hook-load sensor meeasurements as well as low-level segmentation using other ssensor data. The results confirm a high level of acccuracy at highlevel segmentation. This because the sttability of the Expectation Maximization algorithm with noisy data. In addition, prior-knowledge about the facct of locating InSlips distribution as the left most disttribution gives more strength to the suggested segmenting aalgorithm. The accuracy of low-level segmenntation shows sensitivity to the value of predefined errorr parameter of PLA algorithm. Normalizing the data helpss in converging values of error parameters for each sensorr data. In most cases, we use same value for all error coost function of PLA. VIII. FUTURE WORK
should be done to reduce/filter the noise in time series before processing. The noise-filttering step will certainly improve the accuracy of segmentaation algorithm. REFERENCES [1]
[2]
[3]
[4] [5]
[6] [7] [8]
H L., Offshore, N., & Parigot, P., Marine, T., Als, N., Havrevold, Als, S. (1988). SPE 5789 Intelligentt Real-Time Status Analysis for Rig-Site Drilling Engineering, 393–401. Florence, F., Varco, N. O., Iversen, F., & Systems, D. R. (2010). IADC / SPE 128958 Real-Time Models for Drilling Process Automation : Equations and Appliccations. Arnaout, A., Esmael, B., & Fru uhwirth, R., Thonhauser, G., Automatic Threshold Tracking of Sensor S Data Using Expectation Maximization Algorithm. m Likelihood from Incomplete A.P. Dempster. (2007). Maximum Data via he EM Algorithm, 39(1), 1– –38. Keogh, E., Chu, S., Hart, D., & Pazzzani, M. An online algorithm for segmenting time series. Proceedings 2001 IEEE International Conference on Data Mining, 289–296. doi:10.1109/ICDM.2001.989531 H. Rabia, “Oil Well Drilling Engineering, Principles and Practices”, University of Newcastle,, 1985 China National Logging Cooperatio on, “Mud Logging Technology and Services”, presentation, 2006 G. Thonhauser, “Using Real-Time Data for Automated Drilling Performance Analysis”, OIL GAS European E Magazine, 2004
The suggested algorithm in this paper oopens doors to do further analysis and recognition onn each detect segment in drilling time series. In additioon, more work
Figure 4: Results of the suggested segmentationn algorithm on drilling time series after normalization (Automatic-detectted sections in red lines).