1258
IEEE TRANSACTIONS ON POWER DELIVERY, VOL. 25, NO. 3, JULY 2010
DSP Wavelet-Based Tool for Monitoring Transformer Inrush Currents and Internal Faults A. M. Gaouda, Member, IEEE, and M. M. A. Salama, Fellow, IEEE
Abstract—This paper proposes a wavelet-based technique for monitoring nonstationary variations in order to distinguish between transformer inrush currents and transformer internal faults. The proposed technique utilizes a small set of coefficients of the local maxima that represent most of the signal’s energy: only one coefficient at each resolution level is utilized to measure the magnitude of the variation in the signal. The data is processed while sliding through a Kaiser window and the technique has been applied in the laboratory as well as with simulated data, producing excellent results. Index Terms—Inrush current, internal faults, Kaiser window, multiresolution analysis, transformer, wavelet transform.
I. INTRODUCTION ONITORING and classifying power transformer inrush currents (TIC) and transformer internal faults (TIF) are still challenging problems for power system engineers because of the possibility of false tripping caused by the magnetizing effect of the inrush current [1]–[4]. The second harmonic component of an inrush current is dominant among TIC and may reach levels of 15 % or more of the fundamental. In recent years, improvements in core materials and design have resulted in TIC with less distortion, with a second harmonic component being as low as 7 % [1]. Harmonics may appear during faults; however, they are generally small and even [1]. The 15 % second harmonic restraint criterion is used to prevent mal-operation of the differential relay in power transformers during external faults. However, some abnormal disturbances or operations still present a challenge when differential protection is based on a fast Fourier transform (FFT) [6], [7]. Different techniques have been proposed for overcoming relay mal-operation in the presence of a TIC or during transformer external faults. Some are based on harmonic monitoring in order to restrain or block harmonics, and others are based on waveshape identification [6]. Wavelet analysis has emerged as a powerful tool for signal processing in different power system applications [8], [9], including the waveshape analysis of transformer faults and inrush currents. In [5], several features
M
Manuscript received November 01, 2007; revised July 23, 2008, April 12, 2009, August 06, 2009, October 26, 2009. First published June 01, 2010; current version published June 23, 2010. This work was supported by the United Arab Emirates (UAE) University under Grant 09-04-7-11/06. Paper no. TPWRD00687-2007. A. M. Gaouda is with the Department of Electrical Engineering, United Arab Emirates University, Al-Ain, United Arab Emirates. M. M. A. Salama is with the Department of Electrical and Computer Engineering, University of Waterloo, Waterloo, ON, Canada and also with King Saud University, Saudi Arabia (e-mail:
[email protected];
[email protected]). Digital Object Identifier 10.1109/TPWRD.2010.2046653
were derived from the wavelet packet (WP) transform. The proposed technique utilizes a signal produced from the product of the fault current and the pre-fault voltage. The sampling rate is selected as 20 kHz, and the signal is decomposed up to the third level, which covers frequency bands up to 10 kHz. The proposed TIC classification features are described based on the sum of the wavelet coefficients generated utilizing a WP transform. However, the sign of these coefficients depends on the individual signal being processed, and their summation may produce different results for similar signals. Furthermore, the decomposition process uses a Daubechies 1 (db1) transform, which has two vanishing moments (two coefficients) and allows a wide spread (leakage) of the signal’s energy into adjacent resolutions. In [10], a technique combining a wavelet transform and a neural network is presented. The proposed technique concentrates on the first three resolution levels (12.5–1.562 kHz) and uses the detected sharp spikes localized at these resolutions in the classification process. The proposed technique utilizes the reconstructed version of the signals using a Daubechies 4 transform (db4 with 8 coefficients). Similarly, in [3], the spikes localized at the first 4 resolutions are used to monitor TIF and TIC cases. The duration of these spikes and their decaying nature are used in the classification process. The detail coefficients using a Daubechies 4 transform are used in the analysis and classification process. The two techniques proposed in [3] and [10] monitor the spikes at high resolution levels; however, these spikes might be generated as a result of any fast changes, such as the switching phenomenon or load changes. Further, in some cases, the variation in the TIC is smooth and hence no periodic spikes would be detected for high-frequency bands. Moreover, the convolution technique, which is based on a discrete wavelet transform (DWT), and the data sliding process may generate such spikes at the start and end of the data processing window. In [11], the second harmonic component is used as the characteristic component of the TIC. A wavelet-based feature extraction scheme is used to decompose the currents and to concentrate on the resolution level that covers the second harmonic components. In three-phase transformers, the phase subjected to TIC was identified by detecting two successive peaks and bottoms and then counting the number of samples between them. The proposed technique utilizes the reconstructed version of the signals produced by a Daubechies 4 transform. In [12], a wavelet-based decision tree for feature extraction and a pattern recognition technique are combined to generate TIC features for transformer protection. The detail coefficients, extracted by a Haar wavelet (Daubechies 1), are used as additional features for the pattern recognition tool.
0885-8977/$26.00 © 2010 IEEE
GAOUDA AND SALAMA: DSP WAVELET-BASED TOOL FOR MONITORING TICS AND TIFS
All of the above waveshape monitoring techniques are proposed as a means of detection and classification. The existing tools have ignored the monitoring of the 50-Hz power signal, which is an essential factor in protection or control. To overcome this deficiency, the integration of two tools is proposed: the first is for detecting and distinguishing between TIC and TIF and the second is for measuring changes in the current signal. Existing techniques have been implemented using mother wavelets that have small vanishing moments, i.e., a small number of wavelet filter coefficients. These wavelets allow a large part of the signal’s energy to dissipate to other resolution levels and thus degrade the monitoring process. In this paper, we present a recent proposed wavelet-based technique [13], [14] that efficiently discriminates between TIC and TIF cases and prevents mal-operation of the differential relay of the transformer during external faults. In the proposed technique, the FFT-based restriction ratio of the second harmonic to the fundamental of the differential current is replaced by the ratio of the signal magnitude at the fourth resolution to that at a reference resolution in order to overcome differential relay mal-operation. A small set of coefficients of local maxima that represent most of the signal’s energy are used in order to classify a variety of cases. No reconstruction process is required, and only one coefficient and its index at each resolution level are used to detect and measure the nonstationary variations in the TIC and TIF cases. The following methodology has been implemented as a means of auto-classifying and measuring TIC and TIF currents and of overcoming differential relay mal-operation in power transformers. 1) Pre-processing stage: The goal of this stage is to generate stable reference features from the 50-Hz signal in terms of the number of detail coefficients and their magnitudes and indices. An adjustable Kaiser processing window, the data sliding rate, and the data sampling rate are the main attributes of this stage. 2) Data processing stage: The goal of this stage is to apply wavelet multiresolution analysis in order to generate the wavelet expansion coefficients of the windowed-current signal as data slides through the Kaiser window. 3) Feature extraction stage: The goal of this stage is to select the coefficients of local maxima that represent most of the signal’s energy along with their indices so that the TIC or TIF signals are presented in terms of a manageable set of coefficients. 4) Measurement and classification stage: The goal of this stage is to measure simultaneously the nonstationary variations in TIC or TIF cases at different resolutions and to compare these variations with that at a selected reference resolution. For each resolution, only one coefficient and its index are used in the measurement process. The number of coefficients of local maxima and the nonstationary magnitude variation are used to classify TIC and TIF cases and to compare the second harmonic ratio with the 15 % threshold. The paper is organized as follows. An introduction to wavelet multiresolution analysis (WMRA) and the advantages and drawbacks of selecting different mother wavelet functions
1259
are presented in Section II. Section III describes the proposed technique for enhancing wavelet monitoring, and the stages of data processing, feature extraction, and measurement are discussed. Sections IV and V present the application and test results. Laboratory data for TIC cases and simulated data for both TIC and TIF cases are used for evaluating the proposed technique. The conclusion and references are presented in Sections VI and VII, respectively. II. WAVELET MULTIRESOLUTION ANALYSIS Applying wavelet multiresolution analysis, one can decomat different resolution levels and pose a current signal and detail expresent it as a series of approximate pansion coefficients [15]. Fig. 1(a) shows one stage of a wavelet decomposition process. The sets of expansion coefficients at a lower resolution can be mathematically calculated as (1) (2) and represent the coefficients of the selected where can be scaling and wavelet functions. The current represented as a series of expansion coefficients and a combinaand the wavelet function , tion of the scaling function as follows:
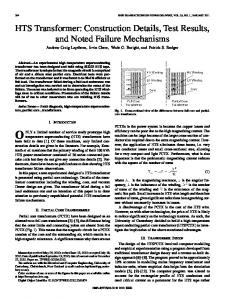
(3) If the scaling and wavelet functions form an orthonormal basis, then according to Parseval’s theorem, the energy of the signal can be partitioned in terms of its wavelet expansion coefthat represents the distortion ficients [15]. A feature vector event in the signal at a specific resolution level can be extracted at that resfrom the norm of the expansion coefficients olution as [16] (4) and Using Mallat’s algorithm, the wavelet coefficients act as high pass and low the scaling function coefficients pass digital filters, respectively. Fig. 1(b) shows the frequency response of three different mother wavelets: Daubechies 4 (db4), Daubechies 40 (db40), and Coiflet 5 (Coif5. The freare represented quency responses of the scaling function are repreby the dashed lines, and the wavelet functions sented by the solid lines. The wavelet spectrum is meaningful only when the selected wavelet has enough vanishing moments (filter coefficient length) [17]. As the number of vanishing moments increases, more smoothness can be achieved, and their frequency shows more flatness close to zero and [15]. The overlapping region (dashed area) between the two filters is therefore small, and minimum leakage is thus expected during the wavelet-decomposition process. When db40 is used, the
1260
IEEE TRANSACTIONS ON POWER DELIVERY, VOL. 25, NO. 3, JULY 2010
Fig. 1. (a) Wavelet transform detail and approximate coefficients at the first resolution level. (b) Frequency responses of scaling and wavelet functions.
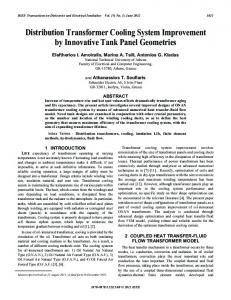
wavelet spectrum shows a dramatic reduction in the overlapping region, compared to those using db4 and coif5. However, complex processing is required for longer filters [15]. The importance of having a 50 Hz (or 60 Hz) pure reference signal is a more significant advantage in power system applications than in other applications. This advantage should be utilized efficiently through defining the resolution levels that contain the 50-Hz signal as a reference resolution in order to monitor normal and abnormal operating conditions. Fig. 2 shows eight resolutions of the wavelet expansion coefficients of 1024 sampling points of a 50-Hz pure signal sampled at 2.133 kHz. Daubechies 4 [Fig. 2(a)] and Daubechies 40 [Fig. 2(b)] wavelets were used to decompose the signal. As can be seen in Fig. 2, most of the pure signal energy is localized at the fifth resolution (reference resolution, 33.33 to . How66.66 Hz) as represented by the detail coefficients ever, other sets of coefficients are localized at other upper and lower resolutions. This leakage in the expansion coefficients comes partially from the overlapping region due to the nonsharp cutoff frequency response of the selected mother wavelet. Further, the and result from convolution and expansion coefficients decimation, as indicated in (1) and (2). As data sliding occurs in
Fig. 2. Detail expansion coefficients localized at eight resolutions using” (a) Daubechies 4, (b) Daubechies 40, and (c) norm of the coefficients at different resolutions.
blocks, convolving the wavelet filter coefficients by the approximate coefficients may generate a set of coefficients at the start and end that do not represent the signal at that resolution (for ex, and in Fig. 2(b)). These coefficients generate ample, other coefficients at other resolutions and hence scatter the energy of the pure signal from the reference resolution to other resolution levels. The proposed feature vector (4) shows that most of the signal’s energy is localized at the fifth resolution; however, a large part of the pure signal energy is detected at other adjacent resolutions, as shown in Fig. 2(c). To overcome this drawback, the detection and monitoring process proposed in [16], [17] utilizes the difference in the feature vectors (4) of the pure signal and the distorted one extracted by considering mother wavelets with high vanishing moments and using all the coefficients in all resolution levels.
GAOUDA AND SALAMA: DSP WAVELET-BASED TOOL FOR MONITORING TICS AND TIFS
1261
III. ENHANCING WAVELET MONITORING A variety of criteria have been identified as important measures of enhancement in multiresolution analysis [15]: sparsity, separation, super-resolution, stability, and computational speed. of the signal being The enhanced expansion coefficients processed should represent most of the important information in a small number of coefficients so that other coefficients are small enough to be neglected or set equal to zero. This sparsity is important for data management, compression, and denoising. TIC and TIF consist of a linear combination of signals with different characteristics. The enhancement technique should provide expansion coefficients that clearly separate those signals. Features of interest that can be used to classify each disturbance should be separated and localized at different resolutions. This separation is important for detection and classification. The pure 50-Hz component should be localized in a reference resolution (super-resolution) so that a distortion event superimposed on a pure 50-Hz component and its characteristic set of expansion coefficients should have much better resolution than that in a direct application of multiresolution analysis. This feature is likewise important for detection, classification, and estimation. Stable coefficients that are extracted at the reference resolution (50 Hz) should not be significantly changed by disturbances or noise. This factor is important in auto-monitoring applications and data measurement. The numerical calculation of the expansion coefficients in the new system should be of the order or . This value is important for real-time of applications. The proposed enhancement monitoring technique can be summarized as indicated in the following subsections. A. Stage 1: The Pre-Processing Stage (Windowing Stage) Generating a windowing version of the signal increases the similarity between the signal being processed and the selected was selected wavelet function. A Kaiser window of length in the windowing process, which is mathematically presented as
(5) is the modified Bessel function, and is the midwhere point of the window function and . The advantage of selecting a Kaiser window is the ability to adjust the shape of the window by changing [18], [19]. A windowing version of the current data is created in this kHz) is selected such stage. The sampling rate ( that the 50-Hz component is centered at the reference resolution. The TIC or TIF data slides into a Kaiser window of a length that contains complete cycles of the 50-Hz pure signal. The signal is slid uniformly into the processing window. is selected as 1/2 cycle, 1 cycle, or The data-sliding rate cycles, such that complete cycles are localized within the processing window. In this application, the data-sliding rate is selected as 1/2, , 2, 3, and 4 cycles, the Kaiser
Fig. 3. (a) Detail expansion coefficients (wd ) of a windowed pure signal using. (b) Norm of the wd and d at eight resolutions.
window size varies from three cycles to eight cycles, and its parameter is set to 9. B. Stage 2: Data-Processing Stage Using Mallat’s algorithm, the set of expansion coefficients of a windowing version of the signal at a specific resolution level can be defined as (6) Fig. 3(a) shows the wavelet expansion coefficients localized at eight resolutions of a 50-Hz pure signal using a Daubechies 40 wavelet. Comparing the effect of the windowing
1262
IEEE TRANSACTIONS ON POWER DELIVERY, VOL. 25, NO. 3, JULY 2010
Fig. 5. Simulated system of the external fault inception and removal.
in Fig. 4(c). The coefficients of the local maximum are represented as (7) D. Stage 4: Signal Measurement
Fig. 4. Detail coefficients at resolution j using (a) d , (b) wd , and (c) jwd and the coefficients of the local maxima.
j
stage [Fig. 3(a)] with the direct application of WMRA [Fig. 2(a) and 2(b)] results in the following: are localized at the • the pure signal coefficients fifth resolution (reference resolution) in terms of a small number of coefficients; • these coefficients remain stable in terms of their number, magnitude, and indices as new data slide into the Kaiser window; , and that do not • coefficients at the start and end represent the signal are cleared , and ; • the signal’s energy is concentrated at the fifth resolution, and other coefficients are small enough to be neglected or set equal to zero. A comparison of the norm of the expanand is shown in Fig. 3(b), sion coefficients generates a sharp feature vector that can in which be used for the detection and monitoring process. C. Stage 3: Feature Extraction and Classification The goal of this stage is to represent TIC or TIF cases in terms of a manageable set of coefficients that represent most of the signal’s energy. As data slides into the Kaiser window, the coefficients of the local maxima and their indices localized at each resolution level are defined. The absolute values of the are used to localize either the positive detail coefficients or negative expansion coefficients that carry most of the signal’s energy. For the set of wavelet coefficients localized at a specific resolution level, a local maximum takes on the largest value of all coefficients in the immediate vicinity. Therefore, a coefficient becomes a local maxima of a group of neighborhood . Fig. 4(a) and (b) show coefficients if and the windowing version of the the detail coefficients . The absolute value of the detail coefficients coefficients and the coefficients of the local maxima (lines marked with dot) as well as the maximum coefficient in the set are shown
Tracing the variation in the magnitude of the current signals for TIC and TIF cases is achieved by monitoring one coefficient at each resolution level. The maximum coefficient detected and and the maxlocalized at each resolution level imum coefficient at the reference resolution are used to measure the nonstationary variation in the magnitude of the 50-Hz curand to quantify the variation in other resolurent signal tions, using the following relation:
(8) is the maximum value of the wavelet cowhere and is the maximum efficients at resolution value of the wavelet coefficients at the reference resolution is used to during normal operating conditions. The factor compensate for constant energy as the scale changes in order to decompose the signal at higher or lower frequency resolutions. , the number The stable magnitude and index of of coefficients of local maxima at each resolution, and the variare used to classify TIC and ation in the current signal TIF cases. IV. APPLICATION AND RESULTS A. Data Generation The proposed technique presented in this paper was evaluated using laboratory data and simulated data. A single-phase United Magnetic Equivalent Circuit (UMEC) model that has been implemented in PSCAD/EMTDC [20] was used to model TIC and TIF cases. Fig. 5 shows a PSCAD simulation model constructed for the study of the mal-operation of a transformer differential relay during external faults. The line, load, and fault impedances were changed, and the PSCAD multirun feature was used to generate external faults at different time instants. and parameters similar to that presented in [6] were used. A secondary resistance of 1.0 ohm, a secondary inductance of 0.8 mH, and a 1.5 T remnant flux density of the core were selected for both CTs. A turn ratio of 600/5, a core path
GAOUDA AND SALAMA: DSP WAVELET-BASED TOOL FOR MONITORING TICS AND TIFS
1263
Fig. 6. Measuring signal magnitude variations during (a) TIC and (b) TIF.
length of 0.68 m, and a core cross-sectional area of 23.2 cm were used for and a turn ratio of 2000/5, a core path length of 0.5 m, and a core cross-sectional area of 44.2 cm were used for . The load elements were varied from 8 to 30 ohm and from 0.01 to 0.03 H, and the line elements, from 0.2 to 1.0 ohm and from 0.001 to 0.003 H. The fault impedance was varied from 0.01 to 2 ohm, and the external fault duration was set to 0.2 s. TIC data were also obtained from the laboratory using a 3.0 kVA 220/110 VAC, 50-Hz single-phase transformer connected to a light load. A fast reclosing was implemented in order to generate a variety of TIC cases. Fig. 6 shows the laboratory data for the TIC due to the reclosing phenomenon [Fig. 6(a)] and the simulated data for the TIF during a single line-to-ground fault at a phase-a winding of the secondary side of the transformer [Fig. 6(b)]. The fault was simulated as temporary in order to evaluate the proposed measuring technique. B. Data Measurement We applied the proposed technique to the laboratory data of the TIC case and then detected variations in the signal from the first resolution up to the fifth resolution. These variations were measured using (8) and are shown in Fig. 6(a). Only the maximum coefficient at each resolution was used to measure the variations. The variation in the TIC magnitude for different was investigated. (533 to 1066 Hz) window centers and (266 to 533 Hz) show fast increases in their mag(133 to 266 Hz) and nitude and then fast decay to zero. (66 to 133 Hz) decay slowly. The magnitude of TIC at the reference resolution , 33 to 66 Hz) varies between zero and 1.0 p.u., as shown in Fig. 6(a). Similarly, Fig. 6(b) presents the magnitude of the variations in the TIF case at different resolutions. The main variation was detected and measured at the reference resolution , 33 to 66 Hz) when the magnitude of the signal reached 5.16 p.u. at a (66 to 133 Hz) shows a small window center of 0.6910 s. variation during the starting and ending instants of the TIF case.
Fig. 7. Detail coefficients extracted at the first five resolutions: (a) wd for TIC, (b) d for TIC, (c) wd for TIF, and (d) d for TIF.
C. Comparing
and
Fig. 7 shows detail coefficients extracted at the first 5 resolutions from the TIC and TIF signals when the proposed technique was applied and with the direct application of the wavelet muland tiresolution analysis (WMRA). Fig. 7(a) and (b) show ( ) of the TIC case, and Fig. 7(c) and (d) show ( and ) of the TIF case for the signals shown in Fig. 6. resulting from the The number of detail coefficients proposed technique is small and manageable compared to that with . Using the coefficients of the local maxima allows only the coefficients that localize most of the signal’s energy to be considered at each resolution level. Many coefficients become small enough to be set equal to zero using a small threshold value. Coefficients that are generated at the start and the end of the first decomposition stages and that then generate into other coefficients at different resolutions abolished. This process is clear in the TIF case [Fig. 7(d)] for the starting , and . Further, during a direct application coefficients of WMRA, selecting a threshold value becomes difficult, and important coefficients localized at the center may be ignored, as shown for the TIF case for , and .
1264
Fig. 8. TIC magnitude tracing using FFT and the proposed technique for different data centers.
No change is expected in the computation speed that results from processing data through a Kaiser window or a rectangular window. The application of local maxima and the overlapping of data during the windowing process require additional computational time and can be controlled by controlling the data sliding rate. However, processing small sets of coefficients that can generate clear features and give an accurate measure of the variation in the power signal is important and can provide fast results during the monitoring of stationary, nonstationary, and transient events. This factor is likewise important in control and protection applications or for wide-area monitoring. D. Disturbance Detection As proposed, the fifth resolution was selected as the reference resolution. Selecting the proposed size of the Kaiser window and data sliding rate generates stable features for that resolution. The number of coefficients and the magnitude of the maximum coefficient and its index are stable during normal operating conditions. Any changes in the signals are detected as changes in the magnitude of the coefficients and their indices. E. Feature Extraction Using FFT and the Proposed Technique Another important feature of the proposed technique arises from its ability to trace nonstationary variations in the TIC and TIF signals more quickly than the FFT. Figs. 8 and 9 show a comparison of the tracing of nonstationary variations in both the TIC and TIF cases, using the proposed technique and the fast Fourier transform as the data processing window center changes. The first columns in Figs. 8 and 9 show the windowing version of the TIC and TIF signals at window centers of 0.8411 s, 0.9011 s, and 0.9611 s. The second columns show varying frequency components extracted from the two signals using FFT. The tracing of the variation in the magnitude of the TIC and TIF signals at the first five resolutions is shown in the third columns. The two figures clearly show that the proposed technique traces the nonstationary variation in the signal magnitude at different resolutions more quickly than the FFT. For the TIC case, the fast Fourier transform shows unclear features in order to
IEEE TRANSACTIONS ON POWER DELIVERY, VOL. 25, NO. 3, JULY 2010
Fig. 9. TIF magnitude tracing using FFT and the proposed technique for different data centers.
classify the event. The main feature is detected as a variation in the magnitude at the 50-Hz component. Other frequency components are detected within the frequency band between 50 and 600 Hz. Similarly, TIF features using FFT are detected at the 50-Hz component and for other low frequency content. In contrast, the proposed technique detects the nonstationary variation for both TIC and TIF and localizes it at different resolutions. F. TIC and TIF Feature Extraction The proposed classification technique presented in this paper was evaluated using 20 sets of simulated TIC and TIF data. The event time instant, fault impedance, transformer size and saturation curve, and source and load impedances were varied in order to generate varied simulated signals. The proposed technique was applied to the simulated data and the magnitude of the signal at each resolution level, and were monthe number of coefficients of local maxima itored. Fig. 10 shows the pattern of the number of coefficients at the first three resolution levels as of local maxima changes with a sliding rate of 1.5 cycles. These four groups of features were extracted under random operating conditions with respect to event instant, residual flux, load characteristics, and fault impedance. These features were detected by monitoring the reference resand the number of coefficients of local maxima olution at the first three resolutions . Figs. 11 and 12 show TIC and TIF simulated signals and their classification features extracted from the starting instant of the event. The first columns (Figs. 11(b) and Fig. 12(b)) represent the changes in the at the first three number of coefficients of local maxima resolutions and the second columns (Figs. 11(c) and 12(c)) repmearesent the changes in the magnitude of the signal sured at the third, fourth, and fifth resolutions. The data sliding rate was three cycles, and TIC and TIF events s and s, respectively. At were started at s, TIC and TIF are detected as is changed is increased beyond zero for TIC and from zero and above 1.0 p.u. for TIF. At s (after six cycles from the and event instant) the TIC signal shows a large increase in
GAOUDA AND SALAMA: DSP WAVELET-BASED TOOL FOR MONITORING TICS AND TIFS
Fig. 10. Pattern of the number of coefficients of the local maxima at the first three resolution levels of four data sets under different operating conditions.
1265
Fig. 12. Classification features for the TIF signal: (a) TIC signal, (b) number of coefficients of local maxima, and (c) variation in magnitude.
hence its location in the processing window. If the event is at the beginning of the sliding data, then two sliding intervals will be sufficient for detecting and classifying this event. Faster detection and classification can be achieved by reducing the size of the processing window. A 3-cycle processing window with a sliding rate of 1/2 cycle is discussed in Section V. G. TIC and TIF Auto-Classification The goal of the auto-classification process is to predict the class membership of a distorted signal and to minimize the risk of misclassification. The classification process is automated by of the slope of the monitoring the moving average at the first three number of coefficients of the local maxima resolution levels. The slope in the number of coefficients is (9) and the moving average of the slope is Fig. 11. Classification features for the TIC signal: (a) TIC signal, (b) number of coefficients of local maxima, and (c) variation in magnitude.
a moderate increase in . In contrast, the TIF signal show and a large increase in . a small increase in The classification speed of the TIC and TIF cases depends on the sliding rate selected and the size of the processing window. In this application, the sliding rate is changed to 1.5, 2, 3, and 4 cycles, and the proposed technique demonstrates the ability to detect and classify TIC and TIF from two to three sliding intervals. This ability depends on the instant of the event and
(10) Fig. 13 shows the moving average of the slope at the and TIF signals. first resolution level of 20 sets of TIC The moving average of the data with a sliding rate of 1.5 cycles was computed after 4.5 cycles [Fig. 13(a)], 6 cycles [Fig. 13(b)], and 7.5 cycles [Fig. 13(c)]. No overlap is detected in the feature space, and a threshold can be easily selected in order to auto-classify the TIC and TIF signals. As the number of the sliding data sets increases, more distance is achieved between the feature space, and high classification accuracy results. The
1266
IEEE TRANSACTIONS ON POWER DELIVERY, VOL. 25, NO. 3, JULY 2010
Fig. 13. Moving average of the slope of the number of coefficients of the local maxima at the first resolution level as data slides into the Kaiser window: (a) after 4.5 cycles, (b) after 6 cycles, and (c) after 7.5 cycles.
moving average at the second and third resolution levels shows similar features. The importance of the proposed technique lies in its ability to generate sharp and stable features for the reference resolution that represent the pure power signal. Utilizing a Kaiser window for data processing allows the deletion of misleading coefficients that are generated at the start of the wavelet decomposition process. Controlling the variable in the Kaiser window allows the efficient selection of a threshold value. The number of coefficients required for measuring and localizing any disturbance becomes limited to only two numbers at each resolution level for each data window center. The sliding rate and size of the data window are adjustable in order to match the real-time application for a variety of disturbances.
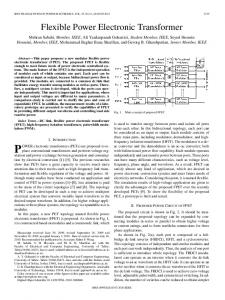
Fig. 14. (a) Primary and secondary currents. (b) Primary and secondary CT currents. (c) Differential current between both sides.
V. MAL-OPERATION OF DIFFERENTIAL PROTECTION IN TRANSFORMERS The proposed technique was implemented in order to study the mal-operation of differential protection and was compared with existing tools that rely on the second harmonic restraint criterion extracted using an FFT. It has been reported that some differential protection equipped with a second harmonic restraint mal-operate during some abnormal disturbances or during the removal of external faults [6], [7]. The differential operation is set to operate under the following two conditions. 1) The magnitude of the fundamental component of the differential current must be greater than the pickup value. 2) The ratio of the second harmonic to the fundamental of the differential current must be lower than 15 %. Fig. 14 shows the original primary and secondary currents ( and ), the primary and secondary currents ( and ) of and , and the differential current between the both sides during an external fault at the secondary side of the transformer. Fig. 15 shows a comparison of differential relay operation conditions using an FFT (left column) and the proposed signal was technique (right column). For both cases, the processed while sliding through a Kaiser window. The was sampled at 2.133 kHz and processed through a three-cycle
Fig. 15. Comparing an FFT-based relay and the proposed technique. (a) Magnitudes extracted from the differential current. (b) Harmonic ratio of the differential current. (c) Tripping signal of the differential relay.
window with a sliding rate of 1/2 cycle. Taking into consideration the processing window effect, Fig. 15(a) shows the FFT and of scaled magnitude of the fundamental component , along with (33 to the second harmonic component 66 Hz) and (66 to 133 Hz) extracted using the proposed technique. The pickup threshold (dashed line) of 0.25 A is used fundamental component magnito detect changes in the as data tude. The x-axis represents the window center slides into the Kaiser window. During the starting period of the and show a fast increase in magnitude external fault, that exceeds the threshold magnitude within 1/2 cycle. This increase satisfies the first trip condition for the differential relay. shows a slow increase in magnitude compared However, . to and of the current are The ratios during shown in Fig. 15(b). Due to the slow increase in the fault starting, the ratio increases to 15 % while
GAOUDA AND SALAMA: DSP WAVELET-BASED TOOL FOR MONITORING TICS AND TIFS
is higher than the pickup threshold, hence generating the trip signal, as shown in Fig. 15(c), which mal-operates the differresults in a ential relay. In contrast, the fast increase in ratio greater than 15 %, and hence no trip signal is generated, therefore preventing the mal-operation of the differential relay. The FFT-based differential relay shows a second mal-operation before the fault is cleared. This effect occurs because the FFT utilizes global bases (sine or cosine functions) that are not localized in time. Therefore, energy is distributed over the whole processing window and shows a slow increase during the fault-start instant and fast decay before the fault-end instant. Furthermore, only the second harmonic magnitude is considered in the FFT-based signal genertool; however, the nonstationary nature of the ates nonstationary changes in the signal frequency components so that monitoring only the 100-Hz component is not accurate signal content. enough to represent the In contrast, the wavelet-based proposed technique uses localized bases (mother wavelets) that concentrate the energy of signal in time. Furthermore, only one coefficient, at the the window center, is used to measure and trace the nonstationary within a 66- to 133-Hz band. Hence, the variation in proposed technique shows a faster increase in magnitude and slower decay until the fault is cleared. VI. CONCLUSION This paper has presented a wavelet-based technique that can be implemented in order to enhance wavelet monitoring tools with respect to generating stable features using a small set of coefficients. Processing data through a Kaiser window and using coefficients of local maxima reduce the size of the wavelet expansion coefficients to a manageable level and generate stable features that can be used to detect, classify, and measure nonstationary variations in power signals. The proposed tool has been implemented on both laboratory and simulated data in order to monitor and classify a variety of TIC and TIF cases. The proposed technique has also been implemented for power transformer differential protection and, compared to an FFT-based tool, shows efficient results for blocking tripping signals during external faults. ACKNOWLEDGMENT The authors wish to thank the Electrical Distribution Department at Al Ain city in the United Arab Emirates (UAE) for their help and support. This work is supported by Grant 09-04-7-11/06 from UAE University. REFERENCES [1] J. L. Blackburn, Protective Relaying Principles and Application. New York: Marcel Dekker, 1997. [2] S. H. Horowitz and A. G. Phadhe, Power System Relaying. Baldock, U.K.: Research Studies Press Ltd., 1992. [3] K. L. Butler-Purry and M. Bagriyanik, “Characterization of transients in transformers using discrete wavelet transforms,” IEEE Trans. Power Del., vol. 18, no. 2, pp. 648–656, May 2003. [4] T. A. Short, Electric Power Distribution Handbook. Boca Raton, FL: CRC Press, 2004. [5] M. M. Eissa, “A novel digital directional transformer protection technique based on wavelet packet,” IEEE Trans. Power Del., vol. 20, no. 3, pp. 1830–1836, Jul. 2005.
1267
[6] X. Lin, H. Weng, P. Liu, B. Wang, and Z. Bo, “Analysis of a sort of unusual mal-operation of transformer differential protection due to removal of external fault,” IEEE Trans. Power Del., vol. 23, no. 3, pp. 1374–1379, Jul. 2008. [7] H. Weng, X. Lin, and P. Liu, “Studies on the operation behavior of differential protection during a loaded transformer energization,” IEEE Trans. Power Del., vol. 22, no. 3, pp. 1386–1391, Jul. 2007. [8] L. Angrisani, P. Daponte, M. D’Apuzzo, and A. Testa, “A measurement method based on the wavelet transform for power quality analysis,” IEEE Trans. Power Del., vol. 13, no. 4, pp. 990–998, Oct. 1998. [9] S. Santoso, E. J. Powers, W. M. Grady, and A. C. Parsons, “Power quality disturbance waveform recognition using wavelet-based neural classifier-part II: Application,” IEEE Trans. Power Del., vol. 15, no. 1, pp. 229–235, Jan. 2000. [10] P. L. Mao and R. K. Aggarwal, “A novel approach to the classification of the transient phenomena in power transformers using combined wavelet transform and neural network,” IEEE Trans. Power Del., vol. 16, no. 4, pp. 654–660, Oct. 2001. [11] O. A. S. Youssef, “A wavelet-based technique for discrimination between faults and magnetizing inrush currents in transformers,” IEEE Trans. Power Del., vol. 18, no. 1, pp. 170–176, Jan. 2003. [12] Y. Sheng and S. M. Rovnyak, “Decision trees and wavelet analysis for power transformer protection,” IEEE Trans. Power Del., vol. 17, no. 2, pp. 429–433, Apr. 2002. [13] A. M. Gaouda, “Power system disturbance modeling under deregulated environment,” J. Franklin Inst., vol. 344, no. 5, pp. 507–519, Aug. 2007. [14] A. M. Gaouda, “Disturbance monitoring in distribution systems,” in Proc. IEEE Transmission and Distribution Conf., Dallas, TX, May 21–24, 2006. [15] C. B. Burrus, R. A. Gopinath, and H. Guo, Introduction to Wavelets and Wavelet Transform. Englewood Cliffs, NJ: Prentice-Hall, 1997. [16] A. M. Gaouda, S. H. Kanoun, M. M. A. Salama, and Chikhani, “Pattern recognition applications for power system disturbance classification,” IEEE Trans. Power Del., vol. 17, no. 3, pp. 677–683, Jul. 2002. [17] A. M. Gaouda, E. F. El-Saadany, M. M. A. Salama, V. K. Sood, and A. Y. Chikhani, “Monitoring in HVDC systems using wavelet-multi-resolution analysis,” IEEE Trans. Power Syst., vol. 16, no. 4, pp. 662–670, Nov. 2001. [18] S. K. Mitra and J. F. Kaiser, Handbook for Digital Signal Processing. New York: Wiley, 1993. [19] C. S. Burrus, J. H. McClellan, A. V. Oppenheim, T. W. Parks, R. W. Schafer, and H. W. Schuessler, Computer-Based Exercises for Signal Processing Using Matlab, ser. Matlab Curriculum Series. Englewood Cliffs, NJ: Prentice-Hall, 1994. [20] N. Watson and J. Arrillaga, “Power system electromagnetic transient simulation,” IEE Power and Energy Series, 2003.
A. M. Gaouda (M’03) received the B.Sc. and M.Sc. degrees in electrical engineering from Garyouns, Benghazi, Libya, in 1982 and 1990, respectively, and the Ph.D. degree in electrical engineering from the University of Waterloo, Waterloo, ON, Canada, in 2001. From 1983 to 1992, he worked in a consultant office, designing distribution systems. Currently, he is an Associate Professor in the Department of Electrical Engineering, United Arab Emirates (UAE) University, Al-Ain, UAE. His research interests include digital signal processing application for monitoring and diagnosis electromechanical systems, and integrating renewable energy resources in distribution systems and smart grids.
M. M. A. Salama (F’02) received the B.Sc. and M.Sc. degrees in electrical engineering from Cairo University, Cairo, Egypt, in 1971 and 1973, respectively, and the Ph.D. degree in electrical engineering from the University of Waterloo, Waterloo, ON, Canada, in 1977. Currently, he is a Professor in the Department of Electrical and Computer Engineering, University of Waterloo. His interests include the operation and control of distribution systems, power-quality analysis, asset management and smart grids. He has consulted widely with government agencies and the electrical industry. Dr. Salama is a registered Professional Engineer in the Province of Ontario