DYNAMIC CALIBRATION AND IMAGE SEGMENTATION METHODS FOR MULTISPECTRAL IMAGING CROP NITROGEN DEFICIENCY SENSORS H. Noh, Q. Zhang, S. Han, B. Shin, D. Reum
ABSTRACT. Site−specific variable−rate nitrogen application is one of the core operations in precision crop management. The determination of an appropriate nitrogen application rate relies greatly on the capability of assessing crop nitrogen stress. A machinery−mounted multispectral imaging sensor has been developed for real−time crop nitrogen deficiency detection on the sprayer during fertilization operations. While field tests indicated that this image−based sensor was capable of detecting crop nitrogen deficiency “on the go,” the test results also showed that this sensor was very sensitive to ambient light changes and needed a considerably long image processing time to extract crop nitrogen deficiency data. To solve these problems, the research has developed a dynamic calibration method to compensate for ambient illumination variation on crop canopy reflectance, an image segmentation algorithm to eliminate the soil background noise, and a correlation model to estimate the SPAD values from the calibrated multispectral crop canopy reflectance. Field validation tests demonstrated that the developed sensor calibration and image processing algorithms improved the performance of the multispectral sensor on detecting corn nitrogen stress. Using the modified sensor resulted in a reasonable correlation between the estimated and measured SPAD values (R2 > 0.72). This research confirmed that it is technically feasible to design a machinery−mounted multispectral imaging sensor to detect crop nitrogen stress reliably and accurately. Keywords. Crop canopy reflectance, Multispectral image sensor, Site−specific crop management, SPAD measurement, Variable rate application.
P
recision crop−production management (PCM) is an information−based agricultural production management technology that is designed to optimize production profitability and sustainability based on spatial and temporal variability in crop growth conditions within a field. Because nitrogen is one of the essential nutrients for corn growth, and the determination of the appropriate nitrogen application rate is very important in corn production, PCM technology can be applied to optimize nitrogen management. Conventional nitrogen management for corn
Article was submitted for review in February 2004; approved for publication by the Information & Electrical Technologies Division of ASAE in November 2004. Presented at the 2003 ASAE Annual Meeting as Paper No. 03135. Trade names used in this publication are solely for the purpose of providing specific information. Mention of a trade name, proprietary product, or specific equipment does not constitute a guarantee or warranty by the University of Illinois and does not imply the approval of the named product to the exclusion of other products that may be suitable. The authors are Hyun Kwon Noh, ASAE Student Member, Graduate Student, and Qin Zhang, ASAE Member Engineer, Associate Professor, Department of Agricultural and Biological Engineering, University of Illinois at Urbana−Champaign, Urbana, Illinois; Shufeng Han, ASAE Member Engineer, Engineering Scientist, John Deere Ag. Management Solutions, Urbandale, Iowa; Beom Soo Shin, ASAE Member Engineer, Associate Professor, Department of Agricultural Engineering, Kangwon National University, Chuncheon, Korea; and Dirk Reum, ASAE Student Member, Graduate Student, Department of Agricultural and Biological Engineering, University of Illinois at Urbana−Champaign, Urbana, Illinois. Corresponding author: Qin Zhang, Department of Agricultural and Biological Engineering, University of Illinois at Urbana−Champaign, 1304 W. Pennsylvania Ave., Urbana, IL 61801; phone: 217−333−9419; fax: 217−244−0323; e−mail:
[email protected].
production is characterized by uniform rate application across the field in the fall, early spring, or in some cases as a side−dress. However, the amount of nitrogen fertilizer needed to achieve the optimum yield varies at different locations in a field due to the spatial variability in soil properties within the field. Uniform−rate nitrogen application often results in over−application in some fractions of the field, which results in adverse effects on environmental qualities (Schepers et al., 1991). While side−dress of nitrogen fertilizer in the growing season has less potential for nitrogen leaching (Van Es and Trautmann, 1990), its efficiency and effectiveness rely heavily on the capability of detecting crop nitrogen deficiency during the application. Several crop nitrogen deficiency detection methods, including plant tissue analysis, soil sample analysis, SPAD (soil plant analysis development) meter measurement, and aerial image analysis, have been used (Piekielek and Fox, 1992; Tumbo et al., 2002; Thorp et al., 2004). Plant tissue analysis and soil test are direct and accurate means of crop nitrogen stress detection, but both methods are time, labor, and cost intensive (Waskom et al., 1996). A SPAD meter measures crop nitrogen stress indirectly, by quantifying the light transmittance of crop leaf, and can easily be adopted by producers. However, the field data acquisition using a SPAD meter is an extremely labor−intensive process, which limits the total number of samples being collected and result in inadequate crop nitrogen stress assessment due to under− sampling. Aerial image analysis, normally using multispectral images, can access crop nitrogen stress over the entire field, but its low resolution and noticeable soil background noise may affect the accuracy of nitrogen stress detection (Tumbo et al., 2002).
Transactions of the ASAE Vol. 48(1): 393−401
E 2005 American Society of Agricultural Engineers ISSN 0001−2351
393
Researchers have investigated different approaches to assess crop nitrogen stress based on multispectral images (Yang et al., 2000; Noh et al., 2003; Borhan et al., 2004). To increase the sensitivity, some normalized vegetation indices, defined by a ratio, a difference, or a difference/ratio combination of the measured reflectance at different wavelengths, are widely used to estimate leaf chlorophyll content (Stone et al., 1996; Ma et al., 1996; Gitelson et al., 1997). Field validation test results verified that the NDVI approach was more sensitive than a direct reflectance measurement approach in detecting low chlorophyll content (Chapman and Barreto, 1997; Shapiro, 1999; Jones et al., 2004). Multispectral reflectance analysis is now widely applied on remote sensing images to provide producers a synoptic view of the nitrogen status for their crop in the form of a map showing spatial variability (Moran et al., 1997; Thai et al., 1998; Lee and Searcy, 2000). While remote sensing can provide a compete view of the field of interest, some technical difficulties, including the accessibility to satellite/aerial images and the need for image calibration and registration, require crop producers to seek professional suppliers to provide technical services, which will reduce, if not eliminate, the economic return from practicing variable−rate nitrogen management (Zhang et al., 2002). The use of ground−based nitrogen stress sensors allows individual crop−based stress assessment during fertilization operations, which not only improves the resolution, but also provides a means for real−time nitrogen stress measurement. Kim et al. (2000, 2001) proposed a ground−based multispectral image sensor to perform high−resolution crop canopy reflectance measurement. They used an ambient light sensor to compensate for the ambient illumination variation caused by change in solar zenith angle and obtained a more constant average gray value of the crop image under different solar zenith angles. Some of the major remaining challenges in using a ground−based sensor include the effect of ambient light strength variation caused by clouds and the influence of background noise created by the soil reflectance on the accuracy of canopy reflectance measurement. In an attempt to address these challenges, this study aimed at developing a dynamic calibration method to compensate for ambient light variation and an image segmentation algorithm to eliminate soil background noise for a multispectral corn nitrogen deficiency (MCND) sensor. The following sections describe the details of the sensor development and the field validation test results.
MATERIALS AND METHODS In this research, a multispectral CCD camera (MS2100, Duncan Tech, Auburn, Cal.) was used to construct the multispectral corn nitrogen deficiency (MCND) sensor. To solve the problems stated in the previous section, this investigation focused on the development of a multispectral image process method, including algorithms, background noise elimination, dynamic image calibration, canopy reflectance analysis, and SPAD value estimation, to assess corn nitrogen deficiency during the side−dressing operation “on the go.” RESEARCH PLATFORM DEVELOPMENT To support the proposed research, a Patriot XL sprayer (Tyler industries, Inc., Benson, Minn.) was modified as a
394
Figure 1. Schematic of the sensor−based variable−rate sprayer research platform.
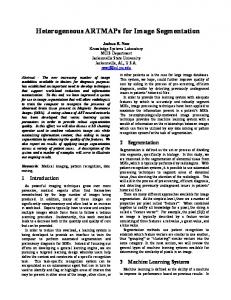
mobile platform for performing data collection as well as sensor−based variable−rate nitrogen application. Figure 1 shows a schematic of the research platform, which consists of 25 liquid−fertilizer application nozzles with a nozzle spacing of 0.76 m and has a 1.80 m clearance in order to travel in the cornfield during the growing season. The MCND sensor was installed on the platform with 1.40 m extension in front of the sprayer and 3.43 m above the ground to acquire crop images in the field. A calibration panel consisting of four known reflectance levels of 42%, 25%, 11%, and 7% was used to support soil background segmentation and camera dynamic calibration. The calibration panel was installed 1.00 m below the camera and located within the view window of the camera. To avoid the reference panel being shaded by the sprayer or by the sensor while taking data, all the data collection was conducted while the sprayer was driving toward the sun. A GPS receiver (AgGPS 132, Trimble, Sunnyvale, Cal.) was installed on top of the sprayer cab to provide the sampling location in the field for both multispectral images and SPAD readings. A PC computer was installed in the cab to control the image collection and to store the collected images for further processing. DEVELOPMENT OF A MULTISPECTRAL IMAGE PROCESSING METHOD The MCND sensor was constructed based on the MS2100 multispectral CCD camera. This camera consists of three CCD channels of green (centered at 550 nm), red (centered at 660 nm), and near−infrared (centered at 800 nm); it has a 25 mm focal length and a 14.6° field of view with an image resolution of 656 × 494 pixels. When the camera was mounted on the sprayer 3.43 m above the ground, each image could cover an area of 2.7 × 2.0 m (four rows of corn). To complete the MCND sensing system, a digital frame grabber (IMAQ PCI−1424, National Instrument, Austin, Texas), installed in a desktop PC computer, was used to capture multispectral images. Integrated with the selected components, this system was capable of capturing a maximum of 30 images per second. In order for the MCND sensing system to perform corn nitrogen deficiency assessment “on the go” during side−dressing, a real−time multispectral image processing method was developed for the multispectral CCD camera. This method consists of three major functions: image segmentation to eliminate soil background noise, dynamic calibration to compensate for ambient light varia−
TRANSACTIONS OF THE ASAE
(a) Original image
(b) Mask image
(c) Segmented image Figure 2. Flowchart of image segmentation algorithm.
tion, and SPAD value estimation based on the obtained multispectral reflectance of crop canopy. The image segmentation algorithm was designed to eliminate the soil background noise for more accurate and robust estimation of SPAD readings based on only the reflectance of the corn canopy. As illustrated in figure 2, the background segmentation algorithm performs three tasks: channel separation, image masking, and image segmentation. The channel separation function is used to split an original image into three monochrome images in the green (G), red (R), and near−infrared (NIR) bands, as shown in figure 3. The image separation function is a built−in function of the multispectral camera and is performed using a color−sorting prism. The monochrome images can be stored separately for further processing. As shown in figure 3, the crop leaf reflectance was much stronger than the soil reflectance in the NIR channel. As comparison, it was very difficult to distinguish the crop leaf reflectance from the soil reflectance in the green channel, and it was almost impossible to distinguish the difference in crop leaf reflectance and soil reflectance in the red channel.
(a) Green channel (a) Green channel
Therefore, the NIR monochrome image was used to separate the soil background from the crop leaves in terms of an appropriate threshold reflectance. As shown in figure 3c, the reflectance value, presented in the form of image gray level (gPNL1) of reference panel area 1 (PNL1) is lower than that from corn leaves but higher than that from soil. Therefore, the segmentation can use the reflectance of PNL1 as the threshold to eliminate the soil background from the image and leave only the corn leaves for further processing. This segmentation process is also defined as image masking and is performed using the following threshold function: 0 g m ( x, y ) = 255
f NIR ( x, y ) ≥ g PNL1 f NIR ( x, y ) < g PNL1
(1)
where gm (x,y) is the masked gray level, fNIR (x, y) is the gray level at point (x, y) in the NIR image, and gPNL1 is the average gray level of PNL1. The image masking process will result in a masked image, as shown in figure 2b, in which the corn leaves became black (gm (x, y) = 0) and the soil background became white (gm (x, y) = 255). The masked image is used to eliminate the
(b) Red Red channel channel (b)
(c)NIR NIRchannel channel (c)
Figure 3. Monochrome images of each channel after separation.
Vol. 48(1): 393−401
395
soil background of the original image by an OR operation, as shown in the following equation: f i ( x, y ) g i ( x, y ) = 255
g m ( x, y ) ∪ f i ( x, y ) = f i ( x, y ) g m ( x, y ) ∪ f i ( x, y ) > f i ( x, y )
(2)
where gm (x, y) is the masked gray level, fi (x, y) is the original gray level, gi (x, y) is the segmented gray level at point (x, y) in original image i, and i represents the G, R, or NIR band image. The background segmentation process treats all the unmasked points in the original image as background noise. The gray level at these points is replaced by the maximum gray level of 255, which represents a white color. The gray levels in the masked points in the original image are kept unchanged so that the spectral information of corn leaf is unchanged from the original image. The reflectance of the corn leaves can be determined based on the average gray value of the corn leaf image. The following equation is used to compute the average gray value of corn leaves in a particular channel of the multispectral image: Gi =
∑ g ci ( x, y)
(3)
nci
where Gi is the average gray value at channel i,gci (x, y) is the gray value of the pixel representing corn leaves, nci is the total number of pixels representing corn leaves in channel i, and i represents the G, R, or NIR channel. After the soil background is segmented from the corn canopy image, it is necessary to calibrate the image to improve the accuracy in determining the reflectance value of the corn canopy under varying light conditions. This dynamic calibration method was developed based on a reflectance calibration panel (30 × 120 cm) with four known reflectance levels. To obtain the desired reflectance, this calibration
panel was divided into four blocks of 30 × 30 cm, each painted using different paints. The calibration panel was made of hardboard, and four flat paints (PPG Architectural Finishes, Inc., Pittsburgh, Pa.) with colors of Flagstone (product code 518−4), Dover Gray (518−5), Knight’s Armors (518−6), and Black Magic (518−7) were used to obtain four levels of known reflectance. These paints were arranged in order from high reflectance to low reflectance. The reflectance levels of the calibration panel were determined by comparing them to Spectralon (a perfectly diffuse reflecting material for applications ranging from the UV−VIS to the NIR−MIR bands) with 100% reflectance. Figure 4 presents the average reflectance of the calibration panel, based on 15 measurements performed under cloudy, partially cloudy, and sunny conditions and in the G, R, and NIR bands using a spectroradiometer. From this test, it was found that, the measured reflectance of a standard reflective material was often different at different spectral bands, even under exactly the same ambient light condition. The measured reflectance was 43%, 26%, 12%, and 7% at the G channel (centered at 550 nm); 42%, 24%, 11%, and 7% at the R channel (centered at 660 nm); and 38%, 22%, 10%, and 7% on the NIR channel (centered at 800 nm) for the four panels, respectively. Since the actual reflectance levels of the calibration panel are known, the measured reflectance can provide a base to perform dynamic reflectance calibration. To support dynamic reflectance calibration, the calibration panel was hung perpendicular to the camera view window, 1.0 m below the camera. During the image acquisition, the reference panel was included in the lower portion of the image, taking up about 20% of the entire image area. The dynamic calibration model calibrated the measured corn leaf reflectance following the approach illustrated by the flowchart in figure 5.
Ô Ô Ò Š
0.5
ÓÓ ÓÓ ÓÓ ÓÓ ÓÓ ÓÓ ÖÖ ÓÓ ÖÖ ÓÓ ÖÖ ÓÓ ÖÖ ÓÓ ÖÖ ŠŠ ÓÓ ÖÖ ŠŠ ÓÓ ÖÖ ŠŠ ÓÓ ÖÖ ŠŠ ÓÓ ÖÖ ŠŠ 0.43
Reflectance
0.4
0.3
0.26
0.2
0
G[550 nm]
R[660 nm]
Channel
Panel 3 Panel 4
0.22
0.11
0.07
Panel 2
ÔÔ ÔÔ ÔÔ ÔÔ ÔÔ ÕÕ ÔÔ ÕÕ ÔÔ ÕÕ ÔÔ ÕÕ ÔÔ ÕÕ ŠŠŠ ÔÔÕÕ ŠŠŠ ÔÔ ŠŠŠ ÔÔÕÕ ÕÕ ŠŠŠ 0.38
0.24
0.12
0.1
ÓÓ ÓÓ ÓÓ ÓÓ ÓÓ ÓÓÒÒ ÓÓ ÒÒ ÓÓ ÒÒ ÓÓ ÒÒ ŠŠ ÓÓ ÒÒ ŠŠ ÓÓ ÒÒ ŠŠ ÓÓ ŠŠ ÓÓÒÒ ÒÒ ŠŠ 0.42
Panel 1
0.10
0.07
0.07
NIR[800 nm]
Figure 4. Average reflectance of the calibration panel at each channel in different wavelengths (based on 15 measurements).
396
TRANSACTIONS OF THE ASAE
Figure 5. Flowchart of the dynamic calibration model.
As illustrated in figure 5, the average corn leaf gray value in a monochrome image for any one of three spectral bands can be determined after the soil background is segmented out. Because the gray values of corn canopy are proportional to energy radiated from the leaf, the gray values at spatial coordinates (x, y) were determined by the amount of illumination energy incident to the leaf and the amount of light being reflected by the leaf using the following equation: f ( x, y ) = I ( x, y ) ⋅ R ( x, y )
(4)
where f(x, y) is the measured gray value of the corn leaf, I(x, y) is the incident energy (in the form of illuminating light) to the leaf, and R(x, y) is the reflective energy from the leaf. Equation 4 reveals that the corn leaf gray value is dependent on illumination conditions. From the same image, we can obtain the average gray values of the calibration panel, which are also dependent on the illumination condition. Corn leaf reflectance can, therefore, be adjusted using the following calibration model to compensate for the illumination variation caused by either the clouds or the solar zenith angle: Ri = α i + βi Gi
(5)
where Ri is the calibrated reflectance of the corn leaf, Gi is the average gray value of the corn leaf image in channel i, ai and bi are model coefficients, and i represents the G, R, or NIR channel. The model coefficients are determined from the measured gray values of the four known reflectance values of the calibration panel by using a least−square linear regression: 4 j =4 ∑ Gi, j j =1
Vol. 48(1): 393−401
j = 4 ∑ Gi, j ∑ Ri, j j =1 α i = j =1 j =4 β j =4 ∑ Gi2, j i ∑ Ri2, j j =1 j =1
where Ri,j is the actual reflectance, and Gi,j is the average gray value of block j of the calibration panel in channel i. The calibrated corn leaf reflectance can be used to estimate the SPAD value, an indirect measure of corn nitrogen deficiency, using a correlation model, as follows: SPAD est = an x n + an −1x n −1 + L + a1 x + a0
where SPADest is the estimated SPAD value of the corn, x is a corn leaf reflectance−related variable, and ai (i = 1, 2, ..., n) is the constant of the model. The selection of an appropriate corn leaf reflectance−related variable was one of the main tasks in the current research. In order to find out the most appropriate form for this variable, the calibrated corn leaf reflectance from the monochrome image in the G, R, and NIR bands was investigated. In addition, the use of various ratios of leaf reflectance obtained from both the visible and near−infrared bands were also investigated. Such ratios of leaf reflectance are dimensionless values and are often defined as vegetation indices of the crop. A vegetation index offers more sensitive and robust assessment of crop nitrogen status than a single channel reflectance (Bausch and Duke, 1996). The use of three vegetation indices, NDVI (normalized difference vegetation index), GNDVI (green normalized difference vegetation index), and RRNG (reflectance ratio in NIR and green bands), in estimating crop SPAD readings was investigated in this study. The following equations represent the definition of these three vegetation indices. NDVI =
j =4
(6)
(7)
GNDVI =
RNIR − RR RNIR + RR R NIR − RG RNIR + RG
(8)
(9)
397
RRNG =
RNIR RG
(10)
where RNIR , RR , and RG are respectively the corn leaf reflectance measured in the near−infrared (NIR), red, and green bands. EXPERIMENTAL FIELD PREPARATION To support the development of the image processing method for the MCND sensor, it is necessary to have crops with sufficient variations in nitrogen deficiency levels. This research conducted a series of baseline tests at the Agricultural Engineering Research Farm of the University of Illinois at Urbana−Champaign to provide the crops with sufficient nitrogen stress variations. The same corn crop (Pioneer 33P27) was planted on May 24, 2002, and eight nitrogen application treatments (0, 33.6, 67.3, 100.9, 134.5, 168.1, 201.8, and 0 kg/ha again) were designed to provide the needed crop nitrogen deficiency levels from extremely stressed to sufficiently fertilized. To provide four replicates of each treatment, a total of 32 test plots were designed, with each plot 18.8 m long and 6.1 m (eight rows) wide. A completely randomized block design was used to assign the specific nitrogen treatment to each test plot, as shown in figure 6. The designed amount of nitrogen fertilizer was applied as a side−dressed application at the V6 growth stage. During field tests, both multispectral images and SPAD meter readings of the corn leaves within the view window of the sensor were collected. The field data collection started at V6 and ended at the R4 growth stage (dough stage). All the collected data were analyzed off−line to provide the baseline data for real−time image processing method development.
RESULTS AND DISCUSSION Six sets of image data were collected from the V6 stage (39 days after emergence) to the R2 stage (110 days after emergence). Among these data sets, three were collected on sunny days and the other three were collected on cloudy days.
The relationships among SPAD readings, leaf reflectance, and vegetation indices are analyzed in the following sections. VARIATION OF LEAF REFLECTANCE WITH CHANGING ILLUMINATION CONDITIONS To evaluate the consistency of the leaf reflectance during the day, images used in this example case were taken every 15 min between 10:00 and 16:30 on October 8, 2002, with a partial cloudy condition. Figure 7 shows the variation in leaf gray−scale value and reflectance measured in the G, R, and NIR bands using the MCND sensor at different times of the day. The enclosed blocks in the figure indicate that the images were taken under cloudy conditions. Otherwise, the images were taken under sunny conditions. Comparing the variation in the measured gray−scale value and reflectance, it can be found that the gray−scale value was more sensitive to the change in lighting condition than the reflectance in all three bands. For example, the average variation of the image gray−scale value in the R channel decreased about 25% when the lighting condition changed from sunny to cloudy (change from the white area to the shadowed area in figure 7) and increased about 26% when the lighting condition changed from cloudy to sunny. In comparison, the average variations of the reflectance in the same channel decreased about 7% when the lighting condition changed from sunny to cloudy and increase about 14% when the lighting condition changed from cloudy to sunny after the dynamic calibration. The leaf reflectance was much less sensitive to illumination conditions than the gray value in all three bands. The MCND sensor outputs also indicated that the solar zenith angle could affect the leaf gray−scale value noticeably. As shown in figure 7a, the gray−scale value changed from 175.9 to 53.3 in the NIR band, from 57.2 to 17.5 in the G band, and from 23.2 to 7.9 in the R band during the entire measurement period from 10:00 to 16:30. This corresponds to percentage variations of 69.7%, 69.4%, and 66.1% in the NIR, G, and R bands, respectively. As comparison, the percentage variations of leaf reflectance due to the effect of solar zenith angle were 23.7%, 25%, and 35.2% for the NIR, G, and R bands,
Figure 6. Experimental design of N application in a field for sensor calibration (1st number in block = repetition, 2nd number in block = N treatment).
398
TRANSACTIONS OF THE ASAE
200
1
Green
NIR
Red
160
0.8
140
0.7
120 100 80 60
Green
0.9
Reflectance
Gray level
180
NIR
Red
0.6 0.5 0.4 0.3
40
0.2
20
0.1
0 10:00
11:00
12:00
13:00
14:00
15:00
0 10:00
16:00
Time
11:00
12:00
13:00
14:00
15:00
16:00
Time (b) Reflectance after calibration
(a) Gray level before calibration
Figure 7. Leaf gray−scale value and reflectance during different time (data points contained in the enclosed blocks were taken under cloudy conditions).
respectively. The solar zenith angle−induced variations were greatly reduced in leaf reflectance measurement due to the dynamic calibration. Analyses of the images obtained from other test dates showed similar results. From these analyses, it can be concluded that the dynamic calibration can effectively reduce variation in leaf reflectance caused by both the illumination condition and the solar zenith angle and result in more consistent and accurate leaf reflectance measurement. CORRELATION BETWEEN SPAD VALUE AND LEAF REFLECTANCE Figure 8 shows the relationship between SPAD value and leaf reflectance obtained from the G and R bands. The data was collected from the experiment field as described in the previous section. Within each image FOV (field of view), six SPAD readings were taken from the youngest fully expanded leaf, and the average value of these six readings was used as the corresponding SPAD value for the image. There was an inverse relationship between SPAD value and leaf reflectance in both bands (figs. 8a and 8b). However, there was no correlation between SPAD value and leaf reflectance in the NIR band (not shown). Applying the least square fitting method, the following equations were obtained to describe the correlation between SPAD value and leaf reflectance: For the G band: SPAD est = 8.683 × RG −0.6378
(R 2 = 0.78)
(11)
For the R band: SPAD est = 14.083 × RR −0.3589
(R 2 = 0.67 )
where RG and RR are leaf reflectance in the G and R bands. The results indicate that the leaf reflectance in the G channel of the multispectral image has a strong correlation with the SPAD value (R2 = 0.78). Therefore, it could be used to assess the corn nitrogen deficiency as the SPAD meter is used. The leaf reflectance measured in the R channel presented a similar relationship, but with a lower R2 value of 0.67. The red reflectance shows very little differentiation, with large SPAD values due to saturation in the R channel. The leaf reflectance obtained from the NIR channel did not show a correlation with the SPAD value (R2 = 0.03), indicating that it could not be used to assess corn nitrogen deficiency. However, the NIR reflectance is most suitable for soil background segmentation, as discussed earlier. To search for more reliable methods to estimate SPAD value based on the leaf reflectance measured from the MCND sensor, different vegetation indices were used in the correlation analysis. Figure 9 shows the relationship between three vegetation indices (NDVI, GNDVI, and RRNG) and the SPAD value. These vegetation indices were computed based on the reflectance obtained from different channels of the multispectral image using equations 8 through 10. The following equations describe the correlation between the SPAD value and each of the three vegetation indices (NDVI, GNDVI, and RRNG) with their corresponding R2 values: For the NDVI index:
60
60
50
50
SPAD
SPAD
SPAD est = 57.424 × NDVI1.4549
40
(R 2 = 0.77) (14)
40 30
30
20
20 0.05
(12)
0.1
0.15
Green reflectance (a)
0.2
0.025
0.075
0.125
0.175
Red reflectance (b)
Figure 8. Relationship between SPAD value and leaf reflectance obtained from the G and R bands.
Vol. 48(1): 393−401
399
60
50
50
50
40
SPAD
60
SPAD
SPAD
60
40 30
30
30
20
20 0.5
20 0.5
0.9
0.7
40
0.6
0.7
0.8
3
5
GNDVI
NDVI
7
9
RRNG
Figure 9. Relationship between the SPAD value and different vegetation indices.
For the GNDVI index: SPAD est = 71.378 × GNDVI1.436
(R 2 = 0.73) (15)
For the RRNG index: SPAD est = 3.9475 × RRNG + 19.469
(R 2 = 0.72) (16)
All three vegetation indices showed a positive correlation to the SPAD value, indicating that the vegetation indices were capable of providing assessment for corn nitrogen deficiency. Further analysis found that both NDVI and GNDVI were more sensitive to the low SPAD range (more nitrogen stressed), and that RRNG was more sensitive to the high SPAD range (less nitrogen stressed). Analysis of the relationship between SPAD value and leaf reflectance indicated that the G band provides a more robust correlation. Both the GNDVI and RRNG indices are suitable for performing in−field crop nitrogen stress assessment.
CONCLUSION The development of an image processing method is reported for a MCND sensor to enhance its capability on assessing corn nitrogen deficiency in real time in terms of
55
55
50
50
Estimated SPAD
Measured SPAD
USE OF THE MCND SENSOR TO ESTIMATE SPAD VALUE To evaluate the accuracy of the MCND sensor in estimating corn SPAD values over the growth season, a field experiment was conducted to compare the estimated SPAD value using the MCND sensor and the measured SPAD value using the SPAD meter. Data were collected from 16 test blocks in the experimental field with four levels of nitrogen treatments and four duplicates in each treatment. Eight measurements were taken from each block using both the SPAD meter and the MCND sensor. Nine sets of data were collected in a period of 79 days from July 1, 2002 (before
nitrogen application) to September 9, 2002. Data taken from the same nitrogen treatment level were averaged. The standard deviations for these nine average SPAD values ranged from of 0.56 to 7.12, and the estimated SPAD values ranged from 0.35 to 4.40. Figure 10 shows the measured SPAD values (fig. 10a) and the SPAD values estimated with the MCND sensor (fig. 10b) over the entire test period. There was a very limited change in SPAD values within the first 25 days after nitrogen application. Such a phenomenon could be attributed to the lack of rainfall in this period. After the first rainfall (56 days after emergence), the SPAD values started to vary among the different nitrogen treatments, indicating changes in crop nitrogen stress. From the SPAD value pattern in figure 10a, it was found that the SPAD measurement on the 69th day after emergence from the blocks with 67.3 kg/ha nitrogen treatment was a probable outlier. The exact cause of this outlier was unknown, and it was likely caused by a measurement error. From the ANOVA analysis of these two sets of SPAD values (measured and estimated), it was found that there were no significant differences in the obtained SPAD values using these two methods (F = 0.015, Fcritical = 3.957, and F < Fcritical).
45 40 35
45 40 35 30
30
25
25 30
50
70
90
110
30
40
50
Days after emergence 0 kg/ha
67.3 kg/ha
134.5 kg/ha
201.8 kg/ha
(a) Measured SPAD readings
60
70
80
90
100
110
Days after emergence 0 kg/ha
67.3 kg/ha
134.5 kg/ha
201.8 kg/ha
(b) Estimated SPAD by green model
Figure 10. Measured and estimated SPAD values at different times under different N treatments.
400
TRANSACTIONS OF THE ASAE
measured crop canopy reflectance. This image processing method uses a soil background segmentation algorithm to effectively filter out the soil background noise from the canopy image, and a dynamic calibration model to compensate for the image gray−scale variation caused by changes in weather conditions or the solar zenith angle. The validation tests indicate that the dynamic calibration model could reduce the sensor output variation from over 69% in the image gray−scale to less than 25% in the compensated leaf reflectance measurement. The G band leaf reflectance, as well as the vegetation indices (NDVI, GNDVI, and RRNG), all had strong correlation with the SPAD value, indicating they can be used to assess corn nitrogen deficiency as the SPAD meter is used. Although the leaf reflectance measured in the NIR band was not suitable for assessing nitrogen deficiency level, it is useful for soil background segmentation. From the field validation test results, the developed image processing method can improve the performance of the MCND sensor in providing more accurate SPAD value estimations for assessing corn nitrogen deficiency in real time. By integrating the MCND sensor with a variable−rate applicator, an on−machinery real−time crop nitrogen deficiency detection system is feasible to support variable−rate nitrogen application in precision corn production. ACKNOWLEDGEMENT The material presented in this article is based upon work supported by the Illinois C−FAR (Council on Food and Agricultural Research: IDA CF 02 E−005−5 AE) and USDA Hatch Funds (ILLU−10−352 AE). Any opinions, findings, and conclusions expressed in this publication are those of the authors and do not necessarily reflect the views of Illinois C−FAR and USDA.
REFERENCES Bausch, W. C., and H. R. Duke. 1996. Remote sensing of plant nitrogen status in corn. Trans. ASAE 39(5): 1869−1875. Borhan, M. S., S. Panigrahi, J. H. Lorenzen, and H. Gu. 2004. Multispectral and color imaging techniques for nitrate and chlorophyll determination of potato leaves in a controlled environment. Trans. ASAE 47(2): 599−608. Chapman, S. C., and H. J. Barreto. 1997. Using a chlorophyll meter to estimate specific leaf nitrogen of tropical maize during vegetative growth. Agronomy J. 89(4): 557−562. Gitelson, A. A., Y. J. Kaufman, and M. N. Merzlyak. 1997. Remote sensing of pigment content in higher plants: Principles and techniques. In Proc. 3rd International Airborne Remote Sensing Conference and Exhibition, 657−664. Copenhagen, Denmark. ERIM International. Jones, C. L., N. O. Maness, M. L. Stone, and R. Jayasekara. 2004. Chlorophyll estimation using multispectral reflectance and height sensing. ASAE Paper No. 043081. St. Joseph, Mich.: ASAE.
Vol. 48(1): 393−401
Kim, Y. S., J. F. Reid, A. Hansen, and Q. Zhang. 2000. On−field crop stress detection system using multispectral imaging sensor. Agric. and Biosystems Eng. 1(2): 88−94. Kim, Y., J. F. Reid, A. Hansen, Q. Zhang, and M. Dickson. 2001. Ambient illumination effect on a spectral image sensor for detecting crop nitrogen stress. ASAE Paper No. 011178. St. Joseph, Mich.: ASAE. Lee, W., and S. W. Searcy. 2000. Multispectral sensor for detecting nitrogen in corn plants. ASAE Paper No. 001010. St. Joseph, Mich.: ASAE. Ma, B. L., M. J. Morrison, and L. M. Dwyer. 1996. Canopy light reflectance and field greenness to assess nitrogen fertilization and yield of maize. Agronomy J. 88(6): 915−920. Moran, M. S., S. Inoue, and E. M. Barnes. 1997. Opportunities and limitations for image−based remote sensing in precision crop management. Remote Sensing of Environ. 61(3): 319−346. Noh, H. K., Q. Zhang, B.−S. Shin, and S. Han. 2003. Multispectral image sensor for detection of nitrogen deficiency in corn by using an empirical line method. ASAE Paper No. 031135. St. Joseph, Mich.: ASAE. Piekielek, W. L., and R. H. Fox. 1992. Use of chlorophyll meter to predict sidedress nitrogen requirements for maize. Agronomy J. 84(1): 59−65. Schepers, J. S., M. G. Moravek, E. E. Alberts, and K. D. Frank. 1991. Maize production impacts on groundwater quality. J. Environ. Quality 20(1): 12−16. Shapiro, C. A. 1999. Using a chlorophyll meter to manage nitrogen applications to corn with high−nitrate irrigation water. Comm. in Soil Science and Plant Analysis 30(7−8): 1037−1049. Stone, M. L., J. B. Solie, W. R. Raun, R. W. Whiteney, S. L. Taylor, and J. D. Ringer. 1996. Use of spectral radiance for correcting in−season fertilizer nitrogen deficiencies in winter wheat. Trans. ASAE 39(5): 1623−1631. Thai, C. N., M. D. Evans, X. Deng, and A. F. Theisen. 1998. Visible and NIR imaging of bush beans grown under different nitrogen treatments. ASAE Paper No. 983074. St. Joseph, Mich.: ASAE. Thorp, K. R., L. Tian, H. Yao, and L. Tang. 2004. Narrow−band and derivative−based vegetation indices for hyperspectral data. Trans. ASAE 47(1): 291−299. Tumbo, S. D., D. G. Wagner, and P. H. Heinemann. 2002. On−the−go sensing of chlorophyll status in corn. Trans. ASAE 45(4): 1207−121. Van Es, H. M., and N. M. Trautmann. 1990. Pesticide Management for Water Quality: Principles and Practices. Ithaca, N.Y.: Cornell University Press. Waskom, R. M., D. G. Westfall, D. E. Spellman, and P. N. Soltanpour. 1996. Monitoring nitrogen status of corn with a portable chlorophyll meter. Comm. in Soil Science and Plant Analysis 27(3−4): 545−560. Yang, C., J. H. Everitt, and J. M. Bradford. 2000. Mapping grain sorghum growth and yield variations using airborne multispectral digital imagery. Trans. ASAE 43(6): 1927−1938. Zhang, N., M. Wang, and N. Wang. 2002. Precision agriculture − A worldwide overview. Computers and Electronics in Agric. 36(2−3): 113−132.
401
402
TRANSACTIONS OF THE ASAE