navigation metaphor called Thought Wizard Metaphor al- lows user- and ..... connecting documents is that the thought flashes occlude the documents behind ...
Dynamic Visualization and Navigation of Semantic Virtual Environments Katja Einsfeld, S. Agne, M. Deller, A. Ebert, B. Klein, C. Reuschling Technical University Kaiserslautern, German Research Center for Artificial Intelligence (DFKI) einsfeld,ebert @informatik.uni-kl.de, agne,deller,klein,reuschling @dfki.uni-kl.de �
Abstract
Although Information Visualization claims to provide the means to induce mental models of any kind of data, the visualization of semantic information is still an open field of research. Existing approaches either concentrate on the visualization of documents without additional metadata or produce unintuitive expert graphics. This paper seeks to fill this gap by presenting a semantic information visualization system with a dynamic 3D interface and intuitive metaphors. The application called DocuWorld visualizes documents, document meta-data, and semantic relations between documents. The general visualization and navigation metaphor called Thought Wizard Metaphor allows user- and context-sensitive adaption of visualization modes and visualization environments.
1 Introduction
The evolution of new information organization strategies like semantic webs and ontologies in the research field of artificial intelligence requires new adequate visualization techniques. Information items will be supplemented with meta-data and related in several ways to other information items. Queries will not only search of text but also for semantic information and even knowledge. Conventional document or file system viewers like the Windows Explorer or KDE’s Konqueror and the 20-year-old 2D desktop metaphor can hardly fullfil these new needs without becoming overcrowded and unintuitive. Thus new user interfaces have to be created to cope with the changing needs. Information visualization techniques, together with the ability to generate realistic real-time, interactive applications can be leveraged to create a new generation of document explorers. An application environment that resembles real environments is used more intuitively by persons without any prior computer knowledge. The users perceive more information about the documents, such as their size, location, and relation to other documents, visually using their natural capabilities to remember spatial layout and to navigate in 3D environments, which moreover frees cognitive capacities by shifting part of the information-finding load to the visual system. It is hoped that this leads to
�
a more efficient combination of human and computer capabilities: the computer has the ability to quickly search through documents, compute similarities, calculate and render document layouts, and provide other tools not available in paper document archives, while humans can visually perceive irregularities and intuitively interact with 3D environments. Last but not least, a well-designed virtualreality-like graphical document explorer is more fun to the average user than a conventional one and thus more motivating.
2 State of the Art
Aduna’s AutoFocus [1] helps searching different kinds of documents. The results are shown in text as well as a organic looking 2D cluster map. The term queries are represented by a color. The clusters are laid out depending on the number of connections and the number of contained documents. The color of the clusters is a mixture of the colors of connected search terms. Unfortunately color-mixtures are not perceived preattentively and therefore some time is needed to understand this informationintensive layout. Card et al. [2] present a hierarchical workspace called Web Forager to organize documents with different degrees of interest at different distances to the user. One drawback of this system, however, is that the user gets (apart from the possibility of one search query) no computer assistance in organizing the documents in space as well as in mental categories. Robertson et al. [5] developed Task Gallery, a 3D window manager, that can be regarded as a simple conversion of the conventional 2D metaphors to 3D. The 3D space is used to attach tasks to the walls and to switch between different tasks by moving them on a platform. The user’s movements and the only advantage of this approach over the 2D windows metaphor is possibility to quickly relocate tasks using spacial memory. The Tactile 3D [7] system, a commercial 3D user interface for the exploration and organization of documents. The file system tree structure is visualized in 3D space using semitransparent spheres that represent folders and that contain documents and other folders. Some attributes of
documents are visualized by different shapes and textures. Objects within a container can be sorted forming 3D configurations like a double helix, pyramid, or cylinder. While AutoFocus intuitively visualizes similarities in two dimensions, the other three systems make use of the third dimension, although their functionality is comparable to conventional document explorers. The DocuWorld visualization presented in the following finally combines both future trends - semantic information and 3D user interfaces.
clusion depth clue (documents occlude parts of the walls). Binocular disparity is provided when stereo output devices are available. Texture on the walls, the lighting conditions, and fog further enhance 3D viewing. Moreover, the user can make use of the motion parallax depth clue, that is also very strong according to Ware’s findings, by rotating the document space or by using the Shake Metaphor: A small predefined and repeated rotation around x-axis helps the user to concentrate more on the structure than on triggering helpful rotations.
3 The Concepts of DocuWorld
3.3
3.1
Semantic Information of DocuWorld
The information space visualized in DocuWorld can be any set of documents that can by indexed and queried by DynaQ. DynaQ stands for Dynamic Queries and is a framework for indexing and searching documents and document meta-data. The index includes all available meta informations and existing semantic informations according to the documents. The framework is built upon Apache Lucene [3] and thus provides the user with the possibilities of boolean queries, range queries, wildcard queries, phonetic queries, and document similarity queries. The dynamic query approach is a flexible paradigm to present data to the user. This is done in a way that she can manipulate the query according to several criteria and directly see the influences on the result. In order to be able to make use of this immediate feedback and detailson-demand mantra, the user interface and thus the visualization also has to be dynamic. DocuWorld is not only dynamic but also completely animated (natural slow-in/slowout behavior of masses) to be able to track changes in the visualization caused by changed queries and to enforce the immersive effect of 3D environments. Moreover, the user can change between various visualization modes depending on her preferences and the current task.
3.2
Immersive 3D Visualizations
There are controversial findings on the usefulness of 3D visualization in Information Visualization (e.g.[6], [8], [9]) which allow few conclusions except the fact that there is still uncertainty about how to make good use of 3Dness. Nevertheless, Ware’s results[8] prove that building a mental model of general graph structures is improved by the factor 3 (stereo vision and motion parallax) compared to 2D visualization. The studies also show that 3D visualization can make use of the spacial memory and that user enjoyment that is generally better for 3D than for 2D visualizations which can lead to more efficient long term use. In order to make good use of 3Dness DocuWorld seeks to combine as many depth clues as possible: A 3D room is used as a border of reference (foremost parts of the room at focal distance) for the human eye. Thus, the user is provided with the strong perspective depth clue and the oc-
The Thought Wizard Metaphor
Intuitive 3D user interfaces with immediate visual feedback and semantic information require new flexible interaction and information navigation metaphors. When considering the organization of documents in 3D space, the locomotion metaphor (user moves through 3D environment) “library”, where the user moves through rows of bookcases, might seem a natural solution at first. There are, however, some valid arguments for the use of a theater metaphor (user stays at fixed point): The library metaphor would only work if each document had a static position in 3D space that could be remembered and relocated by the user with the help of her or his spacial memory. Useful information spaces should, however, allow the user to interact with the information and the visualization should react dynamically to the users requests and needs, which is hard to realize with a static library metaphor. The concept of dynamically reorganizing document collections could be implemented with variations of the theater metaphor. According to the characterizing differences between locomotion and theater metaphors, locomotion metaphors are “egocentric” and theater metaphors “docucentric”. In the context of a document collection application the user’s position is less important or even of no particular meaning. Therefore, the information load needed for understanding and suitably changing the user’s position can be used for the more important analysis of document positions, content, and relations between documents. Consequently, “docucentric” theater metaphors should be preferred over “egocentric” locomotion metaphors. Theater metaphors also have the advantage that users with no experience in navigating in virtual 3D environments and, in complex environments, also expert users are not in danger of getting lost in 3D space. When we try to imagine how a document collection would be treated in order to find a special piece of information or to reveal previously unknown facts in some hundred years, we rather think of a person sitting comfortably in his or her chair, concentrating on nothing than the knowledge work to be done, and pointing on documents or tools which automatically brings several documents in reach and
removes others, than of a person walking along corridors to fetch the needed document. The global visualization and navigation metaphor that was chosen with regard to these considerations is a variation of the theater metaphor and will be called the Thought Wizard Metaphor in the following. When using this metaphor, the user (i.e. the viewpoint) stays where she or he is and the visualization elements are dynamically moved around with respect to the current user need. Apart from restricting the viewpoint to a static point of reference, this allows the use of multiple creative dynamic visualizations: Small scene elements like document representations can be moved around in the viewing volume and create various 3D structures, decoration or global structure elements like walls can change their appearance, and all visualization elements can be moved out of the field of view, probably revealing other elements behind them. The mental model that should develop in the user’s mind when interacting with a application implementing the thought wizard metaphor might be close to that of being an old wise woman using magic tricks to get all the information she needs, directing multiple documents simultaneously to a specified 3D location without effort, and having the power and cleverness to do all necessary knowledge work by comfortably sitting behind her desk and using gestures and magic words.
3.4
Structure on Demand
The term “details on demand” is commonly used in the context of semantic zoom and interactive focus and context views. In these systems, the user starts with an overview visualization and demands more details of special visualization items. In trying to find a good compromise in the trade-off between the number of information items being displayed and the perceivability of the structure, the “details on demand” concept was transferred to the “structure on demand” concept. The idea of this concept is to find a context- and user-sensitive solution to the information structure trade-off by allowing the user to call up and remove certain structure elements depending on the current task and user specific preferences. E.g. the main DocuWorld structure, the walls, can be removed to reveal the area behind it in which 3D structures for user-specific placement of documents are located, and called again when the walls are needed to perceive the 3D structure of the main document visualization more easily.
3.5
Ghost Documents
DocuWorld allows computed semantic structures as well as documents organized by users. This leads to the problem of how to treat user-placed documents: on the one hand, the mental model of the document representation is that of an object with an identity that can be located at only one place at a time; on the other hand, documents placed
at user-specified locations are of special interest to the user and it might be helpful to see their position in a computed semantic structure as well, but displaying one document at different locations would contradict the idea of document identity. The solution implemented in DocuWorld is that of ghost documents: “real” documents are located only in computer organized areas. Whenever the user decides to store a document at a specific place, a “ghost” of this document is automatically created which is moved from the original document to the selected storing place, while the original document stays where it was. Figure 2 shows a computed document structure in the background. Ghost documents, in contrast to real documents, have no 3D shape, but only a flat, slightly transparent surface which makes them look immaterial and ghost-like. It is possible to visually indicate the document the ghost stands for with a special gesture that triggers the rendering of a semitransparent blue box around the corresponding real document.
3.6
Tactical Zoom
In conventional 3D visualizations with perspective projection the operation of scaling and the operation of moving the viewpoint along the z-axis are isomorphic operations, which means that moving the viewpoint has the same result as a particular scaling operation. This is, however, only true for 2.5D visualizations: As soon as stereo viewing is enabled, a scaled down object in the front can be distinguished from an object moved to the back due to binocular disparity that is more or less obvious depending on the quality of the 3D output device. Nevertheless, the (nearly) isomorphism between scaling and translating in z-direction makes it possible to use one operation instead of the other or to combine both operations in order to create new creative visualization- or interaction tools. E.g., Mine et al.[4] used automatic scaling for their scaled world grab: Instead of moving the object to the user’s hand or the user to the object, the world containing the object is scaled until the user can reach the object. For the purposes of DocuWorld it was decided to experiment with z-axis translation and scaling in a different approach: Abolishing the natural connection between translation and scaling might allow to use the scale factor as an additional visualization dimension. The idea, that is called Tactical Zoom, is to use z-axis translation simply and intuitively to organize documents in 3D space and to use the scale or zoom operation not as a substitute for z-axis translation, but for other, tactical purposes. Following this idea, the physical size of documents would not be fixed, but opportunistically resized depending on the visualization situation, thus making more efficient use of 3D space. If, for example, the documents in the bookcase need to have a particular size to all fit into the bookcase, and another doc-
ument size would be more appropriate for organizing the documents in 3D space, they could simply be resized. Of cause, this can lead to conflicting depth clues. Nevertheless, it is not important to the success of the application to understand at what distance the documents in PlaneMode are compared to the one in reading mode or the ones in OrganicMode or bookcase. It is only essential to perceive the spacial relationships and distances between documents in one mode.
4 Information Visualization in DocuWorld 4.1
Data Visualized in DocuWorld
The DocuWorld application starts with a visualization of all documents in the state of being stored in the form of books standing at a bookcase in the back of the room. The user can preselect documents of this collection by typing a search query in the gray search query panel. The search panel is invoked by a gesture, which moves it to the bottom of the screen with the gray search field on the left side. The preselected documents can be thought of as belonging to a higher semantic zoom level than those in the bookcase and should therefore be displayed with more detail. These documents are moved out of the bookcase, rotated so that their textured front page faces the user, and flown to their place in the start configuration of the PlaneMode. While the preselection search query has to be typed in the left search query panel, additional search queries typed in the color-coded right search query panels can be used for more detailed requests.
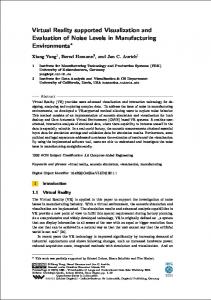
Figure 1: Documents in PlaneMode Figure 1 shows documents in PlaneMode. The Results of the color-coded search queries are visualized by small score bars in front of the documents and, moreover, documents which match more search queries are moved closer to the user than others, bringing the most relevant documents to the front and thus to the focus of the user. Important (e.g. often used) documents show an ani-
mated pulsing behavior and thus instantly catch the user’s eye. The color of the document representation is used to represent the document category and the frontpage is a thumbnail of the first page. The thickness of the book indicates of how many pages the document consists. The yellowness of the documents encodes a scalar value like date (yellowing pages). When the mouse pointer is moved over a document, a label with the file name of the document is displayed directly in front of the document and a preview texture of the first page is displayed in the upper right corner of the screen. There is also the possibility to mark documents with red crosses in order to define useror task-specific interests and not to lose sight of them when they move to different places in different modes. To get a closer view of single documents, they can be moved to the front (the reading position). DocuWorld allows the user to save interesting document configurations and restore them later.
4.2
Visualization of Search Results
PlaneMode, one possibility to visualize Search Results has been explained in the previous section. In ClusterMode, a variation of PlaneMode, the most relevant documents are not only moved to the front but also to the center of the plane (and the focus of the user), which results in a pyramid-shape. Another possibility to organize documents depending on the search results is ClusterMode, as shown in figure 3. Depending on which of the four color-coded searchqueries match a document, the document moves the cluster with the colors of these search-queries. E.g., documents which match the blue and white search-query, but not the black and brown search query are in the cluster with the blue-white-label.
Figure 2: ClusterMode A variation of ClusterMode can be seen in figure 2: The clusters are semitransparent rings in which the documents rotate. (In this figure the wall structure is being removed, the document space and thus also the clusters are rotated,
and a different color-pattern has been used.) There are two different semantics of connecting the clusters to each other: The first is to connect the clusters with only one color with all clusters that contain that color using struts in this color (see figure 2). The second possibility is to connect clusters that have the same color codes except one additional color by a strut in this dividing color (see figure 3). Another feature of ClusterMode is that the user can change between static mode (the position of the clusters is optimized in order to avoid occlusion) and dynamic mode (The position of the clusters reorganizes dynamically. When the user clicks on a cluster this cluster is moved to the focus position.)
4.3
Document Relation Layout
The three document relation types in the general form of “document is related to document , , . . . , and ” are visualized in three different ways—one relation visualization for each relation type—which should be seen as example relation visualizations that could be exchanged or supplemented with other relations. The semantics of these relations could be similar date of creation, same author, or similar buzzwords. Currently, the similarity of content as returned by DynaQ is used. �
�
�
�
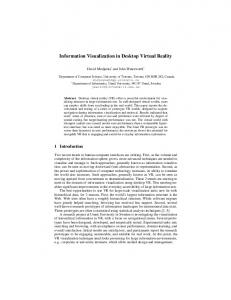
Figure 3: Immersive Document Visualization in DocuWorld Relation Type 1 is intuitively represented by connecting the document under the mouse pointer by curves to the documents to which it is related (see figure 3). These curves might create a mental model like that of thought flashes moving the user’s attention from the current document to related documents. This mental model is suggested not only by the way the curves are rendered with shining particles, but also by the fact that the curves are animated, starting at the document under the mouse pointer and propagating to the related documents. The advantage of this way of representing relations is that documents are visually strongly connected by curves which moreover create an impressive 3D structure. The disadvantage of literally
connecting documents is that the thought flashes occlude the documents behind them, which makes it sometimes hard to understand which documents the curves are pointing to. The visualization of Relation Type 2 tries to make up for this disadvantage: the documents which are related to the document under the mouse pointer are simply visualized with semitransparent green boxes around them. Thus, they can be perceived preattentively and do not occlude anything as the boxes are not much larger than the documents themselves. Also, the box representation can be used without complications in PlaneMode and in the bookcase. Compared to Relation 1, the connection of the document under the mouse pointer and the ones in green boxes are, however, not as intuitively clear as in the case of connecting thought flashes. One possible solution to this dilemma might be to combine the visualization of both Relation Types and their advantages in the visualization of a single relation type—i.e., to use thought flashes that end at documents in green boxes. The visualization and use of Relation Type 3 is different from the previous ones. When enabled, the user has to trigger the display of the relation by clicking on a document. This will display the documents the selected document is related to in the form of ghost documents hovering before the main document space. The user now has the possibility to select one of these ghosts by clicking on it, which will trigger an animation that seems to collapse all of the ghost documents to the real document the selected ghost stands for, and to further visually emphasize this document by displaying a semitransparent red box around it in the moment of collapse.
Figure 4: Navigation of similar documents Annother provided possibility to navigate similar docu-
ments is the similarity cone as shown in figure 4. The selected document is in the center and the most similar documents are arranged around and connected to it in a circle. Documents similar to the ones in the first circle are organized in a second circle. The color of the connecting studs indicates the degree of similarity. As the user moves from one document to the other, the studs and the placement of the documents change dynamically.
4.4
Documents at User Defined Locations
The previously described document collection visualization modes are for the artificially computed organization of documents. To give the user the possibility to organize documents according to his or her own organization principles and to remind him or her of previous thoughts, it was decided to also support user-specific structures. DocuWorld provides two different areas for userdefined document placement: the memory-line in front of all other structure elements and the area behind the environment walls where ghost documents can be placed on human statues as illustrated in figure. 2. The memory-line, which was derived from the idea of a clothesline, allows the user to hang about twenty important or frequently accessed documents on it. In the area behind the walls can be placed more ghost documents that are less frequently accessed. Thus, DocuWorld provides a hierarchical workspace similar to Card’s [2] WebForager. The choice of human figures as a storing place was made because human figures, small changes in their appearance, and thus also objects stored on human bodies are easy to recognize and to remember— much easier than remembering the location of documents on a conventional bookcase.
5 Evaluation and Conclusion
In this work a prototype for a dynamic 3D semantic information system was developed. It was explained how the layout of 3D visualizations should be optimized to make good use of the available 3D space and the Thought Wizard metaphor was introduced as an efficient and flexible global visualization and navigation concept that dynamically moves the visualization items to the user instead of forcing the user to orient him- or herself in a 3D environment. The need for two types of document areas, one for user-specific document management and one for automatically computed document organizations, was established. Compared to the Web Forager approach presented in section 2 DocuWorld provides the user with a more natural environment, more flexible possibilities to store documents at user defined locations, and the visualization of document semantics through automatic document organization modes and visually indicated document relations — a feature not available in the Web Forager approach. All these aspects, together with the visualization of the document metadata, search results, and the relations
between documents, allow preattentive processing of the data, easy and intuitive use, immersion in the animated 3D environment, and navigation from one document to the other by simply using the Thought Wizard tools or displaying document relations. To move the presented approach from prototype state to a usable application, additional research and implementation efforts are currently pursued. Future work focuses on the replacement of keyboard gestures with more natural, easy-to-remember, and immersive gestures (e.g., innovative interaction with data glove). Although a lot of work is still necessary, first user evaluations already prove that expert knowledge workers as well as computer beginners are enthusiastic about the possibilities of dynamic 3D user interfaces to semantic information.
6 Acknowledgments
This research is supported by “Stiftung Rheinland-Pfalz f¨ur Innovation” and the German Federal Ministry of Education and Research (BMBF) and is part of the project @VISOR.
References
[1] Aduna. Autofocus. http://aduna.biz, 2004. [2] S. Card and G. Robertson. The webbook an the webforager: An information workspace for the world wide web. In Proceedings of the Conference on Human Factors in Computing Systems CHI’96, 1996. [3] Lucene. Apache lucene. http://lucene.apache.org/. [4] M. Mine and F. Brooks. Moving objects in space: Exploiting proprioception in virtual-environment interaction. Computer Graphics, 31(Annual Conference Series):19–26, 1997. [5] G. Robertson and M. van Dantzich. The task gallery: A 3d window manager. In CHI, pages 494–501, 2000. [6] M. Sebrechts and J. Cugini. Visualization of search results: A comparative evaluation of text, 2d, and 3d interfaces. In Research and Development in Information Retrieval, pages 3–10, 1999. [7] Tactile. Tactile 3d user interface. http://tactile3d.com/, 2005. [8] C. Ware and G. Franck. Evaluating stereo and motion cues for visualizing information nets in three dimensions. ACM Transactions on Graphics, 15(2):121–140, 1996. [9] U. Wiss and D. Carr. An empirical study of task support in 3d information visualizations. In IV, pages 392–399, 1999.