visualized only using what we call interactive visualization, that is, a kind of .... Web portal. Call center application. CRM system. Legal Aid. CRM. Document.
Centrum voor Wiskunde en Informatica
SEN Software Engineering
Software ENgineering Interactive visualization of dynamic models
F. Arbab, L.W.N. van der Torre REPORT SEN-E0516 NOVEMBER 2005
CWI is the National Research Institute for Mathematics and Computer Science. It is sponsored by the Netherlands Organization for Scientific Research (NWO). CWI is a founding member of ERCIM, the European Research Consortium for Informatics and Mathematics. CWI's research has a theme-oriented structure and is grouped into four clusters. Listed below are the names of the clusters and in parentheses their acronyms. Probability, Networks and Algorithms (PNA) Software Engineering (SEN) Modelling, Analysis and Simulation (MAS) Information Systems (INS)
Copyright © 2005, Stichting Centrum voor Wiskunde en Informatica P.O. Box 94079, 1090 GB Amsterdam (NL) Kruislaan 413, 1098 SJ Amsterdam (NL) Telephone +31 20 592 9333 Telefax +31 20 592 4199 ISSN 1386-369X
Interactive visualization of dynamic models ABSTRACT Models in information systems are usually static in the sense that they can be visualized in a traditional way, using for example diagrams. In this paper we consider models which can be visualized only using what we call interactive visualization, that is, a kind of visualization where interaction with the user is essential. The interaction with the user triggers an action potentially changing the models themselves, and therefore we call them dynamic models. Since dynamic models cannot be printed on paper, we introduce a generic visualization tool supporting the interactive visualization of dynamic models. The first key feature of our interactive visualization tool is a distinction between model content on the one hand, and model visualization on the other hand. Using this distinction, we neither represent actions changing the model as a separate control issue, nor do we consider it as part of the visualization only. Instead, we make the actions an integrated part of the model content. We call this second key feature “action in model”. We show how actions-in-models enable a highly generic visualization tool, and how they support the new notion of interactive visualization of dynamic models. We illustrate interactive visualization with dynamic models used in enterprise architecture. 2000 Mathematics Subject Classification: 68U35 Information systems (hypertext navigation, interfaces, decision support, etc.) Keywords and Phrases: enterprise architecture, interactive visualization, model driven architecture, model transformation
Interactive visualization of dynamic models A new visualization model supported by a generic interactive visualization tool
Farhad Arbab, Leendert van der Torre CWI Amsterdam Abstract
Models in information systems are usually static in the sense that they can be visualized in a traditional way, using for example diagrams. In this paper we consider models which can be visualized only using what we call interactive visualization, that is, a kind of visualization where interaction with the user is essential. The interaction with the user triggers an action potentially changing the models themselves, and therefore we call them dynamic models. Since dynamic models cannot be printed on paper, we introduce a generic visualization tool supporting the interactive visualization of dynamic models. The first key feature of our interactive visualization tool is a distinction between model content on the one hand, and model visualization on the other hand. Using this distinction, we neither represent actions changing the model as a separate control issue, nor do we consider it as part of the visualization only. Instead, we make the actions an integrated part of the model content. We call this second key feature “action in model”. We show how actions-in-models enable a highly generic visualization tool, and how they support the new notion of interactive visualization of dynamic models. We illustrate interactive visualization with dynamic models used in enterprise architecture.
1. Introduction Models in information systems are usually static in the sense that they can be visualized in a traditional way, using for example diagrams. In this paper we propose more dynamic models, which can be visualized only using what we call interactive visualization, that is, a kind of visualization where interaction with the user is essential. For example, consider the removal of a process in a process diagram. The action of removal can be visualized by an action symbol in a diagram, for example a square or a triangle, but it can also be visualized by a sequence of diagrams - a movie - in which the process is actually removed from the diagram. In the latter case, the action of removing a process may involve interaction with the user, for example to select which process is removed, to decide whether as a consequence other processes must be removed or rearranged, etc. This interactive movie is an example of interactive visualization. As models get more complex in information systems or enterprise architecture, their dynamics gets more complicated and their interactive visualization gets more challenging. For example, a dynamic model may contain the replacement of a batch
oriented system by a service oriented architecture, the merger of two departments, the increase of the profitability of a company, etc. All these actions defined in a dynamic model have effects on the model itself and require interaction with the user. A distinctive property of these increasingly complex dynamic models is that their visualizations can no longer be printed on paper to become a part of the usual documentation found around information systems. Instead, dynamic models can only be visualized using interactive visualization supported by a software tool, and thus become part of the electronic documentation. The research question of this paper is how to develop interactive visualization of dynamic models, and our approach is to develop a generic visualization tool to support such interactive visualization. We use the visualization tool to experiment with the new concepts of interactive visualization and dynamic models, and to illustrate it. To break down the research question of this paper, we consider the following three steps to extend a static model to a dynamic model with interactive visualization. 1. In the static model, strictly separate model content from its visualization. To be able to define how models change over time, it is essential to strictly separate the model content from its visualization, as only the model content will be updated. We use a simple ontology for the models, which can be represented in XML documents in the visualization tool. 2. For every model, define the actions that can change the model, including the parameters that must be supplied to the action before it can be executed. The key feature of our new visualization model is that we neither represent update information as a separate control issue, nor do we consider it as part of the visualization only. Instead, we make update information an integrated part of the model content. We call this key feature “action in model”. We show how actionsin-models enable a highly generic visualization tool, and how it supports the new notion of interactive visualization of dynamic models. 3. For every action in each model, define how its parameters can be collected, including the order of steps or protocol to collect them. This includes also the use of virtual input devices (menus, text input, buttons, etc.), variables and constants. The tool architecture contains a model content component and a model visualization component, but not a domain or application specific controller. Instead there is a generic controller to be used for all applications, which is configured by the actions in the models. In other words, whereas the Model-View-Controller pattern illustrates the good software engineering practice to separate the concerns of storing a model in a database, and updating the database, it is not very useful when supporting dynamic models, due to its distinction between model content and control. The motivation for developing the interactive visualization of dynamic models is the integration of architectural enterprise models in the ArchiMate project. We illustrate the interactive visualization engine using dynamic enterprise architectural models.
In this paper we do not consider a methodology to build dynamic models, that is, we do not consider dynamic modeling. We acknowledge the need for such a methodology, but in this paper we focus on the concepts of dynamic model and interactive visualization. The layout of this paper follows the three steps of the creation of a dynamic model from a static one, using a running example of so-called landscape maps in enterprise architecture introduced in Section 2. In Section 3 we discuss how to separate model content from its visualization in the static model of the landscape map. In Section 4 we discuss actions in models that can change the models themselves, including the use and representation of parameters of actions. In Section 5 we discuss how the parameters of the actions can be collected from the user using device handlers, including the use of constants and variables.
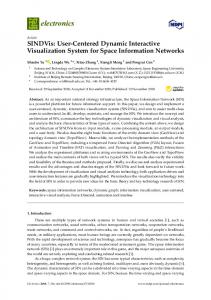
2. Running example: landscape maps in enterprise architecture Enterprise architecture is a rich source of problems and issues that concern models, because of the wide range of models which are used, typically at a high level of abstraction and originating from or oriented towards a wide variety of stakeholders. Model integration is often not feasible due to the heterogeneity of the models, and even maintaining consistency of the models is highly non-trivial. It also leads to inspiration for dynamic models, in particular for the cases in which the update of one dynamic model leads to the update of another model. To explain and illustrate our notion of interactive visualization of dynamic models, we use an example with two models of the same system discussed in (van der Torre et al, 2005), which has been developed within the ArchiMate project (Lankhorst et al, 2005). The example involves ArchiSurance, an imaginary (though reasonably realistic) insurance company. ArchiSurance, originally in the business of home and travel insurance, has merged with PRO-FIT (car insurance) and LegallyYours (legal aid). As a result of this merger, the company’s main products are now in home, travel, car, liability, and legal aid insurance. The first model of ArchiSurance contains a set of diagrams, one of which is visualized on the left hand side of Figure 1. It is based on a set of diagrams, because many systems used by many processes realizing various products and services comprise too much detail to display in a single figure. This web of relations creates a major problem if we want to create insight in the IT support of ArchiSurance.
Products Call center application
Customer Relations & Sales
Business Functions
Web portal
CRM system
Contracting
Legal Aid backoffice system
Legal Aid Car Insurance application
Car
Home & Away
Customer Relations & Sales
Legal Aid CRM
Travel Insurance
Liability Insurance
Car Insurance
Legal Aid Insurance
Customer relationship management system
Legal Aid CRM
Web portal Call center application
Home & Away Policy administration Car insurance application
Claims Processing
Home & Away Policy administration
Premium Collection
Home & Away Financial application
Document Processing
Document management system
Document Processing SSC
Home Insurance
Legal Aid backoffice system
Home & Away Financial application
Document management system
Figure 1. Applications used by departments, and a landscape map. .
The second model shown in Figure 1 is a so-called landscape map of ArchiSurance’s IT applications in relation to its business functions and products. It provides a high-level and abstract overview of the entire IT landscape of the company. From this figure, it is apparent that there is an overlap in ArchiSurance’s IT support, both in the Car insurance application and in the Legal Aid CRM system. We may also say that the figures visualize two views on the same model, but the distinction between models and views is not relevant for this paper.
Landscape map tool The first contours of a landscape map are usually drawn on a white-board, flip-over or piece of paper. Together with the stakeholders the architect tries to address their concerns. The map should be such that it concentrates on the choices that must be made. The drawing must also be such that consequences are visible. In this interaction the architect chooses the concepts on the axes and on the plane, the level of detail, leaving out the facts that are less important. For the sake of readability and acceptance the architect juggles a little bit with the (unwritten) rules of the landscape map. With pen and paper this can obviously be done. Back at the desk and using the tool we envisage, the landscape map must be constructed in a more formal way. First, the architect needs to select the type of concepts used on the X-axis, on the Y-axis, and on the plane (see Figure 2). In our ArchiSurance example, the X-axis contains products, the Y-axis signifies business functions, and the plane holds applications. Next, the objects on these axes must be chosen, the X1, …, Xm and Y1, …, Yn in Figure 2. If a landscape map is used to define a new architecture, these objects can be freely chosen, conforming to the type of the axes. Alternatively, if an existing model is visualised they may be selected from this model. By choosing the concepts for the axes the playing field is defined.
X-axis
X1
Xi
Xm
Y-axis
R1
Y1
R2 Yj
Zk
Yn Figure 2. Landscape map tool.
After this, the architect must choose the type of assertions that are made by putting an object Zk somewhere on the plane, i.e., the relations R1 and R2. In our example, he chooses business functions on the vertical axis, products on the horizontal axis and applications on the plane. The most obvious, intuitive assertion is that an application is used by activities required within the business function in realising the product, giving us R1 = support and R2 = realise. For every object the architect places on the plane, these relations between Xi, Yj, and Zk are instantiated. Furthermore, if the rectangle of the application Zk is not exactly aligned within a row and/or column, then the relations with the X and Y elements are in a sense ‘incomplete’. For example, an application may deliver only some of the functionality needed to support a business function. The landscape map editor can be described in terms of a number of basic actions that can be performed on the map. The initial state of the landscape map editor is an empty canvas. However, the landscape map view is not empty. It contains actions for selecting the type of concepts on the X-axis, on the Y-axis, and on the plane. Once these have been selected, a new view is created which contains actions that allow the user to select and draw the applications, such as the following: • Draw a rectangle (rubber band) covering one or more cells of the map. A user may choose the colour and assign an object (instance of a concept) to the rectangle; • Extend an existing rectangle with another rectangle that overlaps with the original. Colour and label are inherited; • Modify a rectangle:, e.g., its coverage, colour, and value; • Delete a rectangle.
In this way, the landscape map actions work as a kind of bootstrapping mechanism for the landscape map editor. All interaction mechanisms are defined in the actions, not in the editor itself. In other words, the editor is generic, in the sense that it can be used for any other task as well, as explained in the following section.
Generic visualization tool Our generic visualization tool is visualized in Figure 3 below. It cannot only be used to draw landscape maps, but also other models such as diagrams. The left canvas visualises five products on the left, five business functions on the right, and ten application components in the middle. The right canvas visualises a landscape map as above.
Figure 3. Interactive visualization tool with diagram and associated landscape map view
Instead of drawing a landscape map in the landscape map tool, as discussed in the previous section, it can partly be generated automatically from the diagrams, by for example composing relations such as ‘product contains business service’, ‘business service is realized by business process’, ‘business process is part of business function’, ‘business process uses application service’, and ‘application service is realized by application’. This can be supported by a visualization tool, using some heuristics as described in (van der Torre et al, 2005). The question we address in this paper is what happens when we change a relation in a diagram? Clearly the landscape map may change too, but the question is how. Likewise, we may may change something in the landscape map, and the diagrams should change accordingly. Since the landscape map is (partly) generated from the diagrams, we could simple try to regenerate it. However, when we change the landscape map, we do not know how to change the diagrams – there may be several ways in which the diagrams can
be changed, which lead to the same landscape map. This is where the interaction with the user comes in, to choose among the alternatives. Though this is a relatively simple example, the same mechanisms can be applied to more complex models, such as for example models in a security viewpoint. Security is a crosscutting concern and therefore involves elements of many other models. Changing the underlying structure or business processes of a company effects the security, and changing the security model may lead to changes in all other models. In the following sections we explain and illustrate the concept of interactive visualization of dynamic models, as well as the technology, underlying the generic visualization tool.
3. Static models: model content versus its visualization The first step of defining interactive visualization of dynamic models is to distinguish the content of the model from its visualization in the static part of the model. Since the actions in models are allowed to change only the content of the model, and not its visualization, we have to strictly separate the model context from its visualization before we can introduce actions in models. In this section we describe the separation in our running example on landscape maps, and the implications for the interactive tool. It is important to distinguish view content from its visualization, because view content should be semantically meaningful. Models and views should not contain visual references (“above”), but should be phrased in semantically meaningful terms (“more important”). Moreover, there are typically multiple visualisations of the same model, either to satisfy distinct stakeholders or to address distinct concerns. Typically, first the models and views are defined, and only in a second phase their visualisation. Intuitively, the distinction between content and visualization is used to represent the fact that the same content can be visualized in various ways. Figure 3 gives two well known examples. The left hand side shows two visualizations of actor A related to both an actor B and an actor C. The right hand side contains two visualizations of an actor A that is the manager of actors B and C, and there is a staff member D. A
B B
A
A
A
C
C
D
D
B
C B
C
Figure 4 Two visualizations of relations between actors A,B and C; organizational structure
Below, we consider the running example of the landscape map model in more detail.
Model content as an ontology (and in XML) The model content of the set of diagrams is a set of binary relations, and the model content of the landscape map is a three-place relation, detailing for each pair of product and business function which applications are used. A visualization tool can derive the three place relation of the landscape map from binary relations available in the diagrams using simple mathematical operations like composition and projection, and can map the relations to visual objects. More formally, the set of names occurring in the diagrams constitute its ontology (or alphabet, or signature). In the landscape map there is a set of concepts on the X-axis (categories, e.g., products), a set of concepts on the Y-axis (functions, e.g., business functions), and one or more sets of concepts displayed on the matrix (e.g., applications). Moreover, there is a ternary relation that represents a landscape map. Thus, the ArchiSurance example contains the following concepts and one relation. Note that the set of concepts does not make explicit which concepts occur on the X-axis, the Y-axis or on the plane. C = CA∪CX ∪CY∪CZ CA = {product, function, application} CX = {home_ins, travel_ins, …} CY = {customer_rel, claim_processing, …} CZ = {web_portal, call_center, …} R = {use} Furthermore, we assume an implicit “is-a” or subset relation on the concepts, since each element of CX is a product, each element of CY is a function, and each element of CZ is an application. home_ins ⊆ product travel_ins ⊆ product … Finally, the relevant information in the landscape map in Figure 1, e.g., that web portal is used by customer relations & sales, but not contracting, can be represented as follows. use ⊆ home_ins × customer_rel × web_portal ∪ home_ins × customer_rel × call_center ∪ home_ins × customer_rel × crms ∪ travel_ins × customer_rel × web_portal … The relational description of models can easily be represented in XML (deBoer et al, 2004). For example, an enterprise architectural model typically consists of a set of concepts and relations, represented in XML. We do not make any assumptions about the XML representation of models.
Visualization of the static model in the visualization tool How concepts are related to visual objects is not described as part of the model content, but as visualization rules part of the landscape map viewpoint, using terminology of the IEEE 1471-20000 standard on software architecture. The language of the symbols refers to internal codes used in the visualization engine, or codes used in a graphical language using terms like box and circle. (product product-symbol) (function function-symbol) … In the software architecture of the interactive visualization tool, the conceptual distinction between the model content and its visualisation has led to a distinction between a model manager and a visualisation engine: the model manager updates the models, and the model presenter and interactor visualises the models and handles the interaction with the user. Figure 5 expresses the conceptual architecture that underlies our approach to visualization. A model describing the architecture, is the basis. The model content is a selection from that model, possibly augmented with analysis results and subjected to operations such as abstraction and refinement. Viewpoint View Models content
Model update
Presentation View presentation update
content space select derive
visualise
presentation space
Viewpoint
Architect
Stakeholder
Figure 5. Information objects in the viewpoint architecture.
Editing operations on this presentation can lead to updates of the model content and of the underlying model. The creation and update of both the model content and the model presentation are governed by a viewpoint. This viewpoint is jointly defined and/or selected in an iterative process by architect and stakeholder together.
Content space
Stakeholder
Presentation space
*
Line
* Concern
…
*
*
Analysis result
*
Modelling concept
Visualisation symbol
Rectangle
* *
* Model
Node
Visualisation concept Edge
Chart …
Actor
Process …
Figure 6. Content and presentation spaces
The model content is expressed in terms of a ‘content space’ in Figure 6, containing such elements as modeling concepts, stakeholders, and concerns. The model content can be presented in different ways. This presentation is expressed in terms of a ‘presentation space’ in Figure 6, containing e.g. edges, nodes, and charts. This separation between content and visualization is essential to obtain an easily adaptable architecture. If the set of model concepts is changed, or if a new form of presentation is added, the impact of these changes can be kept local. Only the relations between model concepts and visualization concepts need to be updated.
4. Dynamic models: action in model content Having distinguished the model content from its visualization in the static part of the model, and having represented the model content as an ontology in XML, we now extend it to a dynamic model. The model content of a dynamic model contains not only concepts and relations, but also actions that describe how the model or view can be changed. This includes a description of the parameters needed to execute an action. In our running example on enterprise architecture, the basic idea is that enterprise models contain information about how the enterprise might change. During this specification of the dynamic part of the model, in which we define the actions in models, we still have to respect the separation of the model from its visualisation as we already discussed for the static part. The actions should be defined in terms of concepts of the model, not in terms of interaction with the user – just like the static concepts and relations of a model should not be defined in terms of visual elements like boxes and lines. For example, the specification of an action should not deal with interaction issues such as the ordering of the values of the parameters of the action, how the values for the parameters are collected, when the action is evoked, why the action is evoked, etcetera. For example, let us again consider an architect or stakeholder that wishes to change an existing landscape map. First, the effects of this change on the underlying model need to be assessed. Some changes may be purely ‘cosmetic’ in nature, e.g., changing the colour of an object. Other changes need to be propagated to other models, e.g., if an object is added or deleted.
As a more complex example, consider a business process model, and an action that merges two processes into a single process. Parameters of this action are two identifiers for the processes to be merged. Issues which are relevant for the action of merging processes are the effects of the merger, for example the removal of processes, addition of a new process, transferring some relations from the old, removed process to the new process. Issues such as which processes are merged, when processes are merged, and why processes are merged, are not relevant for the specification of the action itself, but are part of the interaction with the user.
Actions = name + parameters + procedure We determine for each action what kind of parameters it needs as input, and define the consequences of executing the action. Actions-in-models represented as action names together with lists of parameters and their types. For example, an organisation may specify what happens when two departments are merged. Such a change to the enterprise is a action-in-model represented by a ‘merge’ action together with two parameters specifying which departments should be merged. The basic atomic actions include adding and deleting concepts and relations, like the addition and deletion of applications in the landscape map. It is good practice to define the actions in model as meaningful operations from a business perspective, for example adding concepts can be described as creating a new department, hiring a new employee, etc. Other atomic actions in the landscape map are, for example, the move of an application to another cell, or changing the columns and rows of the matrix. Next, complex actions can be defined as compositions of these atomic actions. For example, consider a view in which we define the action ‘Decrease the average wage’. We can define this action in terms of actions on the underlying model containing the wages of the employees. For example, we can define this complex action as firing the boss, or decreasing everyone’s wages by some percentage. Moreover, the action-in-model contains a routine name that should be executed (with the collected parameters as inputs) when the action is carried out. This routine defines the actual transformation of the model content, in our visualization tool an XML transformation. For example, when two departments are merged, the routine also specifies what happens with relations of the old department, which may or may not become relations of the newly created department. In the visualization tool we often use an XML transformation tool called RML developed by Joost Jacobs at CWI Amsterdam (Jacobs et al, 2005), and we use a special notation to indicate that the procedure is an RML procedure. However, other XML transformation tools as well as procedures in other programming languages can be used as well. They are linked together dynamically in the usual way.
Actions in ontology of model content (and XML) We have two kinds of things in the model content, i.e., tuples for passive things and tuples that basically describe actions or transformations. To distinguish them in the model content we introduce the reserved keyword "action", such that any tuple that starts with the reserved keyword "action" defines an action tuple. Adding, renaming or removing an application in the landscape map are represented by the following tuples: (action, addApplication, procAdd(X)) (action, renameApplication, procRename(X, Y)) (action, deleteApplication, procDelete(X))
Other more complicated examples are: (action, AddToView, procAddToView(X)) (action, ReduceRisk, procReduceRisk(X, Y)) (action, DeleteProcess, procDeleteProcess(X))
This set of tuples is part of the model/view, and contains no visualization information. The significance of having the "action" keyword is that we know this tuple defines a transformation, and we know from the syntax that the third element is the name of a function followed by a list of typed parameters. In order to invoke this function, the caller must have and supply the appropriate parameters. We assume that the parameters are typed, which is used in the following section to associate device handlers with parameters. For example, each function can be defined by its prototype, just like any standard programming language function interface. Now, the type of the parameter for procAdd(X) will be something like inputString whereas the type of the parameter of procDelete(X) is perhaps elemId, and for procRename(X, Y) we probably have elemId, inputString.
Visualization of actions as buttons Figure 1 also illustrates that each canvas has its own set of actions. Only the actions of the active canvas can be invoked. Most actions are invoked by buttons on the left side of the figure, where inactive buttons are shown in grey. If an action is invoked that changes the underlying mode, such as deleting a component, then both views are regenerated and redrawn. The user can add actions by adding them to the XML file that represents the view, for example by adding a viewpoint rule with the desired effect. Thus, the user interface of the tool can be configured by the viewpoint being visualised, adding an extra layer of flexibility not normally present in typical modelling and visualisation tools.
Somewhere else, as part of the visualization rules for the actions, there must be rules to visualize the appropriate set of buttons. The visualization rules thus say if and when we want to allow the buttons to be used. So we can have tuples like: (AddToView, roundButton) (DeleteProcess, roundButton) (ReduceRisk, roundButton)
This is just like when there is a visualization rule that associates "actor" with "rectangle" in a tuple like (actor, rectangle, ...). The difference is that in the vocabulary of the "graphical symbols" of our visualization engine, we know that anything like "xxxButton" is not just a passive graphical symbol, but an active symbol, and thus can be associated to only "action" type conceptual elements. So, a simple syntactic check ensures that it is indeed allowed to associate "addApplication" with "roundButton", but we cannot associate "actor" with "roundButton". If this round button is pressed, the visualization engine must collect its associated list of arguments and then call the associated function, which may result in a new view/model, which must then be visualized again. In the following section we explain how this interactive visualization works.
5 Interactive visualization of dynamic models We now have to bring the actions to life. Here, traditional visualisation techniques are not sufficient. We need an interactive type of visualisation and we also need interactions with the user, for instance, to obtain values for the parameters of the action. For example, when merging two business processes, it is the user who decides which processes have to be merged, and when. The general idea of this interaction behaviour is as follows. If an interaction item is invoked, then it starts to collect a set of parameters, and thereafter it calls a procedure. There are procedures for adding an application, called addApplication, for deleting actors, called deleteApplication, and for renaming an application, called renameApplication. They are triggered by buttons marked for example A, D and R. The procedures are not part of the interaction but part of the view engine to create a new model. For example: •
When the A button is pressed, there will be a pop-up for name of the actor etc, then the procedure is returned to the model and the action addApplication is invoked, a new model is created, and again visualized.
•
When the D button is pressed, the user has to identify which actor has to be removed by clicking on it, then procedure deleteApplication is called and a new model created.
•
When the R button is pressed, the user first has to indicate which actor must be renamed, then a pop-up appears in which the new name can be typed, procedure renameActor is called, et cetera.
5.1. Device handlers for parameters
The viewpoint contains a mapping from these parameters to (virtual) input devices. Sometimes the input device can be determined automatically by the type of parameter, but in other cases there is still a choice to be made. For example, a department can be identified by entering its name, or by using the mouse to click on it. The visualisation engine will know how to interpret a few basic types: inputString means it somehow has to obtain a string from the user; there can be a type defined like "selectMenu month = (Jan., Feb., ...)" and then if we have a parameter of type month, the visualisation engine knows to show the associated list of the month names and make the user click on one of them; there can be push-button switches, etc. These things are rather standard in GUIs. Thus, there is a small set of types for the visualization engine to recognize as interaction primitives and users can define their own extension, e.g., month as a special case of selectMenue, etc. Many types (perhaps the default case) would simply mean the visualization engine has to make the user click on a graphical item, and look for a match in its set of attributes. For instance, every graphical item will have an elemID attribute, and most will perhaps have a name, etc. The interaction of the user with the tool is visualized in the figure below. We only focus on the model presentation manager. Selection rules
Presentation rules
View content manager
View presentation manager
Model
Selector
View content
Presenter
View presentation
Model manager
Model operations
Interpreter
View content operations
Interactor
Interpretation rules
Figure 7 Tool infrastructure design
Interaction rules
User interactions
5.2. Protocol for interaction
A crucial mechanism underlying the actions is the protocol for interaction dialogues. For example, assume that the editor visualises the landscape map actions as a set of buttons, and that pressing a button triggers the associated interaction protocol. If the user presses the button for adding an object on the X-axis, the system responds with a question for the name of the object, and asks the user where the new column must be added. Clearly, there are also interactions that are not visualised by buttons. For example, the action ‘change columns’ is typically triggered by a user clicking on the column to be moved. If we look at the interaction of the user with the landscape map editor in more detail, we can distinguish the trigger, the atomic steps and the protocol: 1. Typically the dialogues start with a trigger from the user, such as pressing a button on the screen. 2. The dialogue may contain several atomic interactions. For example, when an item is added to an architecture, there are atomic interactions of selecting the kind of item, typing in the name of the item, pointing at a place on the canvas where the item should appear, etc. 3. The protocol tells in which order the atomic interactions should be done. We assume that the protocol consists of a complete ordering of atomic interactions, such that each new atomic interaction can be done only when the previous one has been finished. For example, when a user presses a ‘delete’ button, the editor asks the user which object is to be deleted (Figure 8). Landscape map
User
press delete ask object R3(a,b,c)
Figure 8. Interaction with landscape map
An example of interaction with a landscape map view that is concerned with both the view and the underlying model is represented in the sequence diagram of Figure 9. Landscape Map
User
Model
press delete ask object use(a,b,c) ask subrel realise(b,c) del realise(b,c) rebuild
Figure 9 More complex interaction with landscape map and underlying model
The user presses the delete button, and the landscape map asks which application should be deleted. The user clicks on an application, which we abstractly describe by use(a,b,c). Now for the system to delete this relation from the model, it can due to the construction of our relation use
from support and realise, either delete support(a,b) or realise(b,c). When the user has selected realise(b,c), the action del in the model is called, and finally the landscape map is rebuilt.
Actions may be interpreted in different ways, depending on the stakeholder and his role. The user in Figure 8 is presumably allowed to change the underlying model. However, we can block this permission by updating the action in the view such that the delrealise(b,c) is not triggered by the delete action. Since the actions are specified in the view, and not in the landscape map tool, this blocking can be realised by another landscape map action.
6. Related work The IEEE recommended practice for architectural descriptions IEEE 1471-2000 distinguishes between models and views. In this paper we did not distinguish between the two (in contrast to our general setting within the ArchiMate project (Lankorst et al, 2005)). The popular model-view-controller or MVC architecture used in user interface frameworks, typically distinguishes among a model, a view on that model including its visualization, and a controller including routines to interact with the model. One discriminates among the model, the view (which contains both the selection and visualisation aspects) and the interaction. For example, according to Eriksson and Penker, the MVC architecture may be seen as an instance of the Core-Representation or CR pattern used in business modelling: “The Core-Representation pattern structures the essentials in a problem domain with the purpose of building well-structured and easily changeable models. The core objects of a business, such as debt, agreement, customer, product, delivery, and order, are objects that rarely change fundamentally; conversely, the representations of these objects often change or are extended. A modeller should take this into consideration and separate the core objects from their representations. This process is added by the Core-Representation pattern.” (Eriksson and Penker 1998, pp. 219–222). At this point, it is tempting to define the interaction with the dynamic model and the effect of this interaction in a third component, the controller. However, for our interactive visualization of dynamic models there is also a drawback of this MVC approach – at least when applied in a naïve way. The interaction in the controller is typically domain- or application-specific. Our approach departs from this assumption. Model transformation plays a central role in OMG's Model Driven Architecture (MDA) approach (Frankel, 2003).Although it strongly leans on OMG standards such as UML, the applicability of the approach is not limited to specific languages. However, the concept of a dynamic models transforming themselves does not seem to have been discussed in this context
7. Summary We show how the visualization engine supports the new notion of interactive visualization of dynamic models. Models play a central role in information systems, but such models are usually static in the sense that they can be visualized in a traditional way, using for example diagrams. In this paper we use interactive visualization to propose more dynamic models, which can be visualized only using what we call interactive visualization, that is, a kind of visualization where interaction with the user is essential. The interaction with the user triggers an action potentially changing the model – that is why we call them dynamic models. We introduce also a generic visualization engine to support the interactive visualization of dynamic models. Dynamic models can be seen as extensions of the usual static models like diagrams, and this extension can be achieved in three steps. First, we distinguish the model content from its visualization. Secondly, for every model and view, we define the actions that can change the model or view. Using this distinction, we neither represent actions changing the model as a separate control issue, nor do we consider it as part of the visualization only. Instead, we make the actions an integrated part of the view content. We call this key feature “action in view”. We define also which parameters it needs to have to be executed. Thirdly, for every action, we define how these parameters can be collected. We define the order of steps (protocol), including the use of virtual input devices (menus, text input, buttons, etc.), variables and constants. We illustrate the interactive visualization engine using dynamic enterprise architectural models. Dynamic models are very useful to represent self modifying systems, such as organizational and business systems. In an organization, it is described how actors in the organization can change the organization, for example by merging two businesses. We have shown that dynamic models are useful in enterprise architecture. In this paper we have only considered actions that update the model content, but in a similar way we can consider actions that update the viewpoint. As in our visualization tool viewpoints are represented in XML too, we can use the same technology. Having developed these new concepts and tools, we need a methodology how to use them. In other words, we need to address the modeling with dynamic models. Some preliminary discussion can be found in (Lankhorst et al, 2005). Moreover, we believe that the conceptual level of actions, and the composition of actions in complex actions, is a useful abstraction for modeling with dynamic models.
Acknowledgments
Thanks to Freek Burger for the development of a prototype illustrating the interactive visualization of dynamic models introduced in this paper. This paper results from the ArchiMate project (http://archimate.telin.nl/), a research initiative that has provided concepts and techniques to support enterprise architects in the visualisation, communication and analysis of integrated architectures. The ArchiMate consortium consists of ABN AMRO, Stichting Pensioenfonds ABP, the Dutch Tax and Customs Administration, Ordina, Telematica Instituut, Centrum voor Wiskunde en Informatica, Radboud Universiteit Nijmegen, and the Leiden Institute of Advanced Computer Science.
References F. de Boer, M. Bonsangue, J. Jacob, A. Stam and L. van der Torre, A Logical Viewpoint on Architectures. Proceedings of EDOC'04, 73-83. IEEE. F. de Boer, M. Bonsangue, L. Groenewegen, A. Stam, S.Stevens and L. van der Torre, Change Impact Analysis of Enterprise Architecture. Proceedings of IEEE International Conference on Information Reuse and Integration (IRI'05), 2005. F. de Boer, M. Bonsangue, J. Jacob, A. Stam and L. van der Torre, Enterprise Architecture Analysis with XML. Proceedings of 38th HAWAII INTERNATIONAL CONFERENCE ON SYSTEM SCIENCES (HICSS'05). D. Frankel, Model Driven Architecture: Applying MDA to Enterprise Computing. Wiley, New York, 2003. J. Jacob, RML user guide. Draft, 2005. H. Jonkers, M.M. Lankhorst, R. van Buuren, S. Hoppenbrouwers, M. Bonsangue, and L. van der Torre, Concepts for Modelling Enterprise Architectures. International Journal of Cooperative Information Systems, special issue on Architecture in IT, 13(3): 257-287 (2004). [Lankhorst et al, 2005] M. Lankhorst at al, Enterprise Architecture at work. Springer, 2005. [Van der Torre et al, 2005] L. van der Torre, M.M. Lankhorst, H. ter Doest, J. Campschroer, F. Arbab. Landscape Maps for Enterprise Architectures. CWI technical report SEN E0514, 2005.