ECOSYSTEMS
Ecosystems (1999) 2: 226–236
r 1999 Springer-Verlag
ORIGINAL ARTICLES
Relationship Between Root Biomass and Soil Organic Matter Pools in the Shortgrass Steppe of Eastern Colorado Richard Gill1,2*, Ingrid C. Burke1,2,4, Daniel G. Milchunas3,4, and William K. Lauenroth2,3,4 1*Department
of Forest Science, 2Graduate Degree Program in Ecology, 3Department of Rangeland Ecosystem Science, 4Natural Resource Ecology Lab, Colorado State University, Fort Collins, Colorado, USA
ABSTRACT percent of root biomass was found in the surface 15-cm, while this same soil layer contained 23 percent of profile soil organic C. We measured the highest accumulation of 14C at the soil surface (12.0 ng 14C· m-2·cm-1 depth), with the least accumulation from 75-100 cm (0.724 ng 14C·m-2·cm-1 depth). The highest values of potentially mineralizable C were at the soil surface, with no significant differences in total mineralizable C among the 10-100 cm soil depths. The contribution of POM C to total C reached a profile minimum at the 15-20 cm depth increment, with profile maxima in the surface 5 cm and from 75-100 cm. We estimated that the proportion of particulate organic matter lost annually (kPOM) reached a profile maximum of 0.097 yr-1 within the 10-15 cm depth increment. The 75-100 cm depth increment had the lowest kPOM value at 0.058 yr-1. Thus, within the same physical fraction of SOC, decomposition rates vary with depth by nearly twofold. This pattern of high decomposition rates from 10-15 cm with lower decomposition rates at the soil surface and deeper in the soil profile may be the result of higher water availability in subsurface soils in the shortgrass steppe.
We examined the distribution of soil organic carbon (SOC) fractions and roots with depth to improve our understanding of belowground carbon dynamics in the shortgrass steppe of northern Colorado. Weaver and others (1935) found that the surface 15 cm of soil contained over 70% of the total roots found in a tallgrass prairie soil profile, while only accounting for 40% of the profile soil organic matter. We asked whether the relationship between roots and SOC that Weaver and others (1935) found in the tallgrass prairie was also found in the shortgrass steppe. Weaver and others (1935) suggested that the dissimilarity between belowground biomass and SOC with depth is the result of variability in decomposition rates. In an effort to determine whether patterns of SOC are the result of short-term plant input patterns or decomposition, we measured the 14C content of potentially mineralizable C and particulate organic matter (POM) C ten years after pulse labeling shortgrass steppe vegetation. We also estimated the mass specific decomposition rate constant (kPOM) for POM C through a shortgrass steppe soil profile. We found that the distribution of roots and SOM in the shortgrass steppe were similar to those observed in tallgrass prairie (Weaver and others 1935), with a higher proportion of total root biomass in the surface soils than total soil organic matter. Fifty-seven
Key words: carbon cycling; 14C; plant-soil interactions; soil fractionation
Received 1 September 1998; accepted 20 January 1999. *Corresponding author’s current address: Duke University, Botany Department, Box 90340, Durham, NC 27708 e-mail:
[email protected]
226
Relationship Between Roots and Soil Carbon
INTRODUCTION In 1935, Weaver and others first characterized the distribution of grass roots and soil organic matter through a grassland soil profile. They found that the surface 15 cm of soil contained nearly seventy percent of the root and rhizome biomass found in the entire profile, while this same depth accounted for only forty percent of the profile soil organic matter. Grass biomass belowground was concentrated near the soil surface, while soil organic matter was distributed more evenly throughout the soil profile. If roots are the primary input to soil organic matter in grassland soils (Dormaar 1992), why is there a divergence between the distribution of roots and soil organic matter? Weaver and others (1935) suggested that the dissimilarity between root and organic matter distributions through the soil profile was due to differences in decomposition rates because the warm, wet conditions at the soil surface are more conducive to decomposition of dead plant material than the soil environment in the lower profile. There are at least two alternative mechanisms that could result in the divergence of root biomass and soil organic matter distributions— higher root production per gram root biomass in the lower soil profile than in surface soils or the movement of soluble soil organic matter from surface soils to depths. However, numerous studies in grasslands have shown that there are no differences in mass specific root production based on soil depth (Aerts and others 1992, Hayes and Seastedt 1987, Ares 1972). In addition, Sala and others (1992) and Dodd and Lauenroth (1997) provide some evidence that water movement in grasslands may be insufficient to explain the relationship between SOC and soil depth. The majority of rainfall events in the shortgrass steppe (SGS) are small and of low intensity, and unlikely to cause a major wetting front to redistribute soil organic carbon (SOC) (Sala and others 1982). Understanding controls over the distribution and dynamics of SOC in grasslands is important because a large proportion of ecosystem-level carbon is stored in soils. In the SGS, nearly 90% of totalsystem C is found in soils (Yonker and others 1988; Burke and others 1997). Very little is known about what controls the dynamics of SOC throughout a soil profile. Despite the fact that 50% of soil carbon is stored below 20 cm, most studies and simulations include at most the surface 20 cm (for example: Parton and others 1987, Kelly and others 1996). Also, several simulations predict that the central grassland region of North America may be strongly affected by increased temperatures associated with climate change, resulting in a large efflux of C from
227
soils (Burke and others 1991; Parton and others 1994; Sala and others 1996). Following Weaver and others (1935), other researchers have invoked depth-dependent decomposition rates as a mechanism for explaining the distribution of SOC through soil profiles. Van Dam and others (1997) recently calculated that decomposition in tropical soils may be six times more rapid in the surface 10 cm than below 20 cm. In Eastern Amazonia, Trumbore and others (1995) found that, based on differences in ⌬14C, turnover rates of passive carbon likely decrease sharply with depth. Nakane (1978) found it necessary to include both decreased decomposition rates in the lower soil profile and vertical transport of soil carbon by water movement to adequately model the distribution of SOC in forest soil profiles. Hunt (1977) used higher decomposition rates at the soil surface than at depths in the ELM model to explain SOC dynamics in grassland soil profiles, since water and temperature alone failed to explain the differences in SOC at various depths. However, Elzein and Balesdent (1995) were able to model the distribution of SOC in a forest soil using only vertical diffusion and convection as mechanisms. Three primary factors control decomposition rates: (1) climatic and edaphic properties, specifically soil moisture, temperature, and oxygen concentrations (Nyhan 1976; Berg and others 1993; Kirshbaum 1995); (2) distribution of decomposing organisms (Couˆteaux and others 1995, Santos and others 1984); and (3) chemical characteristics of the decomposing material (Herman and others 1977; Meentemeyer 1978; Melillo and others 1982). Spatial variation in decomposition across temperate grasslands in the United States is highly correlated with moisture, temperature, and soil texture (Burke and others 1989, 1997). Decomposition likely changes with depth since the primary controls over decomposition vary through a soil profile. Both soil moisture and temperature vary with depth (Parton 1978; Sala and others 1992; Dodd and Lauenroth 1997), with maxima at or near the soil surface. During an average year in the shortgrass steppe, the maximum frequency of soil water potentials ⬎ -1.0 MPa occurs from 5-15 cm soil depth, with a minimum frequency below 90 cm (Sala and others 1992). Parton (1984) reported that growing season-maximum soil temperatures at 6 cm soil depth were between 10° and 20° C warmer than maximum soil temperatures at 50 cm. Soil texture also changes throughout soil profiles, depending in pedogenic processes and geomorphology, and is specific to individual sites (Yonker and others 1988). Variability in soil environment also influences the distribution of soil
228
R. Gill and others
organisms. Leetham and Milchunas (1985) found a depth dependence in the distribution of soil microarthropods that partially correlated with soil water availability. One of the difficulties in understanding soil carbon dynamics is the heterogeneity of the organic molecules within SOC (Schlesinger 1977; Townsend and others 1995; Paul and Clark 1996). A portion of SOC is highly occluded, phenolically rich, organic compounds that decompose over millenia (Campbell and others 1967; Jenkinson and Rayner 1977; Van Veen and Paul 1981). Other fractions of SOC are rapidly decomposable and have turnover times of less than weeks (Stevenson 1956; Kirshbaum 1995; Magid and others 1996). In addition, an intermediate component of SOC turns over in decades to centuries (Jenkinson and others 1991; Townsend and others 1995; Kelly and others 1996). The majority of ecosystem models use multiple pools to simulate SOC dynamics, ranging from three to five kinetically defined pools (Jenkinson and Rayner 1977, Van Veen and Paul 1981, Parton and others 1987). Townsend and others (1995) suggest that the intermediate carbon pool is the most likely to respond at time-scales similar to predicted climate change and should be explicitly addressed in soil C studies. Townsend and other’s (1995) contention was borne out by the results of Connin and others (1998), who found that the most significant ecosystem result of desertification in southern New Mexico was an increase in a slowly cycling fraction of soil C. In addition, both Trumbore and others (1995) and Van Dam and others (1997) suggested that ascertaining the contribution of multiple kinetic fractions in bulk SOC, coupled with estimates of plant inputs, can reveal decomposition dynamics through a soil profile. This study focuses on whether the depth patterns of soil organic matter and roots in the shortgrass steppe diverge, and if so, why, specifically evaluating why a lower proportion of soil organic carbon is found at the soil surface than root biomass. Our first goal was to validate the assumption that the surface soils contain a higher proportion of total profile root biomass than soil organic carbon in the SGS. Our primary study objective was to test whether the distribution of SOC with depth is due to patterns of plant input and variation in decomposition through a soil profile by (1) measuring the distribution of a single year’s primary production ten years after labeling the vegetation with 14C, and (2) estimating decomposition rates of a slowly decomposing fraction of soil C through a soil profile. We predicted that labeled organic matter accumulates where inputs are greatest relative to decomposition rates,
and that decomposition rates are highest where soil conditions are most favorable.
METHODS Site Description and Field Sampling We conducted this study at the Central Plains Experimental Range (CPER, 49°498 N, 104°468 W) located in the northern portion of the SGS region, ⬇56 km northeast of Fort Collins, Colorado. The U.S. Department of Agriculture–Agricultural Research Service administers the CPER, which is also part of the National Science Foundation-sponsored Long-Term Ecological Research network (Franklin and others 1990). Monthly average temperatures at the CPER range from -3° C in January to 22° C in July, with a mean annual air temperature of 8.2° C and a 20 year mean annual precipitation of 321 mm (Parton and Greenland 1987, Lauenroth and Milchunas 1992). In 1985, Milchunas and Lauenroth (1992) established eight plots to measure belowground net primary production using 14C turnover techniques (Dahlman and Kucera 1967) on a level upland that had been ungrazed since 1969. Vegetation at this site was dominated by the perennial bunchgrass Bouteloua gracilis (H.B.K.) Lag., with Opuntia polyacantha Haw., Sphaeralcea coccinea (Pursh) Rybd., and Artemisia frigida Willd. a consistent but relatively minor component of total biomass. Basal cover was 25-35%, with B. gracilis accounting for 90% of plant cover (Milchunas and Lauenroth 1989). Others have found a high degree of spatial heterogeneity in soil properties associated with discontinuous plant cover (Hook and others 1991; Burke and others 1997). Each 8m x 8m plot was labeled in 1985 with 2.2 x 10⁸ Bq 14C (6 mCi). We used the pulse label fixed in vegetation as a tracer from a single year’s primary production. During July 1995, we extracted two-1m X 6.6 cm diameter soil cores from previous unsampled areas of each of the eight plots. During July there is typically a mid-summer dry period in the shortgrass steppe that may initiate a period of root senescence. While our interpretation of the data may be limited by sampling only during one time period, seasonality would likely only influence active pools of SOC and have relatively little effect on intermediate or passive SOC pools. Soils were classified as Olney-Owlcreek fine sandy loams. Soil cores were separated into 0-5, 5-10, 10-15, 15-20, 20-35, 35-50, 50-75, 75-100 cm depth increments, placed into plastic bags, and kept refrigerated until processing. Aboveground plant parts were included in the 0-5 cm depth increment.
Relationship Between Roots and Soil Carbon
Laboratory Analysis While soils were field-moist, samples were passed through a 2-mm sieve to remove plant biomass. After sieving, plant material from the 0-5 cm depth increments was classified as tillers, crowns, or roots. Root fragments ⬍ 2 mm were considered soil organic matter. Roots were weighed to determine biomass within soil for each depth increment. These values were not ash corrected because of restrictions on combusting plant materials containing radiocarbon. A 15 g subsample of soil was dried at 55° C for 24 h to determine gravimetric water content. Fine soil density, determined using the mass of sieved soil and core volume, was used to convert data from percentages to mass per volume units We analyzed fractions of soil with differing kinetic properties and determined total C and 14C content for each fraction. We analyzed three fractions of SOC and total SOC. The labile fraction of soil organic matter was estimated using six-month laboratory incubations (Nicolardot and others 1994). This fraction is the SOC pool that turns over most quickly and is the primary source of soil-derived nutrients (Van Veen and others 1984; Beare and others 1992). The soils were incubated at 25° C at field capacity for six months. Thirty-gram soil subsamples were brought to field capacity using deionized water and placed in a 1 qt. (946 ml) mason jar with a scintillation vile containing 4 ml 1.5 N NaOH as a basetrap (Schimel and others 1985). We exchanged basetraps after 7, 30, 60, 90, and 180 days. Each basetrap was weighed to determine water absorption and then subsampled. We titrated 2 ml of the basetrap with HCl to determine CO2 absorbed. The remaining sample was used to determine 14C content of the evolved CO2. We used ScintiSafe PlusTM 50% scintillation cocktail containing phenylxylyn ethane solvent and 2,5-diphenyloxazole (PPO) and p-bis (o-methylstyrl) benzene (bis-MSB) as scintillants to determine 14C content. Scintillation counts were measured using a Packard TriCarb 1500 (Downers Grove, IL, USA) liquid scintillation analyzer. We determined fine and coarse particulate organic matter (POM) using a modification of the Cambardella and Elliot (1992, 1993) method (Kelly and others 1996). Kelly and others (1996) showed that these SOC fractions have turnover times varying between 10 and 200 years, corresponding to the slow kinetic fraction in many conceptual and simulation models (Jenkinson and Rayner 1977; Van Veen and Paul 1981; Parton and others 1987). The coarse POM fraction is predominantly root fragments ⬍ 2 mm, while fine POM consists of organic particles
229
associated with the sand size class. Thirty-gram soil subsamples were shaken in 50 ml of 0.5 mol/L Na-hexametaphosphate on an orbital shaker for 18 h, producing a slurry that was washed through 0.5-mm and 53-µm sieves. The material passing through the sieve contains all water-soluble C and C associated with silt and clay size particles. The C associated with the material remaining on each sieve was considered coarse and fine particulate organic matter. The material was dried at 55° C and weighed. We ground the fine POM using a mortar and pestle. Because of difficulties in homogenizing the coarse POM, we used a perchromate digestion on the entire sample, subsampling the basetrap to determine total C and 14C content, using the conventions utilized with the six-month mineralizations (Snyder and Trofymow 1984). Total C content of the fine POM was determined using automated combustion analysis (LECO CHN-1000 Element Analyzer, St. Joseph, MI, USA). To determine 14C content of the fine POM fraction we used perchromate digestions to oxidize organic C and a NaOH basetrap to capture evolved CO2 (Snyder and Trofymow 1984). The basetrap was analyzed for 14C, following the protocol used with the six month mineralizations. Automated combustion analysis was used to determine whole-soil total C. We found an accumulation of carbonates in the lowest three soil depths. Before analysis, we washed samples from these depths with a solution of 1 N H2SO4 ⫹ 5% FeSO4 to remove inorganic C (Nelson and Sommers 1982). We used the same perchromate digestion protocol/scintillation analysis previously described to determine 14C content. The SOC or 14C unaccounted for in POM or mineralizable fractions was considered a passive fraction. The passive fraction includes organic carbon associated with the silt and clay size classes, and while this fraction may not be exclusively recalcitrant SOC, it is likely dominated by clay-occluded organic matter with extremely slow decomposition rates (Cambardella and Elliot 1992, Kelly and others 1996).
kPOM We used the 14C content in the fractions of SOC to estimate the mass specific decomposition rate constant (k) for the POM fraction, with kPOM representing the average proportion of POM C lost annually since the label was added, either through respiration or modification into more recalcitrant SOC. We used the CENTURY carbon submodel (Parton and others 1987) as a theoretical construct, and made several assumptions based on the model: (i) POM C corresponds directly to the slow kinetic SOC fraction in CENTURY, while passive 14C is total 14C
230
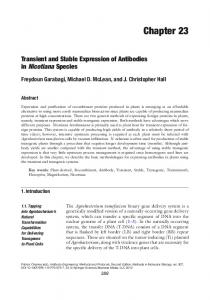
R. Gill and others Figure 1. Relationship between root biomass and soil organic carbon in the shortgrass steppe of Northern Colorado. (a) Soil Organic Carbon g·m-2·cm-1 at eight soil depths, (b) Root Biomass g·m-2·cm-1 at eight soil depths, (c) Weighted contribution of each soil depth to profile total. Since sampling depth is not constant, we standardized all measures to a per centimeter increment.
minus all of the 14C in both POM and six month mineralizations; (ii) the proportion of 14C lost as CO2 during the transfer of POM C to passive C is the CENTURY constant of 0.55—the amount Parton and others (1987) assume is lost as microbial respiration; (iii) all of the 14C in the passive C pool originated from POM 14C. The parameter k is an annual measure, but our sampling occurred 10 yrs after the labeling. Milchunas and Lauenroth (1992) found that the majority, but not all, of root biomass turned over within five years. Therefore, we assumed that the average life span for a root labeled in 1985 was 2.5 years. Based on this estimate of life span, we averaged kPOM over 7.5 years — the time between average root senescence until we sampled 10 years following labeling. We used flux over pool size to calculate kPOM. The flux is the mass of 14C lost from the POM fraction over 7.5 years (passive 14C ⫹ respired 14C). The original pool size is the mass of 14C remaining in POM plus that lost through modification to passive 14C and respiration. We used the equation: kPOM ⫽
1Passive
C⫹
14
0.55 0.45
2
* Passive 14C *
Slow 14C ⫹ Passive 14C ⫹
0.55 0.45
1 7.5 yrs
* Passive 14C
We only calculated k for the POM fraction of SOC because we felt that it was the only fraction we measured that adequately met the assumptions implicit in using the CENTURY C submodel. Since the POM fractionation technique was explicitly designed to correspond with the slow fraction in CENTURY, our assumption of the relationship between the measured and theoretical fractions was considered robust.
Statistical Analyses We evaluated the influence of depth on the response variables using a repeated measures, autoregressive analysis of variance (SAS, SAS Institute Inc., Cary, NC). We considered the eight soil depths within a single core as a repeated measure, since the eight depths are not independent and are likely influenced by the small-scale spatial heterogeneity typical of the SGS (Hook and others 1991). Depth was our fixed effect and core was the random effect. We used a first order autoregressive covariance structure. We then made pairwise comparisons using Tukey’s HSD between the eight depths to determine which depths were significantly different for each response variable. Since all eight plots are within the same area, these results should not be considered representative of the entire SGS.
RESULTS Roots and Soil C Root biomass decreased exponentially with depth, with nearly 66% of root biomass in the upper 10 cm (Figure 1). Root biomass declined from 150 g biomass m-2 cm-1 depth in the surface 5 cm to 4.3 g m-2 cm-1 in our lowest soil depth increment (Table 1, Figure 1). Total organic soil C also decreased with depth, although only 34% of the whole profile organic C was in the upper 10 cm (Figure 1). Soil organic C declined from 140 g m-2 cm-1 at the soil surface to 42 g m-2 cm-1 from 75-100 cm (Table 1, Figure 1). These results are consistent with those of Weaver and others (1935), who concluded that the surface 15-cm of tallgrass prairie soils contained a higher proportion of the total profile roots than soil organic matter.
Relationship Between Roots and Soil Carbon
231
Table 1. Site Characteristics for 14C Labeled Plots at Central Plains Experimental Range (Colorado, USA) Bulk Density (g/cm3 )
Texture
Depth (cm)
% Sand
% Clay
Root Biomass (g/m2 )
0–5 5–10 10–15 15–20 20–35 35–50 50–75 75–100
0.88 1.09 1.16 1.17 1.32 1.32 1.34 1.34
67 68 64 63 59 58 69 66
16 17 18 21 25 26 21 21
752.6 (0.389) 227.6 (0.417) 158.1 (0.413) 134.0 (0.784) 217.1 (0.351) 194.4 (0.367) 210.4 (0.565) 107.4 (0.432)
Bulk density was measured as the total core mass/core volume; roots were removed from soil by sieving soil through a 2 mm sieve (n ⫽ 16); coefficient of variation (CV) is expressed as standard deviation/mean in parentheses
Table 2. 14C Content in Three Soil Organic Carbon Fractions and Bulk Soil
Depth (cm)
Six Month Fine Mineralized POM C C (ng (ng 14C/m2) 14C/m2)
Coarse POM C (ng 14C/m2)
C (ng 14C/m2)
0–5 5–10 10–15 15–20 20–35 35–50 50–75 75–100
2.3 (0.60) 0.58 (0.38) 0.28 (0.19) 0.18 (1.16) 0.88 (0.90) 1.2 (2.42) 0.67 (1.00) 0.71 (0.96)
8.5 (5.6) 4.8 (3.5) 2.2 (1.1) 1.1 (0.44) 7.0 (3.7) 3.9 (2.3) 2.6 (1.8) 3.8 (3.9)
60.3 (14.5) 26.0 (10.0) 17.2 (10.5) 7.3 (4.3) 43.5 (22.4) 23.0 (11.1) 19.6 (13.7) 18.1 (11.1)
23.3 (0.39) 9.2 (0.46) 2.2 (1.81) 1.9 (0.58) 13.0 (0.68) 9.2 (0.61) 7.8 (0.59) 7.4 (0.55)
Six month mineralized 14C was measured using laboratory incubations and represent potentially mineralizable C; coarse POM 14C is organic 14C ⬎ 0.5 mm but ⬍2 mm; fine POM 14C is organic 14C smaller than coarse POM C but ⬎53 µm; total 14C is carbon found in bulk soil, after removing carbonates. Coefficient of variation (CV) is expressed as standard deviation/mean in parentheses. (n ⫽ 16)
14C
in SOC
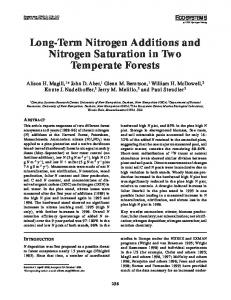
The distribution of 14C mass decreased from a high of 12.0 ng 14C m-2 cm-1 in the surface 5 cm to 0.724 ng 14C m-2 cm-1 at the 75-100 cm depth increment (Table 2). Ten years after pulse labeling, most of the 14C remaining from the 1985 growing season was in fine or coarse POM C, although a large proportion of 14C was found in fractions other than those we measured (Figure 2). Less than 2% of the total 14C was found in the 6-month mineralizations. Between 50 and 70 percent of whole soil 14C was in the combined fine and coarse POM fractions.
Figure 2. Relative contribution of 14C within soil fractions to total 14C found in each soil depth. Other represents the 14C unaccounted for in the six-month mineralizations or either particulate organic matter fraction.
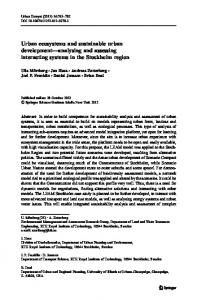
SOC Fractions The surface 5 cm contained significantly more mineralizable C per cm than any of the other soil depths (p⬍0.01, Figure 3a, Table 3). Over six months, the 0-5 cm increment mineralized 2.4 g C m-2 cm-1 depth. Other than the pairwise comparison between 5-10 cm and 35-50 cm, where 5-10 mineralized more C than 35-50 cm, there were no other significant differences in C mineralized among depths over six months. The surface 5 cm also contained the highest mass of fine POM C per unit depth (Figure 3b, Table 3). The 75-100 cm depth contained the same mass of fine POM C as the 5-10 cm depth increment. The lowest fine POM C values were found at intermediate depths from 10-75 cm. Coarse POM C, composed primarily of root fragments, was greatest in the surface 10 cm and from 20-35 cm. The depths between 50 and 100 cm had the lowest coarse POM mass (Figure 3c, Table 3). The relative contribution of total POM C to total C varied through the soil profile (Figure 4). POM C contributions to total C were high at the soil surface (34%), declining to a minimum of 16% in the 15-20 cm depth increment, and increasing to a maximum of 56% at the lowest depth. The lowest 25 cm of the soil profile had a higher proportion of POM C than any of the other
232
R. Gill and others Figure 3. Mass of measured soil fractions at eight soil depths, standardized per 1-cm soil depth. (a) Total C mineralized over six months; (b) fine particulate organic matter C; (c) coarse particulate organic matter C. Depths marked by different letters are significantly different (p⬍0.05).
Table 3. C Mass for Three Soil Organic Carbon Fractions and Bulk Soil Depth (cm)
Six Month Mineralized C (mg/m2 )
Fine POM C (g/m2 )
Coarse POM C (g/m2 )
C (g/m2 )
0–5 5–10 10–15 15–20 20–35 35–50 50–75 75–100
1189.2 (0.378) 860.5 (0.401) 850.0 (0.414) 751.1 (0.351) 1936.9 (0.365) 1734.81 (0.349) 3055.34 (0.421) 3070.4 (0.325)
202.1 (0.271) 86.6 (0.170) 53.1 (0.342) 42.4 (0.165) 202.0 (0.291) 153.7 (0.371) 360.1 (0.467) 517.9 (0.244)
37.5 (0.181) 35.5 (0.229) 27.3 (0.259) 22.4 (0.349) 100.0 (0.299) 68.2 (0.310) 72.3 (0.368) 80.2 (0.655)
701.2 (0.199) 494.5 (0.115) 412.8 (0.281) 394.4 (0.102) 1429.5 (0.158) 1221.9 (0.293) 1318.4 (0.196) 1074.4 (0.142)
Six month mineralized C was measured using laboratory incubations and represent potentially mineralizable C. Coarse POM C is organic C ⬎0.5 mm but ⬍2 mm; fine POM C is organic C smaller than coarse POM C but ⬎53 µm; total C is carbon found in bulk soil, After removing carbonates; Coefficient of variation (CV) is expressed as standard deviation/mean in parentheses. (n ⫽ 16)
kPOM The estimates of kPOM ranged from a maximum of 0.097 yr-1 within the 10-15 cm depth increment to a minimum of 0.058 yr-1 for the 75-100 cm depth, forming a parabolic distribution from the soil surface to 1 m (Figure 5). Decomposition of POM C in the 10-15 cm depth increment was significantly more rapid than all other soil depths except 20-35 cm. POM C decomposed more slowly within the 75-100 cm than in the surface 35 cm.
DISCUSSION Roots and SOC Figure 4. Relative contribution of total particulate organic matter C (fine⫹coarse POM) to total soil organic C at eight soil depths. Depths marked by different letters are significantly different (p⬍0.05).
depths (p⬍ 0.05). Also, the surface 5 cm and the 50-75 cm depth increment had a significantly higher proportion of POM C than all depths between 5 and 50 cm.
Our first research objective evaluated the assumption that the distributions of roots and SOC in grassland soils diverge. We found distributions similar to those found by Weaver and others (1935), with a higher proportion of roots in the soil surface relative to soil organic matter. Jenny (1941) interpreted Weaver and others’ results as indication of the influence of plants on soil development, implying that, in part, root distributions control the accumulation of SOC. However, the distribution of SOC through a soil profile is determined by patterns
Relationship Between Roots and Soil Carbon
233
decomposition were removed and significantly more CO2 was evolved in the surface 5 cm than for lower soil depths. The environmental controls that influence the accumulation of mineralizable C also affect POM C. The accumulation of POM C at the soil surface is likely also due to the relationship between high detrital inputs and decomposition rates slower at the surface than in adjacent subsurface soils. The accumulation of fine POM from 75-100 cm is presumably due to extremely reduced decomposition rates coupled with low root inputs. 14C
Figure 5. Mass specific decomposition rate constant for total particulate organic matter. Depths marked by different letters are significantly different (p⬍0.05). This constant was determined using a flux over pool size approximation, averaging over 7.5 years.
of both detrital inputs through plant production and outputs through decomposition. Our second and third research objectives focused on identifying possible mechanisms underlying the observed patterns, by characterizing how detritus accumulates in SOC fractions and how decomposition varies through a soil profile. A weakness in the comparison between root biomass and SOC is that input rates of all biomass should influence the distribution of SOC, rather than root standing crop. Ares (1976) showed that root turnover at the CPER is not constant with depth. Highest rates of root senescence occurred in 10-20 cm depths, with roots in the lower soil profile persisting much longer than surface roots. Hayes and Seastedt (1987) also observed this pattern of root turnover at a tallgrass prairie site. Furthermore, senescence of aboveground plant organs, while not thought to be a major input to SOC, also contributes to organic C in surface soils (Dormaar 1992; Burke and others 1997). Therefore, an even higher proportion of total plant inputs are found at the soil surface relative to SOC, provoking the question of why proportionately more SOC does not accumulate at the soil surface. We found a consistent pattern in the distribution of SOC fractions with depth. The higher proportional contribution of mineralizable C in the upper 5 cm than at depth may be due to rapid inputs of aboveground and belowground detritus, coupled with suppression of microbial activity in the field due to frequent water deficits. When soils were incubated in the lab, water-induced constraints on
and SOC Pools
Monitoring the fate of 14C enabled us to monitor how a single year’s input was incorporated into SOC. Ten years after Milchunas and Lauenroth (1992) pulse-labeled plants with 14C, we found most of the remaining 14C accumulated in the upper soil layers. We determined that the majority of the 14C was in the coarse and fine POM fractions of SOC. Hassink and Dalenberg (1996) showed that 14C in labeled ryegrass detritus was rapidly lost through respiration, and 180 days after the initiation of laboratory incubations very little 14C remained in either soluble or light SOC fractions. However, while soils below 50 cm contained low concentrations of 14C, they still had a relatively large absolute amount of 14C relative to the upper soil profile. Many studies have concluded that deep soils are ancient and not an important component of shortterm soil C cycling (Boutton and others 1998). The presence of 17.5 % of recovered 14C below 50 cm indicates that soil C cycling in the lower soil profile is at least partially influenced by current vegetation dynamics. While a significant proportion of SOC accumulates below 50-cm, less total soil C is of recent origin below 50-cm than in the surface 15-cm. This may, in part, explain why the radiocarbon age of soil C increases with depth in most studies (Boutton and others 1998, Van Dam and others 1997, Trumbore and others 1995).
Decomposition The kPOM estimates clearly show that decomposition rates of particulate organic matter are slower below 50 cm than in sub-surface soils, supporting the interpretation of Weaver and others (1935). However, their initial assumption that maximum decomposition rates occur at the soil surface was not supported, although in the more mesic tallgrass prairie this may be true. Assumptions need to be met in order to use 14C-pulse labeling experiments to determine SOC decomposition rates. Van Dam and others (1997) suggested that all new plant tissue should have the
234
R. Gill and others
same specific activity. A problem with this assumptions is that in the SGS there is an interaction between season and root elongation, making it impossible to label plants at a time when all roots are growing at the same rate (Ares 1976). As a result, the 14C label may not have been uniformly distributed throughout the root system. However, seasonal differences may, in part, be due to soil water conditions, and the plots used were watered prior to labeling to maximize the probability of root growth throughout the profile. The patterns of POM decomposition with depth is likely a product of changing soil conditions through a soil profile. Edaphic factors, and their influence on soil biota, likely control decomposition rates. We hypothesized that decomposition rates should be maximized where conditions are most favorable. Maximum soil temperatures in the SGS during the growing season are highest at the soil surface (Parton 1984). If temperature is the primary control over decomposition with depth, kPOM should be greatest at the soil surface. However, SGS soils frequently experience water deficits in the upper soil profile due to evaporation and transpiration (Sala and others 1992). Our results suggest that the influence of water availability on soil biota may be the most important factor limiting decomposition rates in the SGS. Sala and others (1992) demonstrated that the 5-15 cm depth is the region of the soil profile most frequently experiencing water potentials ⬎ -1 MPa (Figure 6). In addition, Leetham and Milchunas (1985) showed a bimodal distribution of soil microarthropods with depth in the SGS. They theorized that the two peaks were the result of association of microarthropods with surface detritus and with intermediate soil depths with the highest frequency of available soil water. Van Dam and others (1997) concluded that as simulated diffusional transport is reduced, depth-dependent decomposition rates become the primary determinant in explaining the distribution of SOC. A final factor that may influence decomposition rates with depth is soil texture. Percent clay increases with depth from surface soils to 20-50 cm, and decreases slightly in the lower 50-cm. Higher clay content may contribute to the occlusion of soil C and an increase in passive soil C. In addition, variation in soil texture with depth has a strong influence on the transport of water through the soil profile (Jury and others 1991). We found that within physically similar fractions of SOC, decomposition rates vary by almost twofold based on location in a soil profile. The few other studies that have evaluated SOC turnover with depth have reported larger depth-induced differ-
Figure 6. Relative frequency of water potentials ⬎ -1 MPa for an average year at the Central Plains Experimental Range (from Sala and others 1992).
ences in SOC turnover among soil layers than we found, although they have evaluated whole soils rather than single soil fractions. Hunt (1977) simulated patterns of decomposition in the shortgrass steppe and calculated an eight-fold decrease in maximum decomposition rate from the 0-4 cm depth-increment to the 15-60 cm depth-increment. Van Dam and others (1997) determined that rates of soil C decomposition in the Atlantic Zone of Costa Rica are three times more rapid in the 0-5 cm depth increment than in soils below 40 cm. Boutton and others (1998) reported that mean residence time for soil C in subtropical savanna was between 20 and 40 times longer from 90-120 cm than in the surface 15 cm. As Jenny (1941) suggested, plants may have a strong influence on soil development. Since SOC in the lower soil profile has much longer residence times than SOC from 15-20 cm, changes in detrital input rates through the soil profile will alter the organic C storage capacity of grassland systems. Shifts in plant functional type dominance in arid and semiarid systems are occurring globally (D’Antonio and Vitousek 1992, Schlesinger and others 1990, Archer 1995) and may influence both detrital input patterns and output rates through changing system hydrology (Dodd and Lauenroth 1997, Jackson and others 1997). Changing biomass allocation patterns as a result of shifts from shallow to deeply rooted species potentially may alter whole
Relationship Between Roots and Soil Carbon
235
system carbon storage. Certainly detrital inputs are extremely important in controlling patterns of SOC accumulation. However, our results indicate that in semiarid systems changing water distribution patterns may also strongly influence patterns of SOC accumulation and losses.
Dormaar JF. 1992. Decomposition as a natural process in grasslands. In: Coupland RT, editor Natural grasslands: Introduction and Western Hemisphere. New York: Elsevier. p 121-136.
REFERENCES
Hassink J, Dalenberg JW. 1996. Decomposition and transfer of plant residue 14C between size and density fractions in soil. Plant Soil 179:159-69.
Archer S 1995. Tree-grass dynamics in a Prosopis-thornscrub savanna parkland: reconstructing the past and predicting the future. Ecoscience 2:83-99. Ares J. 1976. Dynamics of the root system of blue gramma. J Range Mgmt 29:208-13. Berg B, Berg MP, Bottner P, Box E, Breymeyer A, de Anta RC, Couˆteaux M, Escudero A, Gallardo A, Kratz W, Madeira M, Malkonen E, McClaugherty C, Meentemeyer V, Munoz F, Piussi P, Remacle J, de Santo AV. 1993. Litter mass loss rates in pine forests of Europe and eastern United States: some relationships with climate and litter quality. Biogeochemistry 20: 127-59. Beare MH, Parmalee RW, Hendrix PF, Cheng W, Coleman DC, Crossley DA. 1992. Microbial and faunal interactions and effects on litter nitrogen and decomposition in agroecosystems. Ecol Monogr 62:569-91. Boutton TW, Archer SR, Midwood AJ, Zitzer SF, Bol R. 1998. dgr;13C values of soil organic carbon and their use in documenting vegetation change in a subtropical savanna ecosystem. Geoderma 82:5-41. Burke IC, Yonker CM, Parton WJ, Cole CV, Flach K, Schimel DS. 1989. Texture, climate, and cultivation effects on soil organic matter content in US grassland soils. Soil Sci Soc Am J 53:800-5. Burke IC , Kittel TGF, Lauenroth WK, Snook DP, Yonker CM, Parton WJ. 1991. Regional analysis of the central Great Plains. BioScience 41:685-92. Burke, IC, Lauenroth WK, Milchunas DG. 1997. Biogeochemistry of managed grasslands in central North America. In: Paul EA, Paustian K, Elliott ET, Cole CV, editors. Soil organic matter in temperate agroecosystems. Boca Raton: CRC Press. p 85102. Cambardella CA, Elliott ET. 1993. Carbon and nitrogen distribution in aggregates from cultivated and native grassland soils. Soil Sci Soc Am J 57:1071-76. Cambardella CA, Elliott ET. 1992. Particulate soil organic-matter changes across a grassland cultivation sequence. Soil Sci Soc Am J 56:777-83. Campbell CA, Paul EA, Rennie DA, McCallum KJ. 1967. Applicability of the carbon dating method of analysis to soil humus studies. Soil Sci 104:217-24. Couˆteaux M-M, Bottner P, Berg B. 1995. Litter decomposition, climate and litter quality. TREE 10:63-66. D’Antonio CM, Vitousek PM. 1992. Biological invasions by exotic grasses, the grass/fire cycle, and global change. Annu Rev Ecol Syst 23:63-87. Dahlman RC, Kucera CL. 1967. Carbon-14 cycling in the root and soil components of a prairie ecosystem. Proc 2nd Nat Symp Radioecology, Ann Arbor, MI. 652-60. Dodd MB, Lauenroth WK. 1997. The influence of soil texture on the soil water dynamics and vegetation structure of a shortgrass steppe ecosystem. Plant Ecol 133:13-28.
Elzein A, Balesdent J. 1995. Mechanistic simulation of vertical distribution of carbon concentrations and residence times in soils. Soil Sci Soc Am J 59:1328-35. Franklin JF, Bledsoe CS, Callahan JT. 1990. Contributions of the long-term ecological research program. BioScience 40:509-23.
Hayes DC, Seastedt TR. 1987. Root dynamics of tallgrass prairie in wet and dry years. Can J Bot 65:787-91. Herman WA, McGill WB, Dormaar JF. 1977. Effects of initial chemical composition on decomposition of roots of three grass species. Can J Soil Sci 57:205-15. Holland EA, Townsend AR, Vitousek PM. 1995. Variability in temperature regulation of CO2 fluxes and N mineralization from five Hawaiian soils: implications for a changing climate. Global Change Biol 1:115-23. Hook PB, Burke IC, Lauenroth WK. 1991. Heterogeneity of soil and plant N and C associated with individual plants and openings in North American shortgrass steppe. Plant Soil 138:247-56. Hunt HW. 1977. A simulation model for decomposition in grasslands. Ecology 58:469-84. Jackson RB, Mooney HA, Schulze E-D. 1997. A global budget for fine root biomass, surface areas, and nutrient content. Proc Natl Acad Sci 94:7362-66. Jenny H. 1941. Factors of soil formation. New York: McGraw-Hill Book Company, Inc. Jenkinson DS, Rayner, JH. 1977. The turnover of soil organic matter in some of the Rothamsted classical experiments. Soil Sci 123:298-305. Jenkinson DS, Adams DE, Wild A. 1991. Model estimates of CO2 emissions from soil in response to global warming. Nature 351:304-06. Jury WA, Gardner WR, Gardner WH. 1991. Soil Physics. New York: John Wiley & Sons, Inc. Kelly R, Burke IC, Lauenroth WK. 1996. Soil organic matter and nutrient availability responses to reduced plant inputs in shortgrass steppe. Ecology 77:2516-27. Kirshbaum MUF. 1995. The temperature dependence of soil organic matter decomposition, and the effect of global warming on soil organic C storage. Soil Biol Biochem 27:753-60. Lauenroth WK, Milchunas DG. 1992. Short-grass steppe. In: Coupland RT, editor Natural grasslands: Introduction and Western Hemisphere. New York: Elsevier. p 183-226 Leetham JW, Milchunas DG. 1985. The composition and distribution of soil microarthropods in the shortgrass steppe in relation to soil water, root biomass, and grazing by cattle. Pedobiologia 28:311-25. Magid J, Gorissen A, Giller KE. 1996. In search of the elusive ‘active‘ fraction of soil organic matter: three size-density fractionation methods for tracing the fate of homogeneously 14-C-labeled plant materials. Soil Biol Biochem 28:89-99. Meentemeyer V. 1978. Macroclimate and lignin control of litter decomposition rates. Ecology 59:465-72. Melillo JM., Aber JD, Linkins AE, Ricca A, Fry B, Nadelhoffer KJ. 1989. Carbon and nitrogen dynamics along the decay continuum: plant litter to soil organic matter. In: Clarholm M,
236
R. Gill and others
Bergstro¨m L, editors. Ecology of arable land. Boston :Kluwer Academic Publishers. p 53-62.
Sala OE, Lauenroth WK, Parton WJ. 1992. Long-term soil water dynamics in the shortgrass steppe. Ecology 73:1175-81.
Melillo JM, Aber JD, Muratore JF. 1982. Nitrogen and lignin control of hardwood leaf litter decomposition dynamics. Ecology 63:621-26.
Santos PF, Elkins NZ, Steinberger Y, Whitford W. 1984. A caparison of surface and buried Larrea tridentata leaf litter decomposition in North American hot deserts. Ecology 65: 278-84.
Milchunas DG, Lauenroth WK. 1992. Carbon dynamics and estimates of primary production by harvest, 14C dilution, and 14C turnover. Ecology 73:593-607. Milchunas DG, Lauenroth WK. 1989. Three-dimensional distribution of plant biomass in relation to grazing and topography in the shortgrass steppe. Oikos 55:82-86. Nakane K. 1978. A mathematical model of the behavior and vertical distribution of organic carbon in forest soils. Jpn J Ecol 28:111-22. Nelson DW, Sommers LE. 1982. Total carbon, organic carbon, and organic matter. In: Page AL, Miller RH, Keeney DR, editors. Methods of soil analysis. 2nd ed. Madison, WI: Soil Science Society of America, Inc. p 539-80. Nicolardot B, Molina JAE, Allard MR. 1994. C and N fluxes between pools of soil organic matter: model calibration with long-term incubation data. Soil Biol Biochem 26:235-43. Nyhan JW. 1976. Influence of soil temperature and water tension on the decomposition rate of carbon-14 labeled herbage. Soil Science 121:288-93. Parton WJ. 1978. Abiotic section of ELM. In: Innis GS, editor. Grassland simulation model. New York: Springer-Verlag. p 31-53. Parton WJ. 1984. Predicting soil temperatures in a shortgrass steppe. Soil Sci 138:93-101. Parton WJ, Greenland D. 1987. Central Plains Experimental Range. In: Greenland D, editor. The climates of the long-term ecological research sites. Boulder, Colorado: University of Colorado Press. p 23-29. Parton WJ, Schimel DS, Cole CV, Ojima DS. 1987. Analysis of factors controlling soil organic matter levels in great plains grasslands. Soil Sci Soc Am J 51:1173-79. Parton WJ, Ojima DS, Schimel DS. 1994. Environmental change in grasslands: assessment using models. Clim Chng 28:111-41. Paul EA, Clark FE. 1996. Soil microbiology and biochemistry. San Diego: Academic Press. Sala OE, Lauenroth WK. 1982. Small rainfall events: an ecological role in semiarid regions. Oecologia 53:301-4. Sala OE, Lauenroth WK, Burke IC. 1996. Carbon budgets of temperate grasslands and the effects of global change. In: ˚ gren GI, editors. Global Breymeyer AI, Hall DO, Melillo JM, A change: Effects on coniferous forests and grasslands. New York: John Wiley & Sons Ltd. p 101-19.
Schimel DS, Stillwell MA, Woodmansee RG. 1985. Biogeochemistry of C, N, and P in a soil catena of the shortgrass steppe. Ecology 66:276-82. Schlesinger WH. 1977. Carbon balance in terrestrial detritus. Annu Rev Ecol Syst 8:51-81. Schlesinger WH, Reynolds JF, Cunningham GL, Huenneke LF, Jarrell WM, Virginia RA, Whitford WG. 1990. Biological feedbacks in global desertification. Science 247:1043-48. Snyder JD, Trofymow JA. 1984. A rapid wet oxidation diffusion procedure for determining organic and inorganic carbon in plant and soil samples. Commun Soil Sci Plant Anal 15:587-97. Stevenson IL. 1956. Some observations on the microbial activity of remoistened air-dried soils. Plant Soil 8:170-82. Townsend AR, Vitousek PM, Trumbore SE. 1995. Soil organic matter dynamics along gradients in temperature and land use on the island of Hawaii. Ecology 76:721-33. Trumbore SE, Davidson EA, de Camargo PB, Nepstad DC, Martinelli LA. 1995. Belowground cycling of carbon in forests and pastures of Eastern Amazonia. Global Biogeochem Cycl 9:515-28. Van Dam D, Veldkamp E, Van Breemen N. 1997. Soil organic carbon dynamics: variability with depth in forested and deforested soils under pasture in Costa Rica. Biogeochemistry 39:343-75. Van Veen JA, Paul EA. 1981. Organic carbon dynamics in grassland soils. I. Background information and computer simulation. Can J Soil Sci 61:185-201. Van Veen JA, Ladd JN, Frissel MJ. 1984. Modeling C and N turnover through the microbial biomass in soil. Plant Soil 76:257-74. Weaver JE, Houghen VH, Weldon MD. 1935. Relation of root distribution to organic matter in prairie soil. Bot Gaz 96:389420. Wedin DA, Tieszen LL, Dewey B, Pastor J. 1995. Carbon isotope dynamics during grass decomposition and soil organic matter formation. Ecology 76:1383-92. Yonker CM, Schimel DS, Paroussis E, Heil RD. 1988. Patterns of organic carbon accumulation in a semiarid shortgrass steppe, Colorado. Soil Sci Soc Am J 52:478-83.