ECOSYSTEMS
Ecosystems (1999) 2: 338–350
r 1999 Springer-Verlag
Filtering Impacts of an Introduced Bivalve (Dreissena polymorpha) in a Shallow Lake: Application of a Hydrodynamic Model Hugh J. MacIsaac,1* Ora E. Johannsson,2 Jian Ye,1,3 W. Gary Sprules,4 J. H. Leach,5 J. A. McCorquodale,1,6 and Igor A. Grigorovich1 1Great Lakes Institute for Environmental Research, University of Windsor, Windsor, Ontario N9B 3P4; 2Great Lakes Laboratory for Fisheries
and Aquatic Sciences, Department of Fisheries and Oceans, Burlington, Ontario L7R 4A6; 3Department of Civil and Environmental Engineering, University of Windsor, Windsor, Ontario N9B 3P4; 4Department of Zoology, University of Toronto at Mississauga, Mississauga, Ontario L5L 1C6; 5Ontario Ministry of Natural Resources, Lake Erie Fisheries Station, R.R. #2, Wheatley, Ontario N0P 2P0, Canada; 6Department of Civil and Environmental Engineering, University of New Orleans, New Orleans, Louisiana, USA 70148
ABSTRACT Nonindigenous species may exert strong effects on ecosystem structure and function. The zebra mussel (Dreissena polymorpha) has been attributed with profound changes in invaded ecosystems across eastern North America. We explored vertical profiles of water flow velocity and chlorophyll a concentration in western Lake Erie, over rocky substrates encrusted with Dreissena, to assess the extent to which mussels influence coupling between benthic and pelagic regions of the lake. Flow velocity was always low at surveyed sites (less than or equal to 2.9 cm s-1) and declined in direct proximity to the lakebed. Mean chlorophyll a concentration was also low (less than 5µg L-1) at all sites and depths. Chlorophyll a concentration was positively correlated with distance above lakebed and was lowest (0.3µg L-1) directly adjacent to the lakebed. Spatial patterns of zooplankton grazers could not explain observed vertical gradients in chlorophyll concentration. Hydrodynamic modeling revealed that filtering effects of Dreissena in a nonstratified, shallow basin depend mainly on upstream chlorophyll con-
centration, intensity of turbulent diffusion, feeding efficiency of the mussel colony, and the distance downstream from the leading edge of the mussel colony. In contrast to widespread perceptions that molluscs reduce phytoplankton concentration only adjacent to the lakebed, modeling scenarios indicated that depletion occurs throughout the water column. Depletion was, however, inversely proportional to distance above the lakebed. Simulation results are consistent with field-based observations made in shallow water habitats populated by large Dreissena populations in the Great Lakes and elsewhere. Results from this study indicate that zebra mussels strongly enhance coupling between pelagic and benthic regions in shallow lakes. Enhanced coupling between these regions explains, in part, high population densities of Dreissena and of many benthic invertebrates in ecosystems invaded by zebra mussels.
INTRODUCTION
ing destruction of wetlands, intensive commercial fishing, cultural eutrophication, and introduction of nonindigenous species (for example, Makarewicz and Bertram 1991; Jude and Leach 1993; Mills and others 1993). Despite this pattern of general degradation, water quality has improved in the western
Key words: zebra mussel; benthic–pelagic coupling; Great Lakes; hydrodynamics; exotic species.
The Lake Erie ecosystem has been subject to profound perturbations during the past century, includReceived 14 July 1998; accepted 25 March 1999. *Corresponding author. e-mail:
[email protected]
338
Mussel Filtering in a Shallow Lake basin in recent years coincident with reductions in phosphorus loading to the lake and with establishment of introduced zebra mussels Dreissena polymorpha (Makarewicz and Bertram 1991; Nicholls and others 1999). Zebra mussels have had profound effects in the basin, including dramatic changes in diversity and abundance of benthic invertebrates and nutrient and contaminant cycling (for example, Wisenden and Bailey 1995; Arnott and Vanni 1996; MacIsaac 1996; Mazak and others 1997; Bially 1998; Dobson and Mackie 1998; Stewart and others 1998a, 1998b). Zebra mussels also have been attributed with increases in water clarity and reductions in pelagic phytoplankton standing biomass in the basin (Holland 1993; Leach 1993; Madenjian 1995; Klerks and others 1996; Stoermer and others 1996; Nicholls and others 1999). These findings are consistent with the emerging view that bivalves play important roles in shallow freshwater ecosystems, and that changes in bivalve populations may alter ecosystem structure and function (Caraco and others 1997; Strayer and others 1999). MacIsaac and others (1992) estimated that the Dreissena population inhabiting Hen Island Reef in western Lake Erie theoretically filtered the overlying water column between 3.5 and 18.8 times per day but stressed that the realized effect would likely be lower. Estimating filtering effects of mussels based strictly on population density, filtering rate, and water column volume is problematic because it assumes that the mussels have contact with the entire water column and that they do not refilter water (Doering and Oviatt 1986). These conditions are unlikely to be satisfied in most lakes considering that the mussels reside on the lakebed and depend on sinking phytoplankton and turbulent diffusion to supply food. These problems limit the use of field-based studies to our understanding of mussel filtering impacts. Numerical and physical models are complementary tools with which to assess the effects of mussel filtering on ecosystem functioning (Officer and others 1982; Fre´chette and others 1989; O’Riordan and others 1993; Gerritsen and others 1994). These models provide opportunities to assess the relative importance of vertical diffusive transport, mussel consumption rate, and other factors on the effects exerted by mussels. These models have been applied to estuaries and rivers but, heretofore, not to lakes, where mixing and mussel filtering effects are perceived to be much weaker. One limitation of marine models is that they may overestimate mussel consumption because they assume that all phytoplank-
339
ton cells that reach the seabed are consumed, even when mussel density is low. In this study, we explore vertical patterns of chlorophyll concentration, zooplankton density, current velocity, and water temperature above reefs fouled by Dreissena in western Lake Erie. We also use a two-dimensional hydrodynamic model to simulate distribution of chlorophyll concentration for water flows across a reef inhabited by Dreissena in western Lake Erie (that is, Hen Island reef). This simple numerical model is used to describe horizontal and vertical variation in chlorophyll concentration in relation to combined effects from turbulent mixing, convection, mussel consumption, and chlorophyll production, settling, and inflow concentration. Our model permits accumulation of settling chlorophyll as the boundary condition. This distinction is important because it permits resuspension of settled chlorophyll, a condition realized when water flow is turbulent. We also conduct sensitivity analyses of model components to provide an understanding of the factors most important to mussel filtering impact in western Lake Erie.
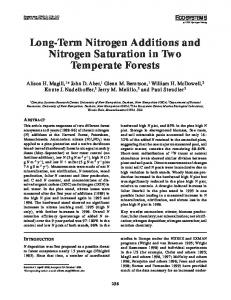
METHODS Field Surveys Vertical patterns of water temperature, current speed and direction, chlorophyll a concentration, and zooplankton composition and abundance were surveyed at four sites adjacent to Hen Island, western Lake Erie, on 5–6 September 1991 (Figure 1). Patterns were also examined at two locations southwest of Point Pelee, Ontario, on 25 June 1992, at two locations east of Hen Island on 26 June 1992, at two sites south of Pelee Island on 13 August 1992, and at one location east of East Sister Island on 14 August 1992 (Figure 1). The lakebed at each site consisted of rocky substrate, except at sites south of Pelee Island where mixtures of sand, mud, and small stones predominated. Dreissena colonized substrates at all sites with moderate to dense colonies (112,000 to 342,000 ind./m2; MacIsaac and others 1992; Leach 1993). All surveys were conducted during relatively calm periods, except those at sites 9 and 11 (see Table 1). Divers using SCUBA after the research vessel was secured in position (see Figure 2; MacIsaac and others 1992) placed a 3-m aluminum tripod on the lakebed at each site. A Neil Brown current and temperature meter was suspended from the center of a tripod on an adjustable shaft. A 10-min interval elapsed after the tripod was placed on the lakebed before sampling was initiated. Water flow measure-
340
H. J. MacIsaac and others
Figure 1. Location of 11 sampling sites in western Lake Erie. Water column profiles were conducted at four (open circles) locations adjacent to Hen Island during September 1991. Additional sites adjacent to Hen Island (open squares) and south of the Canadian mainland (open squares) were sampled during June 1992. Sampling was also conducted at sites adjacent to Pelee and East Sister Islands (closed squares) in August 1992.
ments were made in 20-cm intervals commencing 25 cm above the lakebed, the closest distance the meter could be positioned above the bottom. At its highest position, the meter was 50 cm from the tripod legs, a distance sufficient to avoid disturbance of current flow caused by the tripod. A submersible pump capable of delivering 5 L/min was attached to the tripod. A water intake hose with a right-angle terminus connector was clipped to a tripod leg, allowing collection of water from each of the depths profiled for water temperature and current flow. Current meter readings and water for chlorophyll a and zooplankton analysis were sampled simultaneously for 10-min periods, the latter collected in a 65-L pail. An additional water sample for chlorophyll and zooplankton analyses was pumped from immediately (2.5 cm) above the lakebed; other samples were collected from surface waters with a modified 30-L Schindler-Patalas trap. Three 1.5– 2.0-L subsamples were collected from the pail after its contents were mixed. Subsamples were initially processed through 209-µm mesh to remove large zooplankton, followed by WhatmanGF/C filters (Maidstone, England) for chlorophyll a analysis. Filters were placed on dry ice, transported to the laboratory, and later ground up in a 90% buffered acetone solution. Chlorophyll a was quantified following methods of Strickland and Parsons (1972). Chlorophyll a values were averaged across subsamples and corrected for phaeophytin except those
collected from the two sites (5 and 6) adjacent to the Canadian mainland during 1992. A zooplankton sample was collected using water remaining in the pail after subsamples had been withdrawn for chlorophyll a concentration analysis. Volume of zooplankton samples was calculated by measuring the height (H, in cm) of the remaining water column in the pail, and converting this value to volume (V, in L) by using nonlinear regression (V ⫽ 0.14 x H1.59, r2 ⫽ 0.99, n ⫽ 120). Water in the pail was filtered through 41-µm mesh to retain zooplankton. Zooplankton were preserved in a 4% sugar–formalin solution. Zooplankton samples from surface waters were collected with a 30-L SchindlerPatalas trap, outfitted with a 41-µm sock, and preserved. Three replicate subsamples were enumerated for each plankton sample. Variation in current velocity among sites was assessed using analysis of covariance, with relative depth (distance above bottom divided by site depth) entered as a covariate. Because sampling sites differed between years, analyses were conducted separately for 1991 and 1992. Winds were weak and strong, respectively, during sampling periods in 1991 and 1992 (Table 1). One site (Figure 2C) that experienced a water flow reversal over the course of sampling (approximately 1.5 h per site) was deleted from statistical analysis. Variation in corrected chlorophyll a concentration was analyzed using analysis of covariance (ANCOVA), with depth as a continuous variable. Sites were nested within year of collection (1991 vs 1992); both were categorical variables. Spatial autocorrelation across depths would tend to inflate site differences and minimize depth differences.
Hydrodynamic Modeling We developed a model to estimate the effect of Dreissena on chlorophyll a concentration in western Lake Erie, the shallowest and most productive of the lake’s basins. The model used information on potential consumption of chlorophyll a by the mussel population (see below), in addition to that regarding production, settling velocity and upstream inflow of chlorophyll a, and mixing characteristics of the water column. The model assesses changes in chlorophyll a concentration through the water column, over the mussel bed, in relation to horizontal displacement associated with water flow (that is, inputs from upstream areas and losses to downstream ones), vertical flux owing to turbulence and sedimentation, mussel consumption, and in situ production. This two-dimensional model thus permits estimation of horizontal and vertical variation
Mussel Filtering in a Shallow Lake
341
Table 1. Physical Conditions at Sites Surveyed during 1991 and 1992 Sept. 1991
June 1992
Aug. 1992
Site
1
2
3
4
5
6
7
8
9
10
11
Surface temperature (°C) Bottom temperature (°C) Secchi disk transparency (m) Wind speed (kph) Wave height (cm)
na 23.0 na ⬍5 ⬍15
na 23.2 na ⬍5 ⬍15
na 23.0 na ⬍5 ⬍15
na 23.0 2.7 na na
19.8 18.6 1.25 4–8 15–45
18.8 18.1 1.5 3 0–30
19.9 18.8 2.5 4 15–30
20.9 18.9 2.8 4 20
23.2 22.2 na 8 30–60
na 23 na 9 ⬍30
24.0 22.9 na 5–7 30–75
Sites 1–4 and 7, Hen Island Reef; 5 and 6, Pigeon Bay (near Canadian mainland); 8 and 9: Sunken Chicken Reef and East Sister Island, respectively (near Hen Island); 10 and 11: south of Pelee Island (see Figure 1). na, not available.
in chlorophyll concentration as water travels across a reef encrusted with mussels. The model assumed that the horizontal water velocity profile was logarithmic (that is, that flow was uniform), that there was no vertical movement of water, and that horizontal diffusion was much smaller than vertical diffusion and could therefore be neglected. The governing equation for transport and mass balance of chlorophyll in the water column can be described by: ⭸C ⭸t
⫹
⭸uC ⭸x
⫽
⫹ ⭸z 1 ⭸z 2 ⭸ K ⭸C c
⭸wsC ⭸z
⫹ Sc ,
(1)
where C is chlorophyll a concentration, u is the water velocity in horizontal (x) direction, z is vertical coordinate from 0 to H (where H is water depth), K is eddy viscosity due to turbulent mixing, K/c is turbulent diffusivity of C, c is turbulent Schmidt number for C (Fisher and others 1979), ws (greater than 0) is sinking rate or settling velocity of chlorophyll a, and Sc is the source term of C. Sc can be expressed as: Sc ⫽ P ⫺
⭸G ⭸z
wsC ⫹
c ⭸z
wsC ⫹
K ⭸C c ⭸z
,
⫽ ⫺G ⫽ ⫺␣C,
(2)
K ⭸C c ⭸z
(3)
ⱖ ⫺G.
(5)
Thus at the lakebed, the flux from sinking and mixing may result in net accumulation of chlorophyll a depending on the consumption rate of the mussel population. The consumption rate (G) of the mussel population was estimated based on individual contributions by different mussel size classes (Gi). These contributions were determined from the size structure of the population and Kryger and Riisga˚rd’s (1988) relationship describing size-specific filtering rates, as follows: k
⫽ 0,
(4)
where ␣ is mussel grazing rate, which can be determined from Eq. (4) (Koseff and others 1993). Eq. (4) equates consumption of chlorophyll by benthic mussels with its flux from sinking and mixing, regardless of mussel density. This condition [Eq. (4)] is likely to be satisfied only when benthic mussel density is substantial. Therefore, we used a modification of this approach to estimate filtering impact of benthic mussels. SCUBA observations in western Lake Erie indicate that water clarity is much more limited over benthic substrates lacking mussels than over those supporting dense populations; high water clarity above mussel beds corresponds with exceptionally low (less than 1µg/L) chlorophyll a concentration (MacIsaac and others 1992). This phenomenon can be described as (z ⫽ 0): wsC ⫹
where P is phytoplankton production rate measured as chlorophyll a, and G is the consumption rate of the Dreissena population. G is set to zero for all depths except the bottom layer because filtering is assumed only by benthic Dreissena colonies. This assumption is consistent with estimations based on potential filtering effects of benthic adults and planktonic, veliger larvae (MacIsaac and others 1992). The boundary condition assumed that there was no flux of chlorophyll mass at the free water surface (that is, z ⫽ H): K ⭸C
and is conventionally treated as:
G⫽
兺 i⫽1
k
Gi ⫽
兺 q n C, i i
i⫽1
(6)
342
H. J. MacIsaac and others effect.’’ Feeding efficiency varies inversely (0 ⱕ ⱕ 1) with mussel density. Eq. (5) can be used to check whether the supply of chlorophyll a exceeds the consumption demand of mussels. If the rate of food consumption (G) estimated by Eq. (6) is greater than its rate of supply, then Eq. (4) can be used to determine G.
Model Development and Parameterization Velocity Distribution u. For rough, turbulent, uniform flow over a mussel bed, the horizontal velocity profile in cases of limited water depth can be expressed as (Fisher and others 1979): u U*
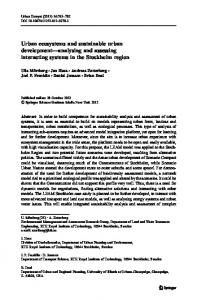
Figure 2. Chlorophyll a concentration (open circles) and current flow rate (closed squares) in relation to lake depth at sites in western Lake Erie during surveys conducted in 1991 (A–D) and 1992 (E–K). Profiles are presented for sites adjacent to Hen Island (A–D, G, and H), the Canadian mainland (E and F), south of Pelee Island (I and J), and East Sister Island (K). All chlorophyll a values are corrected for phaeophytin except for profiles from sites E and F. Mean corrected chlorophyll a (⫾SE) values for nine sites are shown in the lower right panel (Overall), as are mean (⫾SE) flow rates for all 11 sites.
where k is the number of mussel size classes, qi and ni are the pumping rate (L/h) and density (ind./m2) of mussels in the i-th size class, respectively, and is the feeding efficiency of the mussel population. accounts for refiltration of water by mussels in dense colonies. For example, mussels in the interior of a dense clump have less access to unfiltered water than mussels in the top layer, resulting in a ‘‘shadow
⫽
1
ln
z ⌬
,
(7)
where U* is the bottom shear velocity, is the von Karman constant (⫽ 0.4), and ⌬ is bottom roughness. Turbulence near the mussel bed is generated primarily by shear stresses due to currents but in shallow areas can also be affected by wind–wave induced currents. Two aspects of shear stresses caused by the mussel bed that must be considered are roughness of the mussels and the form shear stress of the clumped mussel population. Mussels ranged in size from 1 to 29 mm, though most individuals were small (mean ⫽ 5.5 mm; Leach 1993). Considering that mussel colonies occur in uneven ‘‘hummocks’’ (Fre´chette and others 1989), the bottom roughness ⌬ and the shear velocity U* are 7 mm and 2.21 mm/s, respectively. The former value was obtained from the average mussel distribution on Hen Island reef, while the latter was calculated by solving Eq. (7). Turbulent Eddy Viscosity K. For an unstratified water column during calm weather, the vertical distribution of K can be assumed as a parabolic distribution (Fisher and others 1979):
1
K ⫽ U ⴱ z 1 ⫺
z
2.
H
(8)
Schmidt Number c. The Schmidt number is defined as the ratio of the turbulent eddy viscosity and the mass turbulent diffusivity. For jet-type and boundary-type flows, the Schmidt number is approximately 0.5 and approximately 0.9, respectively. Wind shear, large waves, recirculating currents, and other three-dimensional effects would significantly reduce the Schmidt number and increase mixing (that is, mass diffusivity). It is not possible to predict Schmidt number from theoretical constructs. Rather, we set the Schmidt number to 0.8 for simulations. This value is typical of western
Mussel Filtering in a Shallow Lake Lake Erie during calm weather (J. A. McCorquodale, personal observations). Settling Velocity ws. Settling velocity (ws) values for phytoplankton (⫽ chlorophyll a) in western Lake Erie were obtained from Reynolds (1986) for the primary genera (Fragilaria, Tabellaria) found in the basin (Dahl and others 1995). The modeled settling velocity value (2.5 m/d) represents the maximum value reported for these taxa in Reynolds (1986). Chlorophyll a Production Rate. The model incorporated in situ production of chlorophyll a based on the phytoplankton production to biomass (P:B) ratio for the western basin measured during summer 1993 (Dahl and others 1995). We have assumed that this ratio (P:B ⫽ 0.515 per day) does not vary by depth and that it can be used to estimate production for 1991 and 1992 even though measured chlorophyll a concentration was lower during these years. Modeled chlorophyll a production value was 0.77µg/L/d. Upstream Chlorophyll a Concentration. The model used a vertical uniform distribution of chlorophyll a concentration as the upstream boundary condition (O. E. Johannsson, unpublished data). Because the model is parabolic (that is, no backflows), description of downstream boundary conditions is not necessary. We used an upstream chlorophyll a concentration of 1.5µg/L in simulations. This value is consistent with measurements made near mussel beds (MacIsaac and others 1992). Mussel Consumption Rate G. The rate at which zebra mussels consumed chlorophyll a is related to ni, qi, and as shown in Eq. (6). Our model used information on the density size structure of mussels (ni) for Hen Island reef for October 1990 (Leach 1993). Pumping rate (qi) is assumed constant. While it is difficult to determine accurately, we developed an approach to estimate its minimum and practical values by using information on the density and size structure of the mussel population on Hen Island reef. Even though this dense population was multilayered, we estimated the surface area occupied by individuals if arranged side by side. By using a spherical approximation of mussels, the surface area (SA) covered by the entire population if arranged in a single layer of unit area (m2) would be estimated by: k
SA ⫽
兺n
i
i⫽1
d2i 4
,
(9)
where di is the diameter of individuals of mussel size class i. By assuming that only mussels in the top layer consume chlorophyll, and considering that the
343
hummock effect of mussel beds increases effective surface area by 25%, the minimum value of can be expressed as: min ⫽
1.25 SA
, [min ⱕ 1].
(10)
If SA is less than 1.25 m2, then min is unity, and there are only enough mussels to form one layer on the lake bottom. In this case, consumption rate of the mussel population would equal summed contributions by each individual. When mussel densities are higher and individuals occur in N multiple layers, the practical value of exceeds min and is determined by: ⫽ Nmin where N ⫽ 1 ⬃ 3, [ ⱕ 1, N ⱕ SA/1.25].
(11)
The model assumes that N increases with mussel density to a maximal value of 3 (three layers). In this study, SA, min, , and N were set to 7.56 m2 [Eq. (9)], 0.167, 0.5, and 3, respectively. Although N increases with increasing mussel density, min should decline at a faster rate, resulting in an overall reduction in with increasing mussel density. Mussel colony feeding efficiencies examined were 0% (mussels absent), 10%, 50% (base model), and 100%. In addition to the simulations described above that used field-based empirical parameterization, we conducted a sensitivity analysis of the model to determine which components of the model most affect benthic–pelagic coupling. Sensitivity analyses were conducted by sequentially increasing or decreasing each model parameter, except Schmidt number, by 50% of its base model value. Schmidt number sensitivity analysis consisted of decreasing the baseline model value by 50% (to 0.4; enhanced mixing) or increasing it to its maximum value (1.0; minimal mixing), a 25% increase over the base model. We then compared the ratio of chlorophyll concentration in the modified model with that of the base model for surface, mid-, and bottom waters at a point 450 m downstream of the leading edge of the reef. We conducted two additional sets of simulations in which we relaxed the assumptions that inflowing chlorophyll concentration or chlorophyll production rate was vertically uniform. These simulations allowed 75% of the inflowing concentration or production rate of chlorophyll to occur in either the surface waters or in benthic waters (see Figure 7). These simulations recognize that phytoplankton
344
H. J. MacIsaac and others
Figure 3. Comparison of longitudinal flow velocity (u) profile [Eq. (7)] and lake data (stars and asterisks). Depth is relative (surface ⫽ 1.0). The two sites profiled provide the most parsimonious fit to the log-law velocity distribution (B and D from Figure 2).
concentration and production rates are vertically heterogeneous in many lakes.
Model Setup Lake currents are nearly perpendicular to the reef near Hen Island. We used flow profiles for two sites from 1991 (Figures 2B and 2D) to verify the velocity distribution of Eq. (7) (Figure 3). We used these data to model the effect of mussel consumption on chlorophyll concentration in both vertical and horizontal directions because they conformed to log-law theoretical expectations. Because the weather was calm when these velocity profiles were conducted, they can be treated as two-dimensional without significant error. The log-law expectation predicts that current velocity increases logarithmically with distance above the lakebed (for example, see Figure 9.9 in Denny 1988 and Figure 8.1 in Vogel 1983). Eq. (1), with appropriate boundary conditions, was solved by the finite volume method and timemarching approach (Ye and McCorquodale 1997). The procedure was marched forward until a steady state solution was obtained. The computational domain selected ranges from 200 m upstream of the leading edge of the mussel bed to 450 m downstream of it. This simulation approximates water flow across Hen Island reef. Water depth in the simulations was set at 4.5 m, which is similar to that proximal to Hen Island reef. A grid of 65 x 34 was applied, with a uniform distribution of ⌬x ⫽ 10 m in the horizontal direction, and a nonuniform distribution in the vertical (z) direction (that is, ⌬z varies from 0.006 to 0.05 of water column height).
RESULTS Field Studies Water temperature varied less than or equal to 2°C between lake surface and bottom at each of the sites
surveyed during 1992, indicating that the water column was not physically stratified (Table 1). Water clarity was low at all sites (Table 1), though SCUBA diver observations revealed high water clarity within 1.5 m of lake bottom at most sites. Mean water velocity was low at all depths surveyed, averaging between 2.2 and 3.7 cm/s (Figure 2). Flow rates between 25 and 165 cm above lake bottom did not vary significantly by depth (F ⫽ 0.34, df ⫽ 1, 52, P ⫽ 0.342) or between sites (F ⫽ 1.5, df ⫽ 10, 52, P ⫽ 0.157). Chlorophyll a concentration was low (less than 5µg/L) at all sites, but was strongly related to sample depth (F ⫽ 26, df ⫽ 1, 80, P ⬍ 0.0001; Figure 2). Chlorophyll values were similar at depths above 1.85 m from the lakebed but were positively correlated with distance above the lakebed below this depth (Figure 2). Chlorophyll concentration was very low (0.33µg/L) immediately adjacent to the lakebed. Chlorophyll concentration did not vary between years (F ⬍ 1, df ⫽ 1, 80, P ⫽ 0.8125), though significant differences were observed among sites (F ⫽ 13, df ⫽ 7, 80, P ⬍ 0.0001). Spatial variation in chlorophyll concentration also was evident between contiguous sites sampled on the same day (Figures 2C and 2D) or on adjacent days (Figures 2A and 2C). Composition of the zooplankton community varied primarily by month of collection (Figure 4). For example, densities of rotifers, cladocerans, and Dreissena veligers were higher during August than June, whereas the opposite pattern was observed for copepods. Temporal density differences were greatest for veligers and rotifers. Both the absolute and relative density of rotifers was positively related to distance from the lakebed, particularly during June 1992 (Figure 4). Zooplankton density generally exhibited a complementary distribution pattern to that of chlorophyll biomass (Figures 2 and 4).
Mussel Filtering Simulation In the absence of mussel filtering, chlorophyll production resulted in slight biomass accumulation as water flowed across the reef (Figures 5A and 6). Accumulation was greatest directly adjacent to the lakebed owing to settling by phytoplankton. By contrast, chlorophyll concentration was depleted adjacent to the lakebed within 90 m of the leading edge of the reef in all simulations that incorporated mussel consumption (Figures 5B–5D and 6). Chlorophyll depletion also occurred in surface waters, though the magnitude of reduction was dependent on mussel colony feeding efficiency and never approached that of near-bottom waters (Figures 5 and 6). Chlorophyll depletion also increased progres-
Mussel Filtering in a Shallow Lake
345
Figure 4. Mean seasonal abundances of Dreissena veliger larvae (open bars), total rotifers (solid bars), cladocerans (cross-hatched bars), and copepods (stippled bars) at sites surveyed during 1992 in relation to depth. Median depths are used for samples collected from depths greater than 2 m off lake bottom. *, not sampled.
sively with distance from the leading edge of the reef in all simulations, the extent of which was directly dependent on mussel colony feeding efficiency. Feeding efficiency simulations differed primarily with respect to the rate at which depletion occurred. Depletion occurred most rapidly in benthic waters and was directly proportional to the colony feeding efficiency. Mussel colony feeding efficiency () affected absolute concentrations of chlorophyll but not overall patterns of depletion. For example, under moderate, high and low colony feeding efficiency, nearbottom chlorophyll concentrations were reduced 86, 92, and 52% relative to the simulation without mussel grazing (Figures 5B, 5C, and 5D, respectively). Corresponding reductions in surface chlorophyll a concentrations were 24, 27, and 13% (Figures 5B–5D and 6). Differences in colony feeding efficiencies were manifest mainly by the degree and rate at which depletion of chlorophyll occurred throughout the water column (Figures 5B–5D). Effects of mussel grazing were also sensitive to chlorophyll concentration at the inflow, mixing characteristics of the water column, and, to a lesser extent, to phytoplankton settling rate and chlorophyll production rate (Table 2). Chlorophyll concentration upstream of the mussel-encrusted reef also affected the extent of chlorophyll a depletion. For example, a 50% reduction in upstream chlorophyll concentration resulted in a commensurate decline
Figure 5. Predicted chlorophyll concentration in relation to relative depth and distance from the leading edge of the reef (0 m; arrow) under different mussel colony feeding efficiency scenarios (B–D). In each case, assessments are presented every 90 m (heavy lines) downstream of the leading edge of the reef; one assessment is provided upstream of the reef. Chlorophyll a concentration is scaled relative to the vertical line upstream of the site. Sensitivity analyses of mussel colony feeding efficiency [ varied from 0 (A; mussels absent), to 50% (B), 100% (C), and 10% (D; below lower limit)]. Base model (B) parameterization is described in Table 2.
346
H. J. MacIsaac and others Figure 6. Simulated surface chlorophyll a concentration in relation to distance from the leading edge of the reef and mussel colony feeding efficiency. Values are relative to the inflow concentration at the leading edge of the reef and incorporate changes due to production, settling, and grazing. The base model used a 50% efficiency value (solid line).
Table 2. Sensitivity Analysis of Chlorophyll a Concentration Corresponding with 50% Increase or Decrease of Each Model Parameter
Region of Water Column
Base Model Chlorophyll Concentration (µg/L)
Chlorophyll Concentration
Chlorophyll Production
Schmidt Number
⫹50%
⫺50%
⫹50%
⫺50%
⫹25%
⫺50%
Surface Middle Bottom
1.13 1.10 0.27
146 146 145
54 54 55
104 105 105
96 96 95
104 106 91
82 80 125
Colony Feeding Efficiency ⫹50% 98 97 69
105 108 178
Settling Velocity ⫹50%
⫺50%
94 98 103
106 102 97
All results are relativized (%) to the base model. Schmidt number was increased by only 25% (to 1.0), its maximum possible value. The base model used the following parameterization: chlorophyll a settling rate ⫽ 2.5 m/d; inflow chlorophyll a concentration ⫽ 1.5 µg/L; chlorophyll a production rate ⫽ 0.77 µg/L/d; and the Schmidt number ⫽ 0.8.
at all depths downstream, except immediately at the lake bed where suppression was more acute. The Schmidt number (c) determines water column mixing characteristics. Under intense mixing (c ⫽ 0.4), the vertical pattern of chlorophyll a concentration was more uniform than when mixing was less thorough (c ⫽ 0.8; Table 2). For example, the absolute difference between surface and bottom concentrations of chlorophyll a was 0.59 and 0.86µg/L at c ⫽ 0.4 and c ⫽ 0.8, respectively. Thus, mixing characteristics of the water column influenced food supply to mussels and vertical gradients in chlorophyll concentration. A reduction in settling rate resulted in a more homogeneous distribution of chlorophyll a throughout the water column. For example, a reduction in settling velocity from 2.5 to 0.5 m/d increased surface water concentration by 16% but reduced near-bottom concentration by 4.7%. Enhanced settling had the opposite effect and further accentuated differences between surface and benthic waters (Table 2). Production rate had only a minor effect on vertical patterns of chlorophyll a concentration. Chlorophyll concentration was slightly higher (4–5%)
throughout the water column when production rate was elevated from 0.77 to 1.15µg/L/d; Table 2); the increase in production was offset by enhanced grazing by mussels. A 50% decline in in situ production also produced only a small reduction (4–5%) in chlorophyll concentration downstream. Sensitivity analysis of model parameters indicated that surface concentration of chlorophyll 450 m downstream from the mussel bed was affected mainly by its upstream concentration and by water mixing characteristics (Table 2). By contrast, nearbottom chlorophyll concentration was affected most by colony filtering efficiency, by upstream concentration, and by water mixing characteristics (Table 2). Vertical heterogeneity in inflow chlorophyll concentration and, to a lesser extent, chlorophyll production, influence downstream chlorophyll concentration (Figure 7). For example, location of 75% of inflowing chlorophyll in surface water resulted in 7.8, 7.9, and 7.9% increases in downstream surface, midcolumn, and benthic concentrations, respectively, owing to diminished access of biomass to benthic mussels. By contrast, if 75% of inflowing chlorophyll was located in benthic waters, enhanced phytoplankton consumption resulted in con-
Mussel Filtering in a Shallow Lake
Figure 7. Sensitivity analyses of vertical distribution of inflowing chlorophyll and of in situ chlorophyll production. The base model (A) assumed both inflowing chlorophyll concentration and production (⫽ 0.77µg/L/d; not shown) did not vary by depth. Simulations were conducted in which 75% of inflowing concentration or of chlorophyll production occurred in surface (depth greater than or equal to 0.5; B) or benthic (depth less than or equal to 0.5; C) waters. Values presented are percentage of change in chlorophyll concentrations at the surface, midcolumn, and lake bottom for models with heterogeneous chlorophyll concentration or production, relative to the base model, 450 m downstream.
centration decreases of 7.8, 7.9, and 7.9%, respectively. Location of 75% of chlorophyll production in surface or benthic waters resulted in smaller responses, always less than 2% of base model values. In these cases, however, resultant concentrations always increased in the region of the water column where most production occurred, whereas the other regions experienced decreases (Figure 7).
DISCUSSION Biological invasions provide researchers with unique opportunities with which to address questions regarding ecosystem structure and function. Biological invaders affect a myriad of ecosystem properties including species diversity, succession, and nutrient and contaminant cycling. Zebra mussels provide one of the most compelling examples of an introduced species capable of affecting ecosystem properties (reviewed in MacIsaac 1996). Water quality parameters including chlorophyll concentration and secchi disk transparency have changed in many ecosystems invaded by Dreissena. These changes have been most extensive in shallow, nonstratified lakes and in rivers, where benthic processes are
347
most tightly coupled to those in open water. Our surveys of shallow habitats (less than 7.3 m) in western Lake Erie indicated that chlorophyll concentration is strongly depleted above mussel beds (Figure 2). These observations are consistent with other studies on shallow basins in and around the Great Lakes (Holland 1993; Fahnenstiel and others 1995; Fanslow and others 1995; Madenjian 1995; Klerks and others 1996; Mitchell and others 1996; Nicholls and others 1999). Moreover, it is highly unlikely that vertical patterns in chlorophyll concentration resulted from zooplankton grazing, as the spatial distribution of zooplankton was opposite to that expected if they were responsible for depleting chlorophyll in the water column (Figures 2 and 4). Our modeling exercise corroborated field data and, more importantly, illustrated that chlorophyll depletion patterns are transmitted throughout the water column. This application of a hydrodynamic model revealed that zebra mussels might regulate chlorophyll concentration in well-mixed ecosystems, including pelagic waters in nonstratified lakes. This view is consistent with Strayer and others’s (1999) review of filtering effects of introduced zebra mussels in the Hudson River, of introduced Asian clams in Suisan Bay, California, and of the effects oyster populations had in Chesapeake Bay before their collapse. Strayer and others emphasized that ecologists have largely overlooked the functional importance of bivalves to aquatic ecosystems, as well as the role humans have played in altering ecosystem structure and function via destruction or introduction of bivalve populations. Enhanced benthic–pelagic coupling precipitated by establishment of Dreissena may have decoupled relationships that previously existed between phytoplankton and nutrients in Lake Erie (Mellina and others 1995). For example, Nicholls and others (1999) reported dramatic declines in the ratio of chlorophyll to available phosphorus in and downstream of Great Lakes’ basins that support large Dreissena populations. Likewise, Ogilvie and Mitchell (1995) reported that filtration by the mussel Hyridella menziesi reduced chlorophyll concentration to 10% of the value predicted by phosphorus concentration in Lake Tuakitoto, New Zealand. These findings have two important implications for nutrient management in shallow lakes. If Dreissena or other mussels regulate phytoplankton biomass, then concomitant measures to reduce biomass via reductions in nutrient loading would have little if any effect (for example, Nicholls and others 1999). However, the converse also applies: if nutrient levels were increased, then little, if any increase in phytoplankton biomass would be anticipated. These
348
H. J. MacIsaac and others
predictions are consistent with Scheffer’s (1998) contention that alternate equilibria may exist in shallow lakes over a broad range of nutrient concentrations. Application of this model to Lake Erie suggests that modest increases or decreases in concentrations of limiting nutrients would result in minimal changes in phytoplankton biomass because Dreissena presently governs biomass. Results of our modeling simulations of filtering effects of mussels in a shallow lake are consistent with field-based observations from Lake Erie (Figures 2 and 5) and from well-mixed, marine systems (for example, Officer and others 1982; Fre´chette and others 1989; Asmus and Asmus 1991; Alpine and Cloern 1992; Koseff and others 1993; Gerritsen and others 1994; Prins and others 1995, 1996). However, our model did not always predict chlorophyll concentration accurately. For example, observed chlorophyll concentrations near the lakebed were often lower than those predicted by the model. Agreement between observed and predicted chlorophyll concentration improved with distance downstream from the leading edge of the reef. The discrepancy between observed and predicted chlorophyll concentrations may have resulted from two factors. First, our model assumed that Dreissena did not populate the region upstream of the reef, and that mussels impacted phytoplankton only after water had flowed over the reef. Recent studies have illustrated that soft sediments adjacent to reefs in Lake Erie support large Dreissena colonies (Berkman and others 1998; Bially 1998). Upstream colonies could deplete chlorophyll prior to water flowing across the reef and result in lower than expected chlorophyll concentrations. Second, predicted vertical chlorophyll concentration patterns were determined, in part, by the vertical diffusion rate, which was in turn based on an empirical fit of Lake Erie velocity distribution (Figures 2B and 2D) to the log-law theoretical expectation (Fisher and others 1979). If the velocity distributions used to estimate this relationship were not typical of flow conditions in the basin, then predicted vertical flux of chlorophyll would be affected. Our measurements were made during relatively calm periods when flow velocities near the lakebed ranged between 2 and 6 cm/s (Figures 2B and 2D). Summer storms would greatly increase vertical diffusion, reduce the phytoplankton concentration gradient, and provide mussels with greater access to food. Boundary roughness may also affect filtering impacts of mussel populations. First, rough surfaces increase the total surface area available to mussels above that represented by simple aerial measures of surface area. Mussel colonies in western Lake Erie
may extend 10 cm above the sediment–water interface (Berkman and others 1998). More importantly, boundary roughness can increase turbulence near the mussel bed and increase delivery of phytoplankton to mussels (Fre´chette and others 1989). We incorporated an increase in surface area of 25% in our models, though the actual value would likely vary in relation to bottom topography and mussel density and size structure. It is not clear whether our model can be applied to other types of lentic systems invaded by Dreissena, notably stratified lakes. Physical changes in water density associated with stratification would isolate surface from benthic waters and severely diminish turbulent mixing. Consequently, log-law assumptions of extensive water column mixing would not apply. Similar limitations on benthic feeding effects have been observed in marine systems stratified by temperature or salinity gradients. For example, Koseff and others (1993) reported that stratification is a necessary condition for phytoplankton blooms in simulated, shallow estuaries because it isolates plankton in an environment where growth may occur rapidly, and because it decouples benthic grazers from surface phytoplankton by reducing vertical transport. In the Great Lakes, reductions in chlorophyll at monitored stations have been least apparent in deep stratified basins or in those where mussel biomass is likely considerably lower than in Lake Erie (Nicholls and others 1999). Coupling between pelagic and benthic regions will diminish with increasing depth of lakes. This effect would be particularly acute in stratified lakes where phytoplankton was concentrated in the epilimnion. We expect that introduced Dreissena would have very little direct impact on phytoplankton under these circumstances. Enhanced benthic–pelagic coupling holds important consequences for benthic communities in invaded lakes. Although unionid molluscs have been severely impacted by Dreissena fouling (Schloesser and others 1996), many other invertebrate species have responded positively to Dreissena invasion (Ricciardi and others 1997; Bially 1998; Stewart and others 1998a, 1998b). Responses by some species are related to habitat complexity associated with mussel shells, though others responded to enhanced food resources associated with mussel feces and pseudofeces. These changes have facilitated higher densities of invertebrate and vertebrate predators of zebra mussels and invertebrates associated with mussels (Ricciardi and others 1997; Bially 1998; Stewart and others 1998a, 1998b). In summary, surveys in western Lake Erie revealed very low chlorophyll concentrations above
Mussel Filtering in a Shallow Lake reefs encrusted with Dreissena mussels. Hydrodynamic modeling of mussel grazing impacts revealed that effects are transmitted throughout the water column but are most acute directly above mussel beds. Sensitivity analysis suggested that impacts of mussel grazing depend mainly on the upstream chlorophyll concentration, on water mixing characteristics, and on the feeding efficiency of the mussel bed. These simulations and field results indicate that very strong benthic–pelagic coupling has been established in shallow, well-mixed basins invaded by Dreissena mussels. Enhanced production and abundance of many benthic invertebrates is consistent with ‘‘energetic focusing’’ in benthos of shallow lakes invaded by Dreissena.
ACKNOWLEDGMENTS We thank the crew of the R/V Loftus, Karen Ralph and Tom McDougal for sampling assistance, Gord Martin for counting plankton samples, and two anonymous reviewers for helpful comments. This study was supported by research grants from NSERC, the Ontario Ministry of Natural Resources, and the Great Lakes University Research Fund to H.J.M. and W.G.S., by a Great Lakes Institute for Environmental Research postdoctoral fellowship to J.Y., and by a NATO postdoctoral fellowship to I.A.G.
REFERENCES Alpine AE, Cloern JE. 1992. Trophic interactions and direct physical effects control phytoplankton biomass and production in an estuary. Limnol Oceanograph 37:946–55. Arnott DL, Vanni MJ. 1996. Nitrogen and phosphorus recycling by the zebra mussel (Dreissena polymorpha) in the western basin of Lake Erie. Can J Fish Aquat Sci 53:646–59. Asmus RM, Asmus H. 1991. Mussel beds: limiting or promoting phytoplankton. J Exp Mar Biol Ecol 148:215–32. Berkman PA, Haltuch MA, Tichich E, Garton DW, Kennedy GW, Gannon JE, Mackay SD, Fuller JA, Liebenthal DL. 1998. Zebra mussels invade Lake Erie muds. Nature 393:27–8. Bially AW. 1998. Distribution of Dreissena spp. on soft substrates in western Lake Erie and their impact on benthic invertebrate communities. M.Sc. thesis, University of Windsor. 93 p. Caraco NF, Cole JJ, Raymond PA, Strayer DL, Pace ML, Findlay SEG, Fischer DT. 1997. Zebra mussel invasion in a large, turbid river: phytoplankton response to increased grazing. Ecology 78:588–602. Dahl JA, Graham DM, Dermott R, Johannsson OE, Millard ES, Miles DD. 1995. Lake Erie 1993, western, west central and eastern basins: changes in trophic status, and assessment of the abundance, biomass and production of the lower trophic levels. Canadian technical report of the Fisheries and Aquatic Sciences. nr 2070. Denny MW. 1988. Biology and the mechanics of the wave-swept environment. Princeton, NJ: Princeton University Press. Dobson EP, Mackie GL. 1998. Increased biodeposition of organic matter, polychlorinated biphenyls, and cadmium by zebra
349
mussels (Dreissena polymorpha) in western Lake Erie. Can J Fish Aqua Sci 55:1131–9. Doering PH, Oviatt CA. 1986. Application of filtration rate models to field populations of bivalves: an assessment using experimental mesocosms. Mar Ecol Prog Ser 31:265–75. Fahnenstiel GL, Bridgeman TB, Lang GA, McCormick MJ, Nalepa TF. 1995. Phytoplankton productivity in Saginaw Bay, Lake Huron: effects of zebra mussel (Dreissena polymorpha) colonization. J Great Lakes Res 21:465–75. Fanslow DL, Nalepa TF, Lang GA. 1995. Filtration rates of the zebra mussel (Dreissena polymorpha) on natural seston from Saginaw Bay, Lake Huron. J Great Lakes Res 21:489–500. Fisher HB, List EJ, Koh RCY, Imberger J, Brooks NH. 1979. Mixing in inland and coastal waters. New York: Academic Press. Fre´chette M, Butman CA, Geyer WR. 1989. The importance of boundary-layer flows in supplying phytoplankton to the benthic suspension feeder, Mytilus edulis L. Limnol Oceanogr 34:19–36. Gerritsen J, Holland AF, Irvine D. 1994. Suspension-feeding bivalves and the fate of primary production: an estuarine model applied to Chesapeake Bay. Estuaries 17:403–16. Holland RE. 1993. Changes in planktonic diatoms and water transparency in Hatchery Bay, Bass Island area, western Lake Erie since the establishment of the zebra mussel. J Great Lakes Res 19:617–24. Jude DJ, Leach JH. 1993. The Great Lakes fisheries. In: Kohler CC, Hubert WA, editors. Inland fisheries management in North America. Bethesda, MD: American Fisheries Society. p 517–51 Klerks PL, Fraleigh PC, Lawniczak JE. 1996. Effects of zebra mussels (Dreissena polymorpha) on seston levels and sediment deposition in western Lake Erie. Can J Fish Aquat Sci 53:2284– 91. Koseff JR, Holen JK, Monismith SG, Cloern JE. 1993. Coupled effects of vertical mixing and benthic grazing in phytoplankton populations in shallow, turbid estuaries. J Mar Res 51:843–68. Kryger J, Riisga˚rd HU. 1988. Filtration rate capacities in 6 species of European freshwater bivalves. Oecologia 77:34–8. Leach JH. 1993. Impacts of the zebra mussel (Dreissena polymorpha) on water quality and fish spawning reefs in western Lake Erie. In: Nalepa TF, Schloesser DW, editors. Zebra mussels. biology, impacts, and control. Boca Raton, FL: Lewis Publishers. p 381–97 MacIsaac HJ. 1996. Potential abiotic and biotic effects of zebra mussels on inland waters of North America. Am Zool 36: 287–99. MacIsaac HJ, Sprules WG, Johannsson OE, Leach JH. 1992. Filtering impacts of larval and sessile zebra mussels (Dreissena polymorpha) in western Lake Erie. Oecologia 92:30–9. Madenjian CP. 1995. Removal of algae by the zebra mussel (Dreissena polymorpha) population in western Lake Erie: a bioenergetics approach. Can J Fish Aquat Sci 52:381–90. Makarewicz JC, Bertram P. 1991. Evidence for the restoration of the Lake Erie ecosystem. Bioscience 41:216–23. Mazak EJ, MacIsaac HJ, Servos MR, Hesslein R. 1997. Influence of feeding habits on organochlorine contaminant accumulation in Great Lakes waterfowl. Ecol Appl 7:1133–43. Mellina E, Rasmussen JB, Mills EL. 1995. Impact of zebra mussel (Dreissena polymorpha) on phosphorus cycling and chlorophyll in lakes. Can J Fish Aquat Sci 52:2553–73.
350
H. J. MacIsaac and others
Mills EL, Leach JH, Carlton JT, Secor CL. 1993. Exotic species in the Great Lakes: a history of biotic crises and anthropogenic introductions. J Great Lakes Res 19:1–54. Mitchell MJ, Mills EL, Idrisi N, Michener R. 1996. Stable isotopes of nitrogen and carbon in an aquatic food web recently invaded by Dreissena polymorpha (Pallas). Can J Fish Aquat Sci 53:1445–50. Nicholls KH, Hopkins GJ, Standke SJ. 1999. Reduced chlorophyll to phosphorus ratios in nearshore Great Lakes waters coincide with the establishment of dreissenid mussels. Can J Fish Aquat Sci 52:153–61. Officer CB, Smayda TJ, Mann R. 1982. Benthic filter feeding: a natural eutrophication control. Mar Ecol Prog Ser 9:203–10. Ogilvie SC, Mitchell SF. 1995. A model of mussel filtration in a shallow New Zealand lake, with reference to eutrophication control. Archiv fu¨r Hydrobiologie 133:471–82. O’Riordan CA, Monismith SG, Koseff JR. 1993. A study of concentration boundary-layer formation over a bed of model bivalves. Limnol Oceanogr 38:1712–29. Prins TC, Escaravage V, Smaal AC, Peters JCH. 1995. Nutrient cycling and phytoplankton dynamics in relation to mussel grazing in a mesocosm experiment. Ophelia 41:289–315. Prins TC, Smaal AC, Pouwer AJ, Dankers N. 1996. Filtration and resuspension of particulate matter and phytoplankton on an intertidal mussel bed in the Oosterschelde estuary (SW Netherlands). Mar Ecol Prog Ser 142:121–34. Reynolds CS. 1986. The ecology of freshwater phytoplankton. Cambridge University Press. Ricciardi A, Whoriskey FG, Rasmussen JB. 1997. The role of the zebra mussel (Dreissena polymorpha) in structuring macroinvertebrate communities on hard substrata. Can J Fish Aquat Sci 54:2596–608. Scheffer M. 1998. Ecology of shallow lakes. New York: Chapman and Hall. 357 p. Schloesser DW, Nalepa TF, Mackie GL. 1996. Zebra mussel infestation of Unionid bivalves (Unionidae) in North America. Am Zool 36:300–10. Stewart TW, Miner JG, Lowe RL. 1998a. Quantifying mechanisms for zebra mussel effects on benthic macroinvertebrates: organic matter production and shell-generated habitat. J North Am Benthological Soc 17:81–94. Stewart TW, Miner JG, Lowe RL. 1998b. Macroinvertebrate communities on hard substrates in western Lake Erie: structuring effects of Dreissena. J Great Lakes Res 24:868–79.
Stoermer EF, Emmert G, Julius ML. 1996. Paleolimnological evidence of rapid recent change in Lake Erie’s trophic status. Can J Fish Aquat Sci 53:1451–8. Strayer DL, Caraco NF, Cole JJ, Findlay S, Pace ML. 1999. Transformation of freshwater ecosystems by bivalves: a case study of zebra mussels in the Hudson River. Bioscience 49:19– 28. Strickland JD, Parsons TR. 1972. A practical handbook of seawater analysis. 2nd ed.Bulletin of the Fisheries Research Board of Canada. Vogel S. 1983. Life in moving fluids. Princeton, NJ: Princeton University Press. Wisenden PA, Bailey RC. 1995. Development of macroinvertebrate community structure associated with zebra mussel (Dreissena polymorpha) colonization of artificial substrates. Can J Zool 73:1438–43. Ye J, McCorquodale JA. 1997. Depth-averaged hydrodynamic modeling in curvilinear collocated grid. ASCE J Hydraulic Eng 123:380–8.
Appendix 1 List of Symbols Used in Model Formation Symbol
Definition
Units
C G H K n P q t u U* ws x, z c ⌬
Chlorophyll a concentration Consumption rate Water depth Turbulent eddy viscosity Mussel density Chlorophyll a production rate Pumping rate Time Longitudinal velocity Lake bed shear velocity Settling velocity of chlorophyll a Cartesian coordinates Turbulent Schmidt number for C Mussel colony feeding efficiency von Karman constant Bottom roughness of lake
µg/L µg/L/d m m2 /sec ind./m2 µg/L/d L/d s cm/s cm/s m/d
mm