ECOSYSTEMS
Ecosystems (2000) 3: 131–143 DOI: 10.1007/s100210000015
r 2000 Springer-Verlag
MINI-REVIEW
Nutrient Cycling in Lakes and Streams: Insights from a Comparative Analysis Timothy E. Essington* and Stephen R. Carpenter Center For Limnology, University of Wisconsin–Madison, 680 N. Park Street, Madison, Wisconsin 53703, USA
ABSTRACT Understanding of general ecosystem principles may be improved by comparing disparate ecosystems. We compared nutrient cycling in lakes and streams to evaluate whether contrasts in hydrologic properties lead to different controls and different rates of internal nutrient cycling. Our primary focus was nutrient cycling that results in increased productivity, so we quantified nutrient cycling by defining the recycling ratio () as the number of times a nutrient molecule is sequestered by producers before export. An analytic model of nutrient cycling predicted that in lakes is governed by the processes that promote the mineralization and retard the sedimentation of particulate-bound nutrients, whereas in streams, is governed by processes that promote the uptake and retard the export of dissolved nutrients. These differences were the consequence of contrast between lakes and streams in the mass-specific export rates (mass exported · standing stock-1 · time-1) of
dissolved and particulate nutrients. Although is calculated from readily measured ecosystem variables, we found very few published data sets that provided the necessary data for a given ecosystem. We calculated and compared in two well-studied P-limited ecosystems, Peter Lake and West Fork Walker Branch (WFWB). When ecosystems were scaled so that water residence time was equal between these two ecosystems, was three orders of magnitude greater in WFWB. However, when we scaled by P residence time, was nearly equal between these two ecosystems. This suggests broad similarities in across ecosystem types when ecosystem boundaries are defined so that turnover times of limiting nutrients are the same.
INTRODUCTION
source of nutrients for primary producers (for example, Levine and Schindler 1980; Tripathi and Singh 1994), so there is tight coupling between the rate of nutrient cycling and primary productivity. Consumers thereby can control primary productivity by altering the rate of nutrient remineralization and subsequent uptake (Kitchell and others 1979). Furthermore, the magnitude of nutrient cycling has important effects on ecosystem resistance and recovery from disturbance (DeAngelis and others 1989). For these reasons, processes governing the rate of
Key words: ecosystem; lakes; streams; nutrient cycling; lotic; lentic; comparative analysis; ecosystem models.
Cycling of limiting nutrients is an important property of ecosystems (forest, Vitousek and Sanford 1986; ocean, Eppley and Peterson 1979; grassland, McNaughton and others 1988; lake, Fee 1979; stream, Elwood and others 1982). For many ecosystems, internal nutrient cycling is the dominant
Received 19 November 1998; accepted 6 October 1999. *Corresponding author; e-mail:
[email protected]
131
132
T. E. Essington and S. R. Carpenter
cycling have received considerable attention from ecologists. However, studies tend to be conducted within a single ecosystem or ecosystem type, and there have been few attempts to derive generalized hypotheses about the processes governing nutrient cycling across ecosystems. Comparative analysis of nutrient cycling may be able to provide such generalizations (Pace 1991), and the broadest generalizations may be generated by comparisons of very different types of ecosystems (Fisher and Grimm 1991). Freshwater ecosystems provide a large contrast in physical properties, defined in part by contrasts in water flow and hydrologic flushing rate. At one end of this continuum are streams (unidirectional flow and high flushing rate), and at the other end are lakes (turbulent mixing and low flushing rate). These ecosystems are further distinguished by the relative importance of benthic (streams) versus pelagic (lakes) productivity. Perhaps because of these differences, nutrient cycling in lakes and streams has been studied with markedly different paradigms. A comparative analysis that addresses how differences in nutrient cycling between lakes and streams are a consequence of the contrasts in physical environments may lead to a broader understanding of nutrient cycling in aquatic ecosystems. Because nutrient cycling in aquatic ecosystems is governed in part by hydrologic processes, one may expect markedly different controls on recycling and also different amounts of internal nutrient cycling in lakes and streams. The main goal of this article is to assess these expectations. We focus on cycling that ultimately results in the uptake of limiting nutrients by producers and therefore quantify internal nutrient cycling by considering the number of times nutrient molecules are sequestered by producers before export. We use a generalized model of nutrient cycling to evaluate how differences in hydrology cause the controls of nutrient cycling to differ between lakes and streams. We then quantify and compare the amount of internal nutrient cycling between a lake and stream ecosystem to evaluate whether markedly different physical environments lead to different amounts of recycling.
Nutrient Cycling in Lentic Systems Much research on lake nutrient cycling has focused on lake epilimnetic zones, most likely because this region has clearly defined boundaries and the majority of primary production often occurs there. The majority of epilimnetic primary production often is fueled by recycled nutrients (Fee 1979; Levine and Schindler 1980; Caraco and others 1992), so that internal processes that mediate the rate of nutrient
cycling have large effects on lake productivity. For example, lake morphometric features that reduce nutrient losses can enhance nutrient cycling and thereby enhance primary production (Fee 1979; Fee and others 1992, 1994). Also, excretion by zooplankton (Barlow and Bishop 1965; Andersson and others 1988; Urabe and others 1995) and fish (Kraft 1992; Schindler 1992; Schindler and others 1993; Vanni 1996) can be important sources of nutrients for phytoplankton. Enhanced algal growth in response to nutrient release by zooplankton may compensate for or even exceed loses due to grazing (Lehman and Sandgren 1985; Sterner 1986; Sterner and others 1995). However, Daphnia grazing also can reduce nutrient cycling by increasing nutrient export via sedimentation of fecal material (Bossard and Uehlinger 1993; Elser and others 1995).
Nutrient Cycling in Lotic Systems Because nutrient cycling in streams has a downstream vector, nutrient cycling resembles a downstream ‘‘spiral’’ (Webster and Patten 1979; Elwood and others 1982). Thus, stream ecologists often quantify nutrient cycling by measuring spiralling length (S), which is the downstream distance a nutrient molecule travels while cycling from a dissolved form to particulate form and back to dissolved form. Nutrient transport may occur in the particulate or dissolved form, but because much of this transport occurs in the dissolved form, many investigators focus on the dissolved component of spiralling length, called the uptake length (Stream Solute Workshop 1990). Uptake length varies substantially among streams. Streams with extensive hyporheic (subsurface) flow have shorter uptake lengths (Mulholland and others 1997) and therefore have higher rates of nutrient cycling. Substrate composition and channel type also affect uptake length, but the manner by which these attributes affect uptake length may be site specific and depend on complex interactions between light availability and channel morphology (Munn and Meyer 1990; Martı´ and Sabater 1996). Consumers may affect spiralling length by reducing recycling of nutrients within periphyton mats (Mulholland and others 1991, 1994), and by increasing the particulate transport of nutrients (Wallace and others 1982; Grimm 1988). Disturbances, such as floods, create a temporal pattern of nutrient cycling wherein spiralling lengths are long immediately after floods and gradually shorten over successional time (Martı´ and others 1997; Fisher and others 1998).
Nutrient Cycling in Lakes and Stream
A COMMON CURRENCY CYCLING
OF
NUTRIENT
Lake ecologists often quantify nutrient cycling by calculating the portion of primary production supported by recycled nutrients (Caraco and others 1992), the ratio of ‘‘new’’ primary production to recycled production (F ratio; Eppley and Peterson 1979), or the increase in compartment transfers that results from cycling (Finn 1976; Richey and others 1978). In contrast, stream ecologists quantify nutrient cycling by calculating spiralling or uptake length. A synthesis of ideas begins with a common metric to quantify nutrient cycling in both ecosystem types. One way to arrive at such a metric is to consider the fundamental processes that control cycling rates. In the broadest sense, the amount of internal nutrient cycling is determined by the rate at which nutrients are sequestered and the rate at which nutrients are lost from the ecosystem. These two processes can be combined by considering the average number of times nutrient molecules are used before being exported from the system (Poister and others 1994). We refer to this measure as the recycling ratio (, which can be calculated as the ratio of uptake rate (U; mass/time) to export rate (E; mass/ time): ⫽
U E
133
.
(1)
Thus, is a dimensionless number with a straightforward interpretation that can be applied to all ecosystem types. Moreover, can be derived from parameters often measured in both lakes and streams. For example, in streams equals stream length (L) divided by the spiralling length (Newbold and others 1982), and in lakes equals the inverse of the export ratio (proportion of sequestered nutrients that is exported; Baines and Pace 1994; Elser and others 1995).
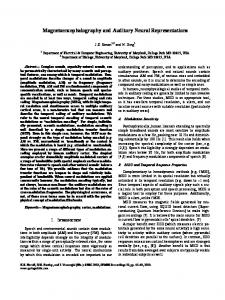
A CONCEPTUAL MODEL FOR NUTRIENT CYCLING IN LAKES AND STREAMS A generalized model must suppress the idiosyncrasies of individual ecosystems and highlight common processes. We derived such a model from the premise that nutrient cycling is controlled by the uptake rate of dissolved nutrients, the rate of nutrient release from particulates, and the rate of nutrient export from the ecosystem (Figure 1). We define the dissolved pool as consisting of both inorganic (available) and organic (unavailable) forms and consider the consequences of this aggregation later (see Discussion). We define the particulate component
Figure 1. Schematic representation of conceptual model. Arrows represent fluxes of nutrients, and boxes represent nutrient pools.
as any ecosystem component that is capable of active uptake of dissolved nutrients (for example, phytoplankton, periphyton, and microbes). Nutrients may leave the system directly from the dissolved pool (hydrologic flushing) or via the particulate pool (sedimentation, downstream transport). The nutrient release component encompasses the entire flux of nutrients through the producer pool that results in nutrients being transferred to the dissolved pool. This includes consumer-mediated remineralization. However, the fraction of consumed nutrients that is sequestered into consumer tissues (consumer sinks; Andersen 1997) can be considered a nutrient export because at short time scales, these nutrients are not available for production. The model provides a framework to evaluate the ways in which lakes and streams differ. Although it is not clear whether uptake or release rates differ between these ecosystems, there is evidence that the route of export does. Within lake epilimnetic zones, particulates are suspended in a medium that has low flushing rates (high hydraulic residence times), such that sedimentary losses are often more important than hydrologic losses (Frisk and others 1980). Furthermore, any hydrologic loss that occurs is comprised of both suspended particulate and dissolved components. Thus, particulate-bound nutrients should have a higher mass-specific export rate (mass exported · standing stock-1 · time-1) than dissolved nutrients. In low-order streams, particulates are largely attached to the stream bed so that they have high residence time, whereas the residence time of water is much shorter. Thus, dissolved nutrients should have a higher mass-specific export rate than particulate-bound nutrients. We propose that an important distinction between lakes and streams is the relative magnitude of mass-specific export rate for particulate (denoted ey; higher in
134
T. E. Essington and S. R. Carpenter
Table 1. Comparison of Percentages of Hydrologic versus Sedimentary Export for Lakes Hydrologic Sedimentation (%) (%) Reference Nitrogen Kinneret
69
31
Horw Bay
21
79
Rotsee Phosphorus
34
66
Kinneret
9
91
Mendota
21
79
Mirror
2
98
Horw Bay
15
85
Rotsee
54
46
Paul
14
86
Peter
8
92
West Long 3
97
Smith and others 1989 Bloesch and others 1977 Bloesch and others 1977 Smith and others 1989 Lathrop and others 1998 Caraco and others 1992 Bloesch and others 1977 Bloesch and others 1977 S.R. Carpenter unpublished S.R. Carpenter unpublished S.R. Carpenter unpublished
lakes) and dissolved (denoted ed; higher in streams) nutrients. To test this idea, we gathered published data on N and P export for lake epilimnetic zones and for C, N, and P transport for streams. The literature typically reports total export, that is, mass-specific export · standing stock, but not standing stock. Thus, comparisons of ed and ey require addition information or assumptions. For lakes, nutrients can be exported via either hydrologic flushing or sedimentation. Sedimentation consists only of particulate nutrients, but hydrologic losses consist of both dissolved and particulate nutrients. Thus, if all nutrient export is via sedimentation, then ey : ed, and if all nutrient export is via hydrologic losses and all particulates are suspended, then ey ⫽ ed. The assumption that nutrients in attached (for example, benthos) particulates can be ignored is reasonable for large, deep lakes with limited littoral zones and extensive pelagic zones. Shallow lakes with extensive littoral production may have ed ⬎ ey. We compiled data on hydrologic and sedimentary losses for lakes where the pelagic zone comprised at least 50% of the epilimnetic area (Table 1). In most
cases, sedimentation losses exceeded hydrologic losses, indicating ey : ed. Even in lakes where hydrologic losses exceed those for sedimentation (Kinneret for N, Rotsee for P), hydrologic losses likely include some particulates and ey may exceed ed. Furthermore, it was not uncommon for investigators to ignore hydrologic losses when constructing N budgets (for example, Hama and others 1990). Thus, data in Table 1 suggest that ey generally exceeds ed for lakes. Data were not available for C because most investigators assert that C loss via hydrologic processes is negligible and therefore rarely measure it (for example, Forsberg 1985; Baines and Pace 1991). For streams, there is no sedimentation loss because benthos is contained within the ecosystem. We therefore require an alternative means to discern the relative magnitudes of mass-specific exports. One approach derives from the observation that the majority of nutrients are bound to particulates. For example, Hall and others (1998) report that 85% of N standing stock is particulate (seston, benthos) in Hugh White Creek. Peterson and others (1986) estimate that the dissolved C concentration in Kuparak River averages only 10.1 g m-3, compared with a benthic particulate C standing stock of 56.1 g m-2 (Harvey and others 1997). Similarly, Fisher (1977) estimated that particulate organic matter comprised 96.5% of the total detrital organic matter. Finally, Newbold and others (1983) estimate that 99.5% of P standing stock in West Fork Walker Branch was particulate. Because particulate standing stock : dissolved standing stock, nutrient export should be overwhelmingly dominated by particulate-bound nutrients if the mass-specific export of dissolved and particulate nutrients were the same (ed ⫽ ey). However, published data on streams indicate that nutrient export is not dominated by particulates, and that dissolved export is commonly the dominant route of export (Table 2). For organic C, dissolved transport represented as much as 95% of transport (mean ⫽ 64%; Table 2). Differences in the route of N transport were more striking, with dissolved transport averaging 88% of total transport, except for Hugh White Creek that had a very high (85%) particulate export rate (Table 2). Fewer data were available for P. Newbold and others (1983) and Mulholland and others (1985) indicated that, during baseflow conditions, P is dissolved for the majority of its travel distance (Table 2), and most subsequent studies only have measured P uptake length. However, over long time periods (greater than 1 year), Meyer and Likens (1979) and Peterson and others (1992) noted large amounts of particulate P transport. Most
Nutrient Cycling in Lakes and Stream
135
Table 2. Comparison of Dissolved versus Particulate Nutrient Transport for Streams
Organic carbon Rattlesnake Springs Bear Brook Fort River Kings Creek Kuparak River Monument Creek Sycamore Creek Breitenbach Canada Stream Ogeechee River Creeping Swamp West Fork Walker Branch White Clay Creek Buzzards Branch Keppel Creek Satellite Branch Hugh White Creek Phosphorus Bear Brook West Fork Walker Branch Kuparak River Nitrogen Sycamore Creek Fryxcell Stream Bear Brook Beaver Creek Hugh White Creek Watershed 10
Dissolved (%)
Particulate (%)
Reference
68 23 76 94 92 93 98 96 21 96 95 32 33 74 47 33 29
32 77 24 6 8 7 2 4 79 4 5 68 67 26 53 67 71
Cushing 1997 Findlay and others 1997 Fisher 1977 Gray 1997 Harvey and others 1997 Irons and Oswood 1997 Jones and others 1997 Marxsen and others 1997 McKnight and Tate 1997 Meyer and others 1997 Mulholland 1981 Mulholland 1997 Newbold and others 1997 Smock 1997 Treadwell and others 1997 Wallace and others 1997 Webster and others 1997
21 86 49
78 14 51
Meyer and Likens 1979 Newbold and others 1983 Peterson and others 1992
95 90
5 10
96 82 15 78
4 18 85 23
Grimm 1987 Howard-Williams and others 1989 Meyer and others 1981 Naiman and Melillo 1984 Hall and others 1998 Triska and others 1984
of this particulate transport occurred during shortlived floods, when large amounts of particulate matter are scoured from the stream bed. However, during baseflow conditions, particulate export is much less than dissolved export (Meyer and Likens 1979; Mulholland and others 1985). Data from 213 streams from the United States Geological Survey National Water Quality Assessment Program provide similar results; the mean dissolved N and P export from these streams was 80% and 66%, respectively (see http://wwwrvares.er.usgs.gov/ nawqa). Only 14 of these streams had less than 50% dissolved P export, and only one stream had less than 50% dissolved N export. Combining data on standing stocks and export rates provides estimates of the relative magnitudes of ed and ey. For N in Hugh White Creek (Hall and others 1998), the ratio ed/ey (denoted ␥) is 4.2, indicating that a nutrient molecule is four times more likely to be transported when in the dissolved than when in the particulate state. For C in Fort
River (Fisher 1977), the ratio of mass-specific export rates is more than an order of magnitude greater (␥ ⫽ 87). The most extreme estimate of ␥ comes from P transport in Walker Branch creek, where we estimate that the ratio of mass-specific exports is ␥-1200. Thus, published data from streams support the contention that mass-specific export of dissolved nutrients exceeds that of particulate nutrients.
EVALUATING THE CONSEQUENCES OF NUTRIENT EXPORT: A MATHEMATICAL MODEL OF NUTRIENT CYCLING We developed a mathematical model of nutrient dynamics to evaluate how the sensitivity of to uptake and release rates depends on the relative magnitudes of dissolved and particulate massspecific export. We adopted a mathematical approach commonly used in models of stream (Newbold and others 1982, 1983; Stream Solute
136
T. E. Essington and S. R. Carpenter
Workshop 1990) and lake (DeAngelis 1992) ecosystems, in that we assumed linear, donor-controlled transfers of nutrients between compartments. Although globally the assumption of linearity is false, it is a reasonable approximation of nutrient dynamics under some conditions (DeAngelis 1992). Also, donor-control of nutrient transfers is not a reasonable assumption over all state space, because nutrient uptake can be independent of dissolved nutrient concentration when nutrient concentrations are high (Hart and others 1992) or when particulate biomass is low (Mulholland and others 1990). Thus, the following model approximates uptake kinetics when dissolved nutrients are in limiting supply relative to nutrient demands of the biota. Nutrient uptake by producers is described by the nutrient uptake coefficient, u (time-1), which indicates the fraction of the dissolved pool (D; mass) that flows into the particulate pool (Y; mass) per unit time. Similarly, nutrients are released from the particulate pool back into the dissolved pool at a rate described by the nutrient release coefficient (r; time-1) and the particulate standing stock. The release coefficient encompasses the entire flux of nutrients through the producer pool that results in nutrients being released. Exports of nutrients via the dissolved and particulate pools are also donor controlled and are described by the mass-specific export parameters ed (time-1) for dissolved nutrient losses and ey (time-1) for particulate nutrient losses. Under these assumptions, nutrient dynamics can be described by the expressions: dD dt dY dt
⫽ I ⫹ rY ⫺ uD ⫺ edD
(1a)
⫽ uD ⫺ rY ⫺ eyY,
(1b)
where I represents the input rate of dissolved nutrients (mass/time). For mathematical convenience, we did not include particulate inputs, but this simplification did not change the qualitative results of our model (see below). At steady state, the standing stocks are given by: D* ⫽ Y* ⫽
I(ey ⫹ r)
(2a)
edey ⫹ edr ⫹ uey Iu edey ⫹ edr ⫹ uey
.
(2b)
We used these expressions to calculate as a function of r, u, ey, and ed. At steady state, equals uD* (uptake rate) divided by edD*⫹eyY* (export
Figure 2. Effect of export route (␥; dissolved:particulate export coefficients) and uptake coefficient (u) on *. * is a linear function of u when ␥ is large (dissolved ⬎ particulate), * is independent of u when ␥ is small (particulate ⬎ dissolved), and * is an asymptotic function of u for intermediate values of ␥.
rate). This expression simplifies to give the steady state recycling ratio (*): * ⫽
u(ey ⫹ r) edey ⫹ err ⫹ uey
.
(3)
We can use this model to evaluate the sensitivity of * to changes in the release or uptake coefficient under different assumptions about the importance of dissolved versus particulate export. We define the parameter ␥ as the ratio of mass-specific export coefficients (ed /ey) and rearrange Eq. (3) as: * ⫽
␥(ey ⫹ r) ed
(
u
)
u ⫹ ␥(ey ⫹ r)
.
(4)
We first consider how ␥ affects the sensitivity of * to the uptake coefficient (u). Eq. (4) indicates that is an asymptotic function of u, with a maximum * equal to ␥(ey⫹r)/ed. * is half this maximum value when u ⫽ ␥(ey⫹r). When ␥ is large (␥ ⫽ 100; dissolved ⬎ particulate export), both the asymptote and the half-saturation value are large so that over a broad range of u, the function is approximately a linear function of u (Figure 2). When ␥ is small (␥ ⫽ 0.01; particulate ⬎ dissolved export), both the half-saturation value and the asymptote are low, such that over most values of u, * is independent of u (Figure 2). At intermediate values of ␥ (␥ ⫽ 1), * is an asymptotic function of u, indicating that * is sensitive to u when u is small but independent of u
Nutrient Cycling in Lakes and Stream
Figure 3. Effect of export route (␥; dissolved:particulate export coefficients) and release coefficient (r) on *. * is a linear function of r when ␥ is small (particulate ⬎ dissolved), * is independent of r when ␥ is large (dissolved ⬎ particulate), and * is an asymptotic function of r for intermediate values of ␥.
at higher values because other processes become limiting (Figure 2). Analogous results were obtained for the sensitivity of * to the release coefficient (r). When ␥ is small, * increases approximately linearly with r (Figure 3). When ␥ is large, is approximately independent of r because the asymptote and halfsaturation value are very low (Figure 3). Like the relationship between * and u, * is an asymptotic function of r for intermediate values of ␥ (Figure 3). In summary, the relative magnitude of the massspecific dissolved and particulate export rates dictates the extent to which uptake processes or release processes limit the rate of internal nutrient cycling. We also can evaluate the sensitivity of * to uptake and release parameters by considering approximations of Eq. (3) for extreme values of ␥ (for example, when export is almost entirely in either the dissolved or the particulate form). When ␥ is very large, we can approximate Eq. (3) by setting ey ⫽ 0: * ⫽
u ed
.
(5)
When ␥ is very small, we can approximate Eq. (3) by setting ed ⫽ 0, such that Eq. (3) simplifies to: * ⫽ 1 ⫹
r ey
.
(6)
137
These approximations indicate that the processes governing cycling may be markedly different between lakes (small ␥) and streams (large ␥). When ␥ is large (streams), is governed by the uptake and dissolved export coefficients. Importantly, this result leads to the same model structure outlined in the Stream Solute Workshop (1990) (where u ⫽ ks in the Stream Solute Workshop notation). Specifically, if all nutrient transport is in the dissolved form, then the approximation of * [Eq. (5)] is equivalent to uptake length divided by stream length. When ␥ is very small (lakes), is governed by the tendency for nutrients in the particulate pool to be released into the dissolved pool versus being exported from the system (r/ey). This result is equivalent to the model of lake epilimnetic nutrient dynamics presented by Elser and others (1995). These results imply that the mechanisms by which consumers affect nutrient cycling may be fundamentally different in lakes and streams. In streams, consumers affect by modifying the fate of dissolved nutrients (uptake versus export; u/ed). The primary way that consumers affect this ratio is by altering the transient water storage within periphyton mats (Mulholland and others 1994; Steinman and others 1995). These storage zones are important because they promote high rates of cycling within algal mats (Paul and Duthie 1989). Consequently, by reducing periphyton biomass, periphyton grazers may increase uptake length and thereby decrease (Mulholland and others 1994). In contrast, the model predicts that consumers in lakes affect by affecting the fate of particulate nutrients (release or export; r/ey). Thus, zooplankton may alter productivity by increasing nutrient release rates via the consumption and excretion of nutrients (Barlow and Bishop 1965; Lehman 1980; Lehman and Sandgren 1985; Sterner 1986), or by affecting nutrient sedimentation rates (Bossard and Uehlinger 1993; Elser and others 1995). Zooplankton stoichiometry (Elser and others 1996) controls the ratio of nutrients released to nutrients incorporated into body tissues, and thereby affects . Eq. (6) shows that when release (r) is zero, * ⫽ 1. This is due to the assumption that nutrient inputs inter the dissolved pool. All nutrients need to be sequestered at least once because they have to enter the particulate pool to be exported. If nutrient inputs are in particulate form, the approximation for * in lakes equals r/ey. The approximation for * for streams does not depend on the route of nutrient import. Thus, these approximations are robust to the route of nutrient input into the ecosystem.
138
T. E. Essington and S. R. Carpenter
THE RECYCLING RATIO: A STREAM–LAKE COMPARISON A broad comparison of across many lakes and streams would provide great insight into the similarities and contrasts between lakes and streams. This may appear to be a simple task, because is calculated from readily measured ecosystem variables. In lakes, nutrient export rates often are measured in nutrient budgets, and uptake rates can be estimated from primary production and C:P ratios of producers. Remarkably, there were few instances where these parameters were measured and/or reported concurrently (but see Levine and Schindler 1980; Caraco and others 1992; Poister and others 1994; Elser and others 1995). In streams, calculating from spiralling length is straightforward, but as described below, additional data needed to make useful comparisons are typically lacking (for example, nutrient standing stock). As an alternative to a broad comparison, we calculated for two well-studied, P-limited ecosystems where extensive data are available: West Fork of Walker Branch (WFWB) and Peter Lake. These sites were chosen because data on nutrient dynamics in both of these systems are among the most detailed available. WFWB is a first-order woodland stream located at the Oak Ridge National Laboratory (Tennessee, USA) and has been the site of extensive research on P dynamics (Newbold and others 1981, 1983; Mulholland and others 1985). Peter Lake is a small (2.2 ha) oligotrophic kettle lake located at the University of Notre Dame Environmental Research Station (near Land O’ Lakes, Wisconsin, USA) and has been the focus of whole-lake experiments since 1951, including experimental P enrichment since 1993 (Carpenter and Kitchell 1993; Carpenter and others 1996). We calculated for the pelagic epilimnion of Peter Lake over the summer stratified periods of 1991–96. Nutrient uptake rate (g/d) was calculated from estimates of primary production (Carpenter and others 1996) and the C:P ratio of phytoplankton. The latter estimates were derived from empirical regressions of seston C:P and epilimnion total P (TP) concentration (Sterner and others 1997; J. Elser personal communication) and were corroborated by direct measurements of C:P in 1994 (N. Caraco, unpublished data). Nutrient export rates (g/d) were calculated as the P loss rate necessary to balance the inputs and weekly changes in P standing stock. Weekly P standing stock was estimated from measurements of TP (mg/m3) sampled at various depths, and estimates of epilimnetic volume derived were from hypsometric data. When the thermocline deep-
ened, we considered this to be an input of new nutrients equal to the volume of water added times the TP at the depth immediately below the thermocline the previous week. P inputs were estimated from the known P enrichment rates and from estimated background P inputs (Houser 1997). We calculated for WFWB from data in Newbold and others (1983) and Mulholland and others (1985) by using the relationship that equals the length (L) of stream reach divided by the spiralling length (S). This derivation of is scale dependent, however, being a function of the reach length. One way to circumvent this difficulty is to define the stream reach length such that WFWB is comparable to Peter Lake. In other words, we defined ecosystem boundaries in a way that allowed us to make a useful comparison between ecosystems, recognizing that these boundaries may not represent delineations of adjacent ecosystems (Likens 1998). We chose two metrics with which to scale WFWB: water residence time and P residence time. To standardize by water residence time, we calculated the stream length required for WFWB to have the same water residence time as the epilimnion of Peter Lake (200 days; Cole and Pace 1998) assuming discharge ⫽ 3 L/s, width ⫽ 2.0 m, and water depth ⫽ 0.05 m (Newbold and others 1983). This calculation yielded a standardized length of 518 km, which is approximately three orders of magnitude longer than the actual length of WFWB (less than 400 m; Newbold and others 1983). To standardize by P residence time, we calculated Peter Lake P residence time from yearly mean P standing stocks and estimated P export rates (see above) and used the mean of the 6 years considered in this study (mean ⫽ 25.6 days). We then calculated stream length necessary so that WFWB had a comparable P residence time assuming that the P standing stock ⫽ 63.7 mg/m2 (exchangeable P), and downstream P flux rate ⫽ 0.0168 mg P/s (Newbold and others 1983). This yielded a standardized length of 292 m. For all WFWB calculations, we used the mean of four estimates of S (mean ⫽ 67.5 m; Mulholland and others 1985). Over years 1991–96, in Peter Lake ranged from 2.3 to 6.5 and averaged 3.2. For WFWB, varied widely depending on the scaling factor used. When scaling by water residence time, the recycling ratio of WFWB was 7674, over three orders of magnitude greater than of Peter Lake. However, when scaling by P residence time, the recycling ratio of WFWB equaled 4.32. Thus, when the two systems were scaled by P residence time, there was little difference in the amount of internal nutrient cycling between Peter Lake and WFWB.
Nutrient Cycling in Lakes and Stream
139
These results beg the question whether scaling by nutrient residence time necessarily yields more similar recycling ratios, or whether this result is unique to the two ecosystems compared here. To address this question, we revisit the derivation of the recycling ratio. is defined as the ratio of nutrient uptake rate (U; mass/time) divided by nutrient export rate (E; mass/time). Using the notation defined for Eq. (1), we can express as ⫽
U Ded ⫹ Yey
.
(7)
This expression allows us to evaluate how the two scaling metrics affect . Scaling ecosystems by water residence time (Rd) is equivalent to scaling by 1/ed, so that Eq. (7) simplifies to ⫽
U␥Rd D␥ ⫹ Y
.
(8)
Thus, is a linear function of water residence time, where the slope increases asymptotically with ␥ (Figure 4). Consequently, the large differences in between Peter Lake and WFWB is largely attributable to the very different routes of P export (Tables 1 and 2). In contrast, standardizing by nutrient residence time (Rt; time) implies that the ratio of total nutrient standing stock (D ⫹ Y) to export rate (E) is constant, so Eq. (7) simplifies to: ⫽
RtU D⫹Y
.
(9)
Eq. (9) shows that is a linear function of nutrient residence time whose slope does not depend on the route of export (Figure 4) but instead depends on the ratio of uptake rate to total nutrient standing stock. Thus, the similarity in between Peter Lake and WFWB indicates the uptake rates per total nutrient standing stock were roughly equivalent.
DISCUSSION We used as a metric with a simple ecosystem model to evaluate its sensitivity to broad ecological processes, such as uptake and remineralization rate. This exercise suggested that the controls on nutrient cycling in lakes and streams are very different, and that these differences are attributable to contrasts in the residence times of water and particulates. In streams, the export coefficient of dissolved nutrients exceeds that of particulate nutrients, so that cycling is controlled by the ability of particulates to sequester nutrients and by the tendency of dissolved
Figure 4. Comparison of how scaling factors used to define stream reach length affects the comparison between West Fork Walker Branch (WFWB) and Peter Lake. The recycling ratio () is a linear function of water residence time, where the slope depends on the ratio of dissolved to particulate export coefficients (␥). Because ␥ is much larger in WFWB, scaling by water residence time yields a very large recycling ratio in WFWB. In contrast, the estimate of obtained by scaling WFWB by nutrient residence time does not depend on ␥, and therefore is very similar between Peter Lake and WFWB.
nutrients to travel downstream. In lakes, the export coefficient of particulate nutrients is far greater than that of dissolved nutrients, so that cycling is controlled by processes that promote the remineralization and retard the sedimentation of particulatebound nutrients. An important implication of these results is that consumers should have very different roles in regulating nutrient cycling in these two systems. In lakes, consumers alter nutrient cycling by affecting the rate of nutrient remineralization from particulates and the rate of particulate export. In contrast, consumers in streams alter nutrient cycling by reducing cycling within algal mats, which likely affects both the uptake and export coefficients.
140
T. E. Essington and S. R. Carpenter
We expected a priori that would be driven by hydrology and therefore would be very different between lakes and streams. This was true when ecosystem boundaries were scaled by a hydrologic metric (water residence time), but was very similar when ecosystems were scaled so that the turnover times of limiting nutrients were the same. This similarity is surprising given that the controls on nutrient cycling are markedly different between lakes and streams. The similarity in suggests broad similarities across very different ecosystems may exist when ecosystem boundaries are adjusted to standardize nutrient residence times. A comparison of from other lakes and spiralling lengths of other streams confirms that the observed similarity between Peter Lake and West Fork Walker Branch was not merely coincidental. Poister and others (1994) report recycling ratios of 3.7, 6.6, and 7.6 for three lakes in Northern Wisconsin. Elser and others (1995) document seasonal variation in ranging from 1.5 to 4 in Lake 110 and 0.8–2 in Lake 240 at the Experimental Lakes Area, Manitoba, Canada. Furthermore, calculated for Paul Lake, Wisconsin, during 1991–96 averaged 2.0 (T.E. Essington unpublished analysis). Thus, the recycling ratio of Peter Lake may be typical for North temperate lakes. Furthermore, the range of spiralling lengths for West Fork Walker Branch (22–97 m; Mulholland and others 1985) is similar to that measured for other streams. Munn and Meyer (1990) report P uptake lengths ranging from 32 to 188 m in Hugh White Creek, North Carolina, and from 188–666 m in Watershed 2, Oregon. Martı´ and Sabater (1996) document P uptake lengths ranging from 10 to 250 m in La Solana, Spain, and 20 to 400 m in Riera Major, Spain. Similar ranges of P uptake lengths are reported in D’Angelo and Webster (1991) and Martı´ and others (1997). Unfortunately none of these studies reported the P standing stock and downstream flux rate required to standardize these systems by P residence time. However, this comparison indicates that spiralling length of WFWB is not atypical. Provided that the P flux and standing stock are not drastically different, recycling ratios scaled by nutrient resident time should be similar to that estimated for WFWB. Conclusions regarding the amount of internal nutrient recycling and the primary processes that govern nutrient cycling are largely dependent on the spatial and temporal scales of the analysis. We defined the spatial scale of Peter Lake as the pelagic epilimnion, because this region has clearly defined boundaries across which nutrient fluxes can easily be measured, and because the bulk of primary production occurs there. Very different conclusions
may be drawn if one considers the nutrient cycling in the entire lake. Clearly, expanding the spatial extent of the ecosystem will increase nutrient residence time, and thereby increase . However, estimating whole-lake residence time can be difficult owing to difficulties in estimating nutrient exchange and storage in sediments. Defining spatial extent of stream ecosystems is even more problematic, a difficulty long recognized by stream ecologists. Our analysis only considered nutrient cycling within the stream channel and only considered small-order streams. Very different conclusions may be drawn by considering broader spatial extents. For example, defining a stream ecosystem as the entire drainage from headwaters to ocean would yield a very different perspective regarding the relative importance of dissolved versus particulate export. Furthermore, broadening the spatial extent of the stream to include lateral fluxes and processing of nutrients in riparian zones would lead to larger estimates of than considering only the longitudinal flux of nutrients. The majority of published research on freshwater ecosystems derives from temperate lakes and streams, but as noted by Dodds (1997), these do not represent the majority of ecosystem types. Our sensitivity analysis of to ␥ provides some expectations concerning less well-studied systems. Shallow lakes may have a higher ed than deep lakes and therefore may more closely resemble streams. Similarly, reservoirs that have high hydrologic flushing may be considered intermediate between the stream and lakes considered here. Finally, large rivers may have extensive particulate transport and therefore may more closely resemble lakes than smaller streams. Our model did not distinguish between organic and inorganic dissolved nutrients, yet organic nutrients may comprise a substantial portion of the dissolved nutrient pool (Webster and Meyer 1997). The general predictions of our model are robust to this simplification. The distinction between available and unavailable nutrients can be generalized in the parameter u, which reflects the fraction of the dissolved pool taken up by particulates. When organic nutrients dominate the dissolved nutrient pool, u should be fairly small. In lakes, this will affect the rate of primary production but have little effect on the amount of nutrient cycling [Eq. (6)]. In streams, this should drastically affect both primary production and nutrient cycling because is highly sensitive to the uptake coefficient when ed is large. [Eq. (5)]. Comparative analyses of disparate ecosystems are challenging tasks. As we show here, choosing an
Nutrient Cycling in Lakes and Stream
141
appropriate temporal and spatial scale for comparative analyses is not a trivial exercise, and the results of any such analyses are likely to be dependent on the scales chosen. An equally difficult challenge is overcoming differences in terminology and identifying useful parameters for making cross-ecosystem comparison. The recycling ratio was a useful parameter for our comparison of lakes and streams, because it has an intuitive and straightforward interpretation. However, this parameter is not ideal for stream ecosystems because its inherent dependence on stream reach length. Thus, comparative parameters may be considered compromises much in the way that Fisher and Grimm (1991) describe crossecosystem comparisons as an optimization problem, where the adequacy of controls declines but generality of conclusions increases with more disparate ecosystems. Comparative parameters similarly may be less appropriate for individual ecosystem types but may allow evaluation of more general ecosystem properties. Perhaps the most important point of this study is that much can be gained from viewing two systems by using a common conceptual framework. Several insights were derived about each ecosystem simply by generating a simple model and evaluating how lakes and streams were contrasted within this framework. Moreover, the model served as a basis from which comparisons between the two ecosystems could be made and was useful for generating hypotheses concerning how the two systems differ. Comparative analyses of these sort (for example, Wagener and others 1998) are likely to be more effective than simply recognizing differences and similarities between systems because these analyses recognize that the processes that generate differences may be shared.
REFERENCES
ACKNOWLEDGMENTS
Dodds WK. 1997. Distribution of runoff and rivers related to vegetative characteristics, latitude, and slope: a global perspective. J North Am Benthol Soc 16:162–8.
T.E.E. was supported by a National Science Foundation graduate research traineeship ‘‘Integrating Stream and Lake Ecology.’’ We thank R. Naiman for encouraging and stimulating this project, and we thank Jim Elser and Nina Caraco for providing data on sestonic C:P for Peter Lake. We also thank C. Harvey, J. Houser, J. Klug, and T. Reed for helpful discussion, and S. Gergel, E. Stanley, N. Grimm, and four anonymous reviewers for comments on earlier drafts of this manuscript. This project was inspired by the workshop ‘‘Synthesis in Ecology—Applications, Opportunities, and Challenges’’ at the National Center for Ecological Analysis and Synthesis, Santa Barbara.
Andersen T. 1997. Pelagic nutrient cycles: herbivores as sources and sinks. Berlin: Springer-Verlag. 280 p. Andersson G, Grane´li W, Stenson J. 1988. The influence of animals on phosphorus cycling in lake ecosystems. Hydrobiologia 170:267–84. Baines SB, Pace ML. 1994. Relationships between suspended particulate matter, and sinking flux along a trophic gradient and implications for the fate of planktonic primary production. Can J Fish Aquat Sci 51:25–36. Barlow JP, Bishop JW. 1965. Phosphate regeneration by zooplankton in Cayuga Lake. Limnol Oceanogr 10 SupplR15–R24. Bloesch J, Stadelman P, Bu¨hrer H. 1977. Primary production, mineralization, and sedimentation in the euphotic zone of two Swiss lakes. Limnol Oceanogr 22:511–26. Bossard PU, Uehlinger U. 1993. The effect of herbivorous crustacean zooplankton on epilimnetic carbon and phosphorus cycling. Hydrobiologia 254:21–34. Caraco NF, Cole JJ, Likens GE. 1992. New and recycled primary production in an oligotrophic lake: insights for summer phosphorus dynamics. Limnol Oceanogr 37:590–602. Carpenter SR, Kitchell JF. 1993. The trophic cascade in lakes. Cambridge, UK: Cambridge University Press. Carpenter SR, Kitchell JF, Cottingham KL, Schindler DE, Christensen DL, Post DM, Voichick N. 1996. Chlorophyll variability, nutrient input, and grazing: evidence from whole-lake experiments. Ecology 77:725–35. Cole JJ, Pace ML. 1998. Hydrologic variability of small, northern Michigan lakes measured by the addition of tracers. Ecosystems 1:310–20. Cushing CE. 1997. Organic matter dynamics in Rattlesnake Springs, Washington, USA. In: Webster JR, Meyer JL, editors. Stream organic matter budgets. J North Am Benthol Soc 16:3–161. p 39–43. DeAngelis DL. 1992. Dynamics of nutrient cycling and food webs. London: Chapman and Hall. 270 p. DeAngelis DL, Bartell SM, Brenkert AL. 1989. Effects of nutrient recycling and food-chain length on resilience. Nature 134:778– 805. D’Angelo DJ, Webster JR. 1991. Phosphorus retention in streams draining pine and hardwood catchments in the southern Appalachian Mountains. Fresh Biol 26:335–45.
Elser JJ, Foster DK, Hecky RE. 1995. Effects of zooplankton on sedimentation in pelagic ecosystems: theory and test in two lakes of the Canadian shield. Biogeochemistry 30:143–70. Elser JJ, Dobberfuhl DR, Mackay NA, Schampel JH. 1996. Organism size, life history, and N:P stoichiometry. Bioscience 46:674–84. Elwood JW, Newbold JD, O’Neill RV, Van Winkle W. 1982. Resource spiralling: an operational paradigm for analyzing lotic ecosystems. In: Fontaine TD, Bartell SM, editors. Dynamics of lotic ecosystems. Ann Arbor, MI: Ann Arbor Science. p 3–27. Eppley RW, Peterson BJ. 1979. Particulate organic matter flux and planktonic new production in the deep ocean. Nature 282:677–80.
142
T. E. Essington and S. R. Carpenter
Fee EJ. 1979. A relation between lake morphometry and primary productivity and its use in interpreting whole-lake eutrophication experiments. Limnol Oceanogr 24:401–16. Fee EJ, Shearer JA, DeBruyn ER, Schindler EU. 1992. Effects of lake size on phytoplankton photosynthesis. Can J Fish Aquat Sci 49:2445–59. Fee EJ, Hecky RE, Regehr GW, Hendzel LL, Wilkinson P. 1994. Effects of lake size on nutrient availability in the mixed layer during summer stratification. Can J Fish Aquat Sci 51: 2756–68. Findlay S, Likens GE, Hedin L, Fisher SG, McDowell WH. 1997. Organic matter dynamics in Bear Brook, Hubbard Brook experimental forest, New Hampshire, USA. In: Webster JR, Meyer JL, editors. Stream organic matter budgets. J North Am Benthol Soc 16:3–161. p 43–6.
Jones JB, Schade JD, Fisher SG, Grimm NB. 1997. Organic matter dynamics in Sycamore Creek, a desert stream in Arizona, USA. In: Webster JR, Meyer JL, editors. Stream organic matter budgets. J North Am Benthol Soc 16:3–161. p 78–82. Kitchell JF, O’Neill RV, Webb D, Gallepp GW, Bartell SM, Koonce JF, Ausmus BS. 1979. Consumer regulation of nutrient cycling. Bioscience 29:28–34. Kraft CE. 1992. Estimates of phosphorus and nitrogen cycling by fish using a bioenergetics approach. Can J Fish Aquat Sci 49:2596–604. Lathrop RC, Carpenter SR, Stow CA, Soranno PA, Panuska JC. 1998. Phosphorus loading reductions needed to control bluegreen algal blooms in Lake Mendota. Can J Fish Aquat Sci 55:1169–78.
Finn JT. 1976. Measures of ecosystem structure and function derived from analysis of flows. J Theor Biol 56:363–80.
Lehman JT. 1980. Release and cycling of nutrients between planktonic algae and herbivores. Limnol Oceanogr 25:620–32.
Fisher SG. 1977. Organic matter processing by a stream-segment ecosystem: Fort River, Massachusetts, U.S.A. Int Revue ges Hydrobiol 62:701–27.
Lehman JT, Sandgren CD. 1985. Species-specific rates of growth and grazing loss among freshwater algae. Limnol Oceanogr 30:34–46.
Fisher SG, Grimm NB. 1991. Streams and disturbance: are cross-ecosystem comparisons useful? In: Cole JJ, Lovett G, Findlay S, editors. Comparative analyses of ecosystems: patterns, mechanisms, and theories. New York: Springer-Verlag. p 196–221.
Levine SN, Schindler DW. 1980. Radiochemical analysis of orthophosphate concentrations and seasonal changes in the flux of orthophosphate to seston in two Canadian shield lakes. Can J Fish Aquat Sci 37:479–87.
Fisher SG, Grimm NB, Martı´ E, Holmes RM, Jones JB. 1998. Material spiraling in stream corridors: a telescoping ecosystem model. Ecosystems 1:19–34. Frisk T, Niemi JS, Kinnunen KAI. 1980. Comparison of statistical phosphorus-retention models. Ecol Model 12:11–27. Forsberg BR. 1985. The fate of primary production. Limnol Oceanogr 30:807–19. Gray LJ. 1997. Organic matter dynamics in Kings Creek, Konza Prairie, Kansas, USA. In: Webster JR and Meyer JL, editors. Stream organic matter budgets. J North Am Benthol Soc 16:3–161. p 50–4. Grimm NB. 1987. Nitrogen dynamics during succession in a desert stream. Ecology 68:1157–70. Grimm NB. 1988. Role of macroinvertebrates in nitrogen dynamics of a desert stream. Ecology 69:1884–93. Hall RO, Peterson BJ, Meyer JL. 1998. Testing a nitrogen-cycling model of a forest stream by using a nitrogen-15 tracer addition. Ecosystems 1:283–98. Hama T, Matsunaga K, Handa N, Takahashi M. 1990. Nitrogen budget in the euphotic zone of Lake Biwa from spring to summer, 1986. J Plank Res 12:125–31.
Likens GE. 1998. Limitations to intellectual progress. In: Pace ML, Groffman P, editors. Successes, limitations, and frontiers in ecosystem science. New York: Springer-Verlag. p 247–71. Martı´ E, Sabater F. 1996. High variability in temporal and spatial nutrient retention in Mediterranean streams. Ecology 77: 854–69. Martı´ E, Grimm NB, Fisher SG. 1997. Pre- and post-flood retention efficiency of nitrogen in a Sonoran Desert stream. J North Am Benthol Soc 16:805–19. Marxsen J, Schmidt H, Fiebig DM. 1997. Organic matter dynamics in the Breitenbach, Germany. In: Webster JR, Meyer JL, editors. Stream organic matter budgets. J North Am Benthol Soc 16:3–161. p 28–32. McKnight DM, Tate CM. 1997. Canada stream: a glacial meltwater stream in Taylor Valley, South Victoria Land, Antarctica. In Webster JR, Meyer JL, editors. Stream organic matter budgets. J North Am Benthol Soc 16:3–161. p 14–7. McNaughton SJ, Coughenour MB, Wallace LL. 1988. Large mammals and process dynamics in African ecosystems. Bioscience 38:794–800. Meyer JL, Likens GE. 1979. Transport and transformation of phosphorus in a forest stream ecosystem. Ecology 60:1255–69.
Hart BT, Freeman P, McKelvie ID. 1992. Whole-stream phosphorus release studies: variation in uptake length with initial phosphorus concentration. Hydrobiologia 235:573–84.
Meyer JL, Likens GE, Sloane J. 1981. Phosphorus, nitrogen, and organic carbon flux in a headwater stream. Arch Hydrobiol 91:28–44.
Harvey CJ, Peterson BJ, Bowden WB, Deegan LA, Finlay JC, Hershey AE, Miller MC. 1997. Organic matter dynamics in the Kuparuk River, a tundra river in Alaska, USA. In Webster JR, Meyer JL, editors. Stream organic matter budgets. J North Am Benthol Soc 16:3–161. p 18–23.
Meyer JL, Benke AC, Edwards RT, Wallace JB. 1997. Organic matter dynamics in the Ogeechee River, a blackwater river in Georgia, USA. In: Webster JR and Meyer JL, editors. Stream organic matter budgets. J North Am Benthol Soc 16:3–161. p 82–7.
Houser JN. 1997. Food web structure and experimental enrichment: effects on phosphorus sedimentation and retention [thesis]. Madison: University of Wisconsin. 82 p.
Mulholland PJ. 1981. Organic carbon flow in a swamp-stream ecosystem. Ecol Monogr 51:307–22.
Howard-Williams C, Priscu JC, Vincent WF. 1989. Nitrogen dynamics in two Antarctic streams. Hydrobiologia 172:51–61. Irons JG, Oswood MW. 1997. Organic matter dynamics in 3 subarctic streams of interior Alaska, USA. In: Webster JR, Meyer JL, editors. Stream organic matter budgets. J North Am Benth Soc 16:3–161. p 23–7.
Mulholland PJ. 1997. Organic matter dynamics in the West Fork of Walker Branch, Tennessee, USA. In Webster JR, Meyer JL, editors. Stream organic matter budgets. J North Am Benthol Soc 16:3–161. p 61–7. Mulholland PJ, Newbold JD, Elwood JW, Ferren LA, Webster JR. 1985. Phosphorus spiraling in a woodland stream: seasonal variations. Ecology 66:1012–23.
Nutrient Cycling in Lakes and Stream
143
Mulholland PJ, Steinman AD, Elwood JW. 1990. Measurement of phosphorus uptake length in streams: comparison of radiotracer and stable PO4 releases. Can J Fish Aquat Sci 47:2351–7. Mulholland PJ, Steinman AD, Palumbo AV, Elwood JW, Kirschtel DB. 1991. Role of nutrient cycling and herbivory in regulating periphyton communities in laboratory streams. Ecology 72: 966–82.
Smock LA. 1997. Organic matter dynamics in Buzzards Branch, a blackwater stream in Virginia, USA. In: Webster JR, Meyer JL, editors. Stream organic matter budgets. J North Am Benthol Soc 16:3–161. p 54–58.
Mulholland PJ, Steinman AD, Marzolf ER, Hart DR, DeAngelis DL. 1994. Effect of periphyton biomass on hydraulic characteristics and nutrient cycling in streams. Oecologia 98:40–7.
Sterner RW. 1986. Herbivores’ direct and indirect effects on algal populations. Science 231:605–7.
Mulholland PJ, Marzolf ER, Webster JR, Hart DR, Hendricks SP. 1997. Evidence that hyporheic zones increase heterotrophic metabolism and phosphorus uptake in forest streams. Limnol Oceanogr 42:443–51. Munn NL, Meyer JL. 1990. Habitat-specific solute retention in two small streams: an intersite comparison. Ecology 71: 2069–82. Naiman RJ, Melillo JM. 1984. Nitrogen budget of a subarctic stream altered by beaver (Castor canadensis). Oecologia 62: 150–5. Newbold JD, Bott TL, Kaplan LA, Sweeney BW, Vannote RL. 1997. Organic matter dynamics in White Clay Creek, Pennsylvania, USA. In: Webster JR, Meyer JL, editors. Stream organic matter budgets. J North Am Benthol Soc 16:3–161. p 46–50. Newbold JD, Elwood JW, O’Neill RV, Van Winkle W. 1981. Measuring nutrient spiraling in streams. Can J Fish Aquat Sci 38:860–3. Newbold JD, O’Neill RV, Elwood JW, Van Winkle W. 1982. Nutrient spiralling in streams: implications for nutrient limitation and invertebrate activity. Am Nat 120:628–52. Newbold JD, Elwood JW, O’Neill RV, Sheldon AL. 1983. Phosphorus dynamics in a woodland stream ecosystem: a study of nutrient spiraling. Ecology 64:1249–65. Pace ML. 1991. Concluding remarks. In: Cole JJ, Lovett G, Findlay S, editors. Comparative analyses of ecosystems: patterns, mechanisms, and theories. New York: Springer-Verlag. p 361–8. Paul BJ, Duthie HC. 1989. Nutrient cycling in the epilithon of running waters. Can J Bot 67:2302–9. Peterson BJ, Hobbie JE, Corliss TL. 1986. Carbon flow in a tundra stream ecosystem. Can J Fish Aquat Sci 43:1259–70. Peterson BJ, Corliss T, Kriet K, Hobbie JE. 1992. Nitrogen and phosphorus concentrations and export for the upper Kuparuk River on the North Slope of Alaska in 1980. Hydrobiologia 240:61–9. Poister D, Armstrong DE, Hurley JP. 1994. A 6-yr record of nutrient element sedimentation and recycling in three north temperate lakes. Can J Fish Aquat Sci 51:2457–66. Richey JE, Wissmar AH, Likens GE, Eaton JS, Wetzel RG, Odum WE, Johnson NM, Loucks OL, Prentki RT, Rich PH. 1978. Carbon flow in four lake ecosystems: a structural approach. Science 202:1183–5. Schindler DE 1992. Nutrient regeneration by sockeye salmon (Oncorhynchus nerka) fry and subsequent effects on zooplankton and phytoplankton. Can J Fish Aquat Sci 49:2498–506. Schindler DE, Kitchell JF, He X, Carpenter SR, Hodgson JR, Cottingham KL. 1993. Food web structure and phosphorous cycling in lakes. Trans Am Fish Soc 122:756–72. Smith SV, Srruya S, Geifman Y, Berman T. 1989. Internal sources and sinks of water, P, N, Ca, and Cl in Lake Kinneret, Israel. Limnol Oceanogr 34:1202–13.
Steinman AD, Mulholland PH, Beauchamp JJ. 1995. Effects of biomass, light, and grazing on phosphorus cycling in stream periphyton communities. J North Am Benthol Soc 14:371–81.
Sterner RW, Chrzanowski TH, Elser JJ, George NB. 1995. Sources of nitrogen and phosphorus supporting the growth of bacterioand phytoplankton in an oligotrophic Canadian shield lake. Limnol Oceaongr 40:242–9. Sterner RW, Elser JJ, Fee EJ Guildford SJ, Chrzanowski TH. 1997. The light: nutrient ratio in lakes: the balance of energy and materials affects ecosystem structure and process. Am Nat 150:663–84. Stream Solute Workshop. 1990. Concepts and methods for assessing solute dynamics in stream ecosystems. J North Am Benthol Soc 9:95–119. Treadwell SA, Campbell IC, Edwards RT. 1997. Organic matter dynamics in Keppel Creek, southeastern Australia. In: Webster JR, Meyer JL, editors. Stream organic matter budgets. J North Am Benthol Soc 16:3–161. p 58–61. Tripathi SK, Singh KP. 1994. Productivity and nutrient cycling in recently harvested and mature bamboo savannas in the dry tropics. J Appl Ecol 31:109–24. Triska FJ, Sedell JR, Cromach K, Gregory SV, McCorison FJ. 1984. Nitrogen budget for a small coniferous forest stream. Ecol Monogr 54:119–40. Urabe J, Nakanishi M, Kawabata K. 1995. Contribution of metazoan plankton to the cycling of nitrogen and phosphorus in Lake Biwa. Limnol Oceanogr 40:232–41. Vanni MJ. 1996. Nutrient transport and recycling by consumers in lake food webs: implications for algal communities. In: Winemiller KO, Polis GA, editors. Food webs: integration of patterns and dynamics. New York: Chapman and Hall. p 96–108. Vitousek PM, Sanford RL. 1986. Nutrient cycling in moist tropical forest. Ann Rev Ecol Syst 17:137–67. Wagener SM, Oswood MW, Schimel JP. 1998. Rivers and soils: parallels in carbon and nutrient processing. Bioscience 48:104– 108. Wallace JB, Webster JR, Cuffney TF. 1982. Stream detritus dynamics: regulation by invertebrate consumers. Oecologia 53:197–200. Wallace JB, Cuffney TF, Eggert SL, Whiles MR. 1997. Stream organic matter inputs, storage, and export for Satellite Branch at Coweeta Hydrologic Laboratory, North Carolina, USA. In: Webster JR, Meyer JL, editors. Stream organic matter budgets. J North Am Benthol Soc 16:3–161. p 67–74. Webster JR, Meyer JL, editors. 1997. Stream organic matter budgets. J North Am Benthol Soc 16:3–161. Webster JR, Patten BC. 1979. Effects of watershed perturbation on stream potassium and calcium dynamics. Ecol Mongr 19:51–72. Webster JR, Meyer JL, Wallace JB, Benfield EF. 1997. Organic matter dynamics in Hugh White Creek, Coweeta Hydrologic Laboratory, North Carolina, USA. Webster JR Meyer JL, editors. Stream organic matter budgets. J. North Am. Benthol. Soc. 16:74–8.