ECOSYSTEMS
Ecosystems (1999) 2: 367–382
r 1999 Springer-Verlag
Effects of Plant Growth Characteristics on Biogeochemistry and Community Composition in a Changing Climate Darrell A. Herbert,1* Edward B. Rastetter,1 Gaius R. Shaver,1 ˚ gren2 and Go¨ran I. A 1The
Ecosystems Center, Marine Biological Laboratory, Woods Hole, Massachusetts 02543, USA; and 2Department of Ecology and Environmental Research, Swedish University of Agricultural Sciences, Box 7072, S-750 07 Uppsala, Sweden
ABSTRACT Vegetation growth characteristics influence ecosystem biogeochemistry and must be incorporated in models used to project biogeochemical responses to climate variations. We used a multiple-element limitation model (MEL) to examine how variations in nutrient use efficiency (NUE) and net primary production to biomass ratio (nPBR) affect changes in ecosystem C stocks after an increase in temperature and atmospheric CO2. nPBR influences the initial rates of response, but the magnitude and direction of long-term responses are determined by NUE. MEL was used to simulate responses to climate change in communities composed of two species differing in nPBR and/or NUE. When only nPBR differed between the species, the high-nPBR species outgrew the low-nPBR species early in the simulations, but the shift in dominance was transitory because of secondary N limitations. High-NUE species were less affected by secondary N limitations
and were therefore favored under elevated CO2. Increased temperature stimulated N release from soil organic matter (SOM) and therefore favored low-NUE species. The combined release from C and N limitation under the combination of increased temperature and elevated CO2 favored high-NUE species. High C:N litter from high-NUE species limited the N-supply rate from SOM, which favors the dominance of the high-NUE species in the short term. However, in the long term increased litter production resulted in SOM accumulation, which reestablished a N supply rate favorable to the reestablishment and dominance of the low-NUE species. Conditions then reverted to a state favorable to the high-NUE species.
INTRODUCTION
mentally demonstrated that the species composing the arctic tussock tundra respond sensitively to nutrients, temperature, and light. They hypothesized that the variable success of the different growth forms was because of differences in relative growth rate (RGR), nutrient requirements and nutrient use efficiency (NUE), and morphological characteristics allowing one species to shade another. Nutrient fertilizations elsewhere have demonstrated similar shifts in species richness and community
Key words: multiple-element limitation (MEL); biogeochemical model; climate change; plant competition; carbon–nitrogen interactions; nutrient use efficiency; relative growth rate; temperature; CO2.
Plant growth characteristics influence changes in community composition arising from disturbance, changes in resource availability, or an otherwise changing environment. Shaver and Chapin (1980)and Chapin and Shaver (1985, 1996) experiReceived 8 October 1998; accepted 9 April 1999. *Corresponding author. e-mail:
[email protected]
367
368
D. A. Herbert and others
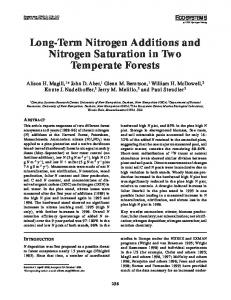
composition (Chapin and others 1995; Shaver and others 1998, the direction of which often has been linked to growth characteristics (Raynal and Bazzaz 1975; Tilman 1987; Hooper and Vitousek 1997). A changing global climate could similarly affect plant communities (Shaver and others 1992; Hobbie 1996). For example, if increasing atmospheric CO2 results in increased plant productivity (Bazzaz 1990), then an increase in nutrient requirements could impose a limitation on the system as a whole that favors species that are efficient in nutrient use or effective in nutrient acquisition (Chapin 1980; Bloom and others 1985; Chapin and others 1987). A consequent change in plant community composition could affect C and nutrient storage in vegetation, the C: nutrient ratio (C:N) of litter, and rates of litter production. Altered composite litter quality and production rates would in turn affect storage and cycling of C and nutrients in soil (Taylor and others 1989; Chapin 1992; Hobbie 1996), which could produce further feedbacks on nutrient avail˚ gren and othability and vegetation productivity (A ers 1992; Tateno and Chapin 1997). Because of the relationships among plant growth characteristics, litter chemistry, and soil organic matter turnover, shifts in community composition clearly have the potential to modify ecosystem biogeochemistry and function. Therefore, if species effects and interactions are not incorporated into biogeochemical models, predictions of ecosystem response to climate change will be of limited value. The purpose of this article is to examine the role that NUE and RGR play in determining shifts in community composition after an increase in CO2 and temperature and to examine the importance of these shifts on overall ecosystem biogeochemistry, including changes in ecosystem C storage. We recognize that morphology, phenology, and allometry are also important in predicting potential community shifts, but these confounding factors are beyond the scope of the present analysis. Berendse and Aerts (1987) define NUE as NPP divided by the nutrient uptake rate. NUE can be expressed as the product of nutrient productivity (A ⫽ NPP per unit plant nutrient) and the mean nutrient retention time (MRT ⫽ plant nutrient divided by nutrient uptake rate; Figure 1). At steady state, NUE equals the litter nutrient concentration (Hirose 1975; Vitousek 1982, 1984; Berendse and Aerts 1987; Aerts 1996; Killingbeck 1996). Plants with a high NUE have a relatively low requirement for nutrient uptake from the environment, a characteristic that may impart a competitive advantage when nutrients are limiting.
Figure 1. NUE response surface illustrates relationships between N productivity (A) and mean N retention time (MRT) and the influence of nPBR. Shaded symbols represent five of the dominant (by mass) species from the tussock vegetation at Toolik Lake. Aggregate vegetation represents A and MRT for a composite of all species weighted by their mass representation at Toolik Lake. Numbered symbols indicate pretreatment steady state values in parameterizations for NUE and nPBR sensitivity analyses, and numbers correspond to species numeration in Table 1.
Strictly defined, RGR is the biomass increment per unit standing biomass per unit time and represents only a portion of NPP; the remainder of the NPP is expended on replacing biomass lost as litter or through grazing. Because RGR is by definition zero at steady state and because we initiate our simulations at steady state, our analyses will involve a comparison of species differing in their initial net production to biomass ratio (nPBR ⫽ NPP per unit biomass). However, these differences in nPBR in our model have a roughly proportional effect on RGR during non–steady state conditions. To support high nPBR, plants must have high rates of resource capture from the environment, that is, a high capacity for photosynthesis and nutrient uptake per unit tissue mass (Chapin 1980, 1992). A plant with high nPBR may have a competitive advantage over slower growing plants if soil nutrients are readily available, and the advantage may be especially evident if the canopy is not closed, that is, light is not a limiting factor.
Modeled Plant Growth and Biogeochemistry
369
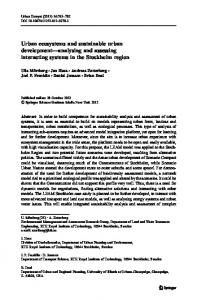
Figure 2. The multi-element limitation (MEL) model applied to C and N cycles in a terrestrial ecosystem. As presented, the C and N in biomass (BC and BN) and the effort expended toward the uptake of C and N (VC and VN) are represented for multiple species. The elements are cycled among vegetation, soil organic matter (SOM), and inorganic pools and are linked through the vegetation and microbial processes. Solid arrows indicate material fluxes, and dotted arrows indicate the transfer of information used to calculate those fluxes.
THE MULTIPLE-ELEMENT LIMITATION MODEL Our analysis is based on the multiple-element limitation (MEL) model, which is fully described in Rastetter and others (1997) (APPENDIX A and Figure 2). A major feature of this model is that vegetation is continuously adjusting uptake effort, as represented by the variables VC and VN (APPENDIX A), to maintain a nutritional balance between C and N in plant tissues (Mooney 1972; Bloom and others 1985; Chapin and others 1987; Ericsson and Ingestad 1988; Ingestad and McDonald 1989; Bazzaz 1990; Field and others 1992, 1995; Wikstro¨m and Ericsson 1995). Similarly, soil microorganisms are assumed to maintain their own nutritional balance by adjusting their retention efficiencies for C and N and the rate of N immobilization. These compensatory activities of plants and soil microorganisms to maintain their C:N balance serve to couple the two element cycles to one another. The model is designed explicitly to examine the constraints imposed by this coupling on C and N storage and cycling rates. As with the vegetation, the soil is represented in a highly aggregated form. The gain in clarity associated with this simplification comes at the cost of a loss in detail concerning the dynamics of multiple organic matter classes. As with earlier versions of the model, our intent is to ‘‘emphasize ... general pattern..., remove ... extraneous noise associated with unwarranted detail, and to enhance ... interpretability by reducing the complexity of the model as much as possible’’ (Rastetter and Shaver 1992). The model recently has been modified to
examine the interactions among individual species or functional groups competing for light and nutrients (Figure 1 and APPENDIX A). The equation used to estimate the allometry of tissues active in C and N uptake [see Eq. (8) in APPENDIX A] has been modified from the one used by Rastetter and others (1997). This allometric equation is intended to represent standlevel changes in the total resource-acquiring tissues of a species as the biomass for all species changes (for example, the allometric changes associated with canopy closure). The new equation can represent a broader range of allometric patterns and accounts for the effects of inter- and intraspecific competition on these allometric patterns [see Eq. (8) in APPENDIX A]. A major logical constraint on the form of the allometric equation [see Eq. (8) in APPENDIX A] can be understood by considering a monospecific stand with C-biomass BCT and active-tissue biomass BAT. If the individuals in the stand are arbitrarily assigned to n groups, then the stand can be thought of as consisting of n identical species. Because no actual changes have been made to the allometry of the stand, Eq. (8) in APPENDIX A must apply equally well to the monospecific representation (that is, n ⫽ 1) and to the distributed representation (that is, n ⬎ 1). Thus, the total active tissue in the stand in the monospecific representation must equal the sum of the active tissues of the individual species in the n BAj). To be distributed representation (i.e.,BAT ⫽ 兺j⫽1 logically consistent with a stand-level description of allometry, this constraint must hold true no matter how the biomass is distributed among the species and no matter what the total biomass of the stand is. For our formulation, this constraint implies that for
370
D. A. Herbert and others
a stand of n identical species, n
BA maxcTT
兺B
Cj
n
j⫽1
⫽
n
BA maxT ⫹ cTT
兺B j⫽1
兺 i⫽1
Cj
BA maxiciiBCi n
BA maxi ⫹
,
兺cB
ji Cj
j⫽1
where BAmaxT and cTT are the stand-level analogues to the species parameters BAmaxi and cii. This condition is met if BAmaxT ⫽ BAmaxi, cTT ⫽ cii, and cji ⫽ cii for all i and j, which will be true if the species are identical. The optimum element ratio (qi) is now calculated to be consistent with the allometric changes in the vegetation [see Eq. (9) in APPENDIX A]. Specifically, qi is calculated by assuming that the active tissues represented by BAi have a fixed element ratio (qmini) and that the remaining tissues (that is, wood) have a second fixed element ratio (qmaxi). This new formulation also insures that the optimum element ratio in vegetation never falls below qmini; in the original equation, qmin effectively equaled zero (Rastetter and others 1997). Respiration and the litter losses of C and N also are calculated to be consistent with the change in allometry [see Eqs. (14) to (16) in APPENDIX A]. Active and woody tissues each have their own rate of respiration (rAi and rWi), their own rate of litter production (mAi and mWi), and their own nominal litter C:N ratio (qAi and qWi). The actual C:N ratio of the litter varies from these nominal values in proportion to the deviation of the species from its overall optimum C:N ratio [see Eq. (15) in APPENDIX A]. Both the photosynthetic and N-uptake equations have been modified to account for inter- and intraspecific competition for resources [see Eqs. (12) and (13) in APPENDIX A]. The derivations of these equations are based on a probabilistic representation of resource acquisition analogous to that used in the derivation of the Beer-Lambert Law (Monsi and Saeki 1953). Thus, the rates of photosynthesis and N uptake are proportional to the fraction of available light intercepted by the whole canopy and the fraction of soil volume exploited by all the roots, respectively. As leaves fill the canopy or fine roots fill the soil volume, there is a diminishing return on the increase in uptake per unit leaf or root added. The extinction coefficient for light interception used in the model (kI) is the same as the Beer-Lambert extinction coefficient. The analogous coefficient for soil exploitation (kS) is calculated as the effective crosssectional area of influence around each fine root divided by the soil depth. Thus, the product of kS and the total root length per unit area (SNT) is the ratio of soil volume that could be exploited if there were no interference among roots to the actual soil volume.
The fraction of light intercepted or soil volume exploited is partitioned among the n species based on a canopy- or soil-dominance parameter for each species (fCi and fNi, respectively). The function for this partitioning was derived from the following logic: If the canopy of species i is entirely above the canopies of the other species, then the light absorbed by species i would be (1 ⫺ e⫺kISCi ). If the canopy of species i is entirely below the canopies of the other species, then the light absorbed by species i would be n e⫺kISCj . (1 ⫺ e⫺kISCi )e⫺kI (SCT⫺SCi )⫽[(1⫺e⫺kISCi) ⁄ e⫺kISC i ]兿j⫽1 The formulation in Eq. (12a) (see APPENDIX A) allows a partitioning of light between these two extremes with the relative dominance of species i being evaluated against each of the other species individually. Thus, if fCi : fCj, then species i will overtop species j, and if fCj : fCi, then species j will overtop species i. However, because the formulation in Eq. (12a) only accounts for pairwise interactions, it overcompensates for light absorption in intermingled canopies (for example, it corrects for photons absorbed by species j even though they already were absorbed by species k). The reduced form of the model does not justify the additional complexity needed to account for these higher-order interactions. We compensate by assuming that the light absorbed by each species is proportional to wCi, but this value is normalized by dividing by the sum of the wCj over all species and multiplying by the total light absorbed by all species [Eq. (12b)]. The equations for root competition are derived in an analogous way, but of course interpretation of the interactions is very different. An important process not currently in the MEL model is N fixation. The only way that the overall N capital of the ecosystem can change in this model is if the inorganic N losses change relative to the rate of N deposition. At steady state these losses equal the N deposition rate, but Rastetter and others (1997) have demonstrated the effects that changes in plant and soil demands on available N can have on the N loss rate and the consequent long-term changes in ecosystem N capital.
PARAMETERIZATION The model was parameterized to represent C and N pools and fluxes in tussock tundra vegetation at the Toolik Lake Arctic long-term ecological research site in Alaska (68°38’ N, 149°34’ W, elevation 760 m). Complete site descriptions have been published elsewhere (Shaver and Chapin 1991, McKane and others 1997). The tussock vegetation at Toolik Lake is composed primarily of sedges and dwarf deciduous and evergreen shrubs. The dominant species by mass are Betula nana, Ledum palustre, Eriophorum vaginatum, Vaccinium vitis-idaea, and Carex bigelowii (Shaver and Chapin 1991). Specific values for C and
Modeled Plant Growth and Biogeochemistry
371
Table 1. Parameter Values and Initial Values for VC and VN for Aggregate Vegetation and Individual Species Having Variations in nPBR and NUE Species
Description
nPBR
gC
gN
mA ⫽ rA
m W ⫽ rW
NUE
qA
qW
VC ⫽ 1 ⫺ VN
⫺ 1 2 3 4 5 6 7 8
Baseline ⫹nPBR ⫺nPBR ⫹NUE ⫺NUE ⫺nPBR ⫹ NUE ⫹nPBR ⫺ NUE ⫺nPBR ⫺ NUE ⫹nPBR ⫹ NUE
0.234 0.468 0.117 0.234 0.234 0.117 0.468 0.117 0.468
114 229 57.2 99.3 137 49.7 274 68.5 199
53.5 107 26.7 51.0 59.5 25.5 119 29.7 102
0.454 0.909 0.227 0.454 0.454 0.227 0.909 0.227 0.909
0.111 0.223 0.0557 0.111 0.111 0.0557 0.223 0.0557 0.223
57.7 57.7 57.7 69.3 46.2 69.3 46.2 46.2 69.3
53.3 53.3 53.3 64.0 42.6 64.0 42.6 42.6 64.0
71.2 71.2 71.2 85.5 57.0 85.5 57.0 57.0 85.5
0.414 0.414 0.414 0.497 0.331 0.497 0.331 0.331 0.497
0.00917 0.0183 0.00459 0.00908 0.00932 0.00454 0.0186 0.00466 0.0182
7.20 7.20 7.20 6.68 8.08 6.68 8.08 8.08 6.68
nPBR was adjusted by changing mA and mW . The values of rA and rW were set equal to mA and mW to maintain an initial ratio of GPP:NPP of 2:1. NUE was adjusted by changing qA , qW , and VC . For both nPBR and NUE adjustments, gC , gN , , and were recalculated to assure a steady state at the initial values for C and N in vegetation and soil.
N pools and fluxes represented by individual species, aggregate vegetation, and soil organic matter including litter (SOM) are detailed along with all parameter values in APPENDIX B. Differences in NUE among species at Toolik Lake are relatively small (45.6–64.2) with no clear distinction between shrubs and sedges (Figure 1). Because differences in nPBR, A, and MRT are large, sedges have both high A and short MRT relative to shrubs, and MRT in evergreen shrubs is generally longer than in deciduous shrubs (but see L. palustre, Figure 1).
Baseline Simulations A baseline, aggregate vegetation was parameterized using the sum of C and N stocks and fluxes for the five dominant species described in APPENDIX B. This baseline vegetation was parameterized so that a greater proportion of internal resources were allocated to N uptake (VN ⫽ 0.586) relative to C uptake (VC ⫽ 0.414), reflecting relationships between fine root surface and leaf area and to match the responses to fertilization experiments at Toolik Lake (Chapin and others 1995). The responsiveness of vegetation to changes in essential element supply was adjusted (kC and kN) so that a doubling of ambient CO2 produced an instantaneous 33% increase in gross primary production (GPP) (McMurtrie and Wang 1993) and a doubling of the soil inorganic N pool produced an instantaneous 70% increase in N uptake (Rastetter and others 1997). After all other parameters and variables were set, we set rA ⫽ mA and rW ⫽ mW so that the initial GPP was twice NPP and the values of gC, gN, qmin, , and were adjusted so that the system was at an initial steady state.
Changes in NUE and RGR Our intent is to analyze the importance of NUE and RGR on changes in community composition and the consequent changes in C and N storage and cycling
in the ecosystem. Because initial conditions are assumed to be at steady state, NUE is equal to litter C:N and is set in the model by adjusting qA and qW, the C:N ratios of active and woody tissues, respectively. In addition, to reflect a higher N-uptake effort in low-NUE species, we varied the initial value of VC (⫽ 1 - VN) in proportion to the changes in qA and qW. Because RGR is by definition zero at steady state, its value can not be set directly under the initial conditions. However, nPBR can be set by adjusting the values of mA and mW, the relative turnover rates of active and woody tissues, respectively. This adjustment in nPBR has a roughly proportional effect on RGR under non–steady state conditions. After these adjustments to set NUE and nPBR, we reset rA ⫽ mA and rW ⫽ mW so that the initial GPP was again twice NPP, and we readjusted the values of gC, gN, , and so that C and N pools in vegetation and soil were in the same steady state as in the baseline simulations (no readjustment of qmin was necessary because the allometry and biomass of the vegetation was unchanged). Because of this imposed steady state at the baseline C and N values, the turnover of C and N in soil changed to conform with the turnover in vegetation. We examined eight parameterizations selected to encompass the range of N turnover and NUE found among the species at Toolik Lake (Table 1 and Figure 1).
Two-Species Communities Changes in resource availability with climate change may cause species dominance shifts related to species growth characteristics. Such shifts can alter litter quality and litter production with consequent feedbacks on element cycling. The importance of nPBR and NUE were examined in the context of four simple two-species communities. Species parameters in communities were identical to those in the baseline aggregate vegetation (APPENDIX B) ex-
372
D. A. Herbert and others
Table 2. Parameter Values Used in Two-Species Community Combinations Species (SpA/SpB)
Description
gC (SpA/SpB)
gN (SpA/SpB)
1/2 3/4 5/6 7/8
⫹nPBR vs ⫺nPBR ⫹NUE vs ⫺NUE ⫹nPBR ⫺NUE vs ⫺nPBR ⫹NUE ⫹nPBR ⫹NUE vs ⫺nPBR ⫺NUE
229/57.2 95.4/51.8 47.7/285 71.3/191
107/26.7 51.8/58.6 25.9/117 29.3/104
0.0115 0.0092 0.0116 0.0114
7.20 7.34 7.77 6.93
Other species parameters are as specified in Table 2.
cept that total plant C and N pools were split evenly between two species. Initial NUE, nPRB, or both were adjusted up for one species and down for the other relative to the baseline vegetation (Table 2). As in the aggregate–vegetation parameterizations, we reset rA ⫽ mA and rW ⫽ mW for each species, and we readjusted the values of gC and gN for each species and and so that vegetation and soil C and N were in steady state.
CLIMATE CHANGE SIMULATIONS Simulations assumed constant conditions other than the changes in CO2 and temperature and no seasonal cycles. Three different climate change simulations were applied: (a) a doubling of atmospheric CO2; (b) a 5°C increase in temperature; and (c) a combined doubling of CO2 with increased temperature. In all cases climate changes were applied instantaneously at year 1 of the simulation. Elevated temperature simulations involved increased rates of physiological activity in plants and microorganisms. These comparisons were achieved by raising the rate constants for plant respiration (rAi and rWi) and N uptake by vegetation (gNi) by a factor of 1.414 (Q10 ⫽ 2) and the rate constant for photosynthesis (gCi) by a factor of 1.225 (Q10 ⫽ 1.5). Temperature effects on microbial processes were simulated by increasing the decomposition rate constant () by 1.414 (Q10 ⫽ 2). With temperature increases, a greater fraction of substrate C is respired by microbes (decreased C efficiency), and residues are therefore expected to have a lower C:N ratio. The reduction in microbial C efficiency was simulated with a 5% decrease in the C:N ratio of microbial byproducts (). The adjustments to microbial processes function to increase respiration rates, thereby producing an increased rate of C loss from SOM and an increased rate of net N mineralization. All other parameters and the rate of N deposition (RNe) were held constant, and no soil moisture effects were inferred. Thus, we ignored secondary effects of the warming, such as increased evapotranspiration, which might reduce soil moisture, thereby changing both microbial activity and plant productivity.
ANALYSES Climate change simulations were run to steady state, but our analyses focus on the first 300 y. In the sensitivity analysis for aggregate vegetation, the effects of nPBR and NUE on relative changes in magnitude of plant and soil C stocks were compared with those changes in the baseline vegetation. Relative changes in the N uptake rate by plants were similarly compared. In the two-species communities, changes in individual species C stocks and N uptake rates were plotted in addition to those variables listed above. Because changes in C stocks in N limited systems are constrained by characteristics of the N cycle (Shaver and others 1992; McKane and others 1997), changes in the amount and distribution of N associated with the predicted changes in ecosystem C storage were examined. In N limited systems, C storage can only increase if there is (a) an increase in ecosystem N; (b) a change in the C:N ratio of ecosystem components; or (c) if N is redistributed from components with low C:N ratios to components with high C:N ratios (Schimel 1990; Rastetter and others 1992; Shaver and others 1992; McKane and others 1995). Rastetter and others (1992) derived the following equations from which changes in ecosystem C storage associated with the three factors listed above (plus their interactions) can be calculated: ⌬C⌬N ⫽ ⌬N qT(0) ,
(1)
where ⌬C⌬N is the change in ecosystem C associated with the change in the amount of N in the ecosystem, ⌬N is the change in the amount of ecosystem N, qT(0) is the initial ecosystem C:N ratio. ⌬CqB ⫽ BN(0) ⌬qB ,
(2a)
⌬CqD ⫽ DN(0) ⌬qD ,
(2b)
where ⌬CqB and ⌬CqD are the change in ecosystem C associated with a change in vegetation and SOM C:N ratios, respectively, BN(0) and DN(0) are the initial C and N stocks in vegetation and SOM, and ⌬qB and ⌬qD are the
Modeled Plant Growth and Biogeochemistry change in C:N ratios of vegetation and SOM. ⌬CN redis ⫽(⌬qB(0) ⫺⌬qD(0)) (⌬BN DN(0) ⫺⌬DN BN(0) ) / N(0) ,
(3)
where ⌬CN redis is the change in ecosystem C associated with redistribution of N between SOM and vegetation, ⌬BN and ⌬DN are the changes in vegetation and SOM N stocks, and N(0) is the initial amount of N in the ecosystem. ⌬Cinteraction ⫽ BN ⌬qB ⫹ DN ⌬qD ,
(4)
where ⌬Cinteraction is the change in ecosystem C associated with the interaction of all three factors. The sum of Eqs. (1) to (4) account for the total change in ecosystem C stocks. A more detailed description of the analysis and its derivation can be found elsewhere (Rastetter and others 1992; McKane and others 1995, 1997).
RESULTS Baseline Simulations In the baseline simulations, the only direct effect of increased CO2 is to increase GPP. As a consequence of this increase, C initially accumulates in vegetation without a commensurate accumulation in N. The C:N ratio of the vegetation therefore rises, and effort is reallocated toward N uptake and away from GPP. However, no matter how much effort is reallocated toward N uptake, the uptake rate never can be maintained above the rate that N is supplied to the available pool from mineralization of organic N and by N deposition. The increase in N uptake rate is therefore small (Figure 3). N limitation is further exacerbated by an increase in the amount and C:N ratio of litter, which increases the N immobilization into soil organic matter. In the long term, C accumulates in the ecosystem but primarily in soil with an increased C:N ratio (Figures 3 and 4). The direct effect of temperature in the simulations is to stimulate all metabolic processes. In the vegetation, the direct effect of the 5°C increase in temperature is a 41.4% increase in N uptake (Figure 3), but, because of the opposing effects on GPP and respiration, NPP is stimulated by only 3.6%. Thus, C:N ratio of vegetation decreases and effort is reallocated toward GPP and away from N uptake. Unlike available N, CO2 cannot be depleted by this increase in uptake effort, and the vegetation is able to capitalize on its investment by increasing biomass substantially (Figure 3). However, the increase in litter associated with this higher biomass is not enough to compensate for losses from soil organic matter. In the soil, the temperature-induced increase in metabolism and decrease in microbial efficiency result in an initial 42.3% increase in soil respiration and an
373
initial increase in net N mineralization of only 21.7%. In the long term, the ecosystem loses C because of the losses of C from soil, but these losses are compensated partly by increased biomass in vegetation associated with a net movement of N from soil to vegetation and the accumulation of plant tissues with a high C:N ratio (Figures 3 and 4). When both CO2 and temperature are increased, the vegetation is simultaneously released from limitation by both resources. Because of this dual release from limitation, the vegetation is able to distribute uptake effort more effectively, and the increase in biomass is slightly greater than the sum of the increases under CO2 and temperature alone (Figure 3). The increased plant productivity and the resulting increase in litter is enough to reverse initial losses of soil C; the gain in soil C after 300 y is substantially greater than the gains under elevated CO2 alone minus the losses under increased temperature. In the long term, the ecosystem gains C mostly through a gain in soil organic matter with a high C:N ratio and partly through an increase in plant biomass associated with a net movement of N from soil to vegetation (Figures 3 and 4).
Effects of nPBR and NUE The effect of a high nPBR on the initial conditions of the simulations is to increase the cycling rates of C and N through the ecosystem, but with no change in the standing stock of C and N in either vegetation or soils. Because of this effect on cycling rates, high nPBR accelerates the responses to changes in CO2 and temperature, and low nPBR slows those responses (Figure 3A). After the initial responses to the direct effects of CO2 and temperature, the ecosystem undergoes the same dynamics as in the baseline simulations, but these dynamics are accelerated or slowed by higher or lower nPBR, respectively. In the long term (more than 300 y), nPBR makes no difference to changes in C and N storage or in the relative changes in process rates. The major effect of a high NUE in the simulations is to decrease the degree of N limitation on the vegetation. Thus, when CO2 concentration is increased high-NUE vegetation can respond strongly (Figure 3B). On the other hand, the major effect of increased temperature is to increase the N cycling rate, which releases the vegetation from N limitation. Therefore, the more N-limited, low-NUE vegetation responds more strongly to increased temperature than the high-NUE vegetation. These responses of the vegetation are transferred to soil organic matter through the litter. Thus, the high-NUE system stored more C in soil than the low-NUE system under elevated CO2 and lost more soil C under increased temperature. Because the response to elevated CO2 alone is strongly
374
D. A. Herbert and others
Figure 3. Change of vegetation and SOM C stocks and N uptake by plants in aggregate–vegetation simulations. (A) nPBR sensitivity, (B) NUE sensitivity, (C) species that trade high NUE for low nPBR and vice versa, (D) species with both high NUE and nPBR or low NUE and nPBR. Values are relative to initial conditions
constrained by N limitation, the response to CO2 is amplified when it is accompanied by a temperatureinduced increase in N supply. Thus, when both CO2 and temperature are increased in the NUE simulations, the deviations from the baseline simulation are dominated by the response to CO2. Despite the major effects of NUE on vegetation processes, it had little effect on the
amount of N redistributed from soil to vegetation or on changes in plant C:N ratio (Figure 4). Most of the change in the ecosystem C capital resulted from a change in soil C:N ratio. When both the nPBR and NUE characteristics of the ecosystems are changed in the simulations, the cumulative effect is nearly additive (Figures 3C and
Modeled Plant Growth and Biogeochemistry
375
Competition between species differing in NUE led to increased mass and long-term dominance of the species maintaining the best balance between N uptake and GPP whereas the other species was displaced (Figure 5B). The shift was toward highNUE species in elevated CO2 simulations and toward low-NUE species when warming alleviated the effects of N limitation. Shifts in vegetation NUE changed the C:N ratio of the composite litter, affecting SOM. A shift toward the high-NUE species increased SOM C:N, thereby increasing soil C storage, whereas the opposite was true if the shift was toward the low-NUE species. In the latter case, SOC losses were large enough to produce an overall 3%–18% decrease in ecosystem C in spite of a substantial vegetation C increase (Figure 6). When both growth characteristics were combined, early competitive success was governed by the effects of nPBR, but NUE determined the longterm trends. A trade-off of high NUE for low nPBR was advantageous in elevated CO2, but soil C storage declined because of decreased litter production (Figure 5C). Similarly, a warming-induced shift toward low-NUE, low-nPBR species with low litter C:N led to large C losses from SOM, even though there was a sevenfold increase in plant biomass (Figure 5D). Figure 4. Predicted changes in ecosystem C partitioned by N source in aggregate–vegetation simulations. Only baseline and high- and low-NUE simulations are shown because differences in the relative amount of C stored were controlled by NUE, although vegetation nPBR affected time scales of change. The interaction term is not included because it is very small in all cases. Values are relative to initial conditions.
3D). That is, the deviations from the baseline in the combined simulations are about equal to the sum of the deviations in the simulations for each factor alone. Because there is no long-term difference between high- and low-nPBR systems, the longterm effects in the combined simulations are dominated by differences in NUE.
Carbon Gains and Losses in Two-Species Communities High-nPBR species had a response rate advantage in elevated CO2 simulations, but secondary element limitations eliminated any long-term advantage (Figure 5A). Release from N limitation by soil warming allowed for a longer-term advantage, but at steady state differences in C storage were negligible. Litter production per unit biomass increased as species abundance shifted toward the high-nPBR species, and that led to both smaller losses and larger gains in SOC relative to baseline simulations.
Carbon–Nitrogen Interactions in Two-Species Communities As in the analysis of aggregate vegetation, large changes in ecosystem C storage were associated with changes in SOM C:N (Figure 6). C–N interactions in communities having both high- and low-nPBR species were similar to those of the baseline vegetation except that C losses were smaller and gains larger for high-nPBR vegetation. Changes in the relative abundance of species differing in NUE had a large influence on C stocks because of the effects of litter C:N and production rate on SOM. Large C losses associated with decreased SOM C:N point to the importance of soil as a C sink in this Arctic ecosystem where over 97% of the ecosystem C stocks are in soil.
Longer-Term Trends in Community Composition Species dominance was established usually within 100 y. However, soil–vegetation feedbacks can cause dominance to cycle between the two species. For example, under the initial conditions of our simulations, a high-nPBR, high-NUE species has a competitive advantage over a low-nPBR, low-NUE species if CO2 is doubled and temperature increased by 5oC. Soil C accumulates because of increased litter production characteristic of the dominant species, and that C accumulation is accompanied by a sequestration of N in SOM. When enough N accumulates in
376
D. A. Herbert and others
Figure 5. Change of vegetation and SOM C stocks and N uptake by plants in community simulations compared with aggregate, baseline vegetation. A includes a high- and a low-nPBR species, B includes a high- and low-NUE species, C includes species that trade high nPBR for low NUE, D includes a species with both high nPBR and NUE and a species with low nPBR and NUE. Values are relative to initial conditions.
the soil, N mineralization becomes sufficient to favor the low-nPBR, low-NUE species (Figure 7). Soil organic C and N decline because of lower litter inputs characteristic to the low-nPBR, low-NUE species. The system reverts to a condition again favorable to the high-nPBR, high-NUE species, and the cycle repeats itself. This last example describes a
potential for multiple steady states dependent upon invasibility and shifts in species composition.
DISCUSSION Early responses to altered climate conditions were determined by the ability of vegetation to respond
Modeled Plant Growth and Biogeochemistry
377
Figure 7. Successful species reintroductions after competitive exclusion were facilitated by conditions created at steady state by the successful competitor. A doubling of CO2 and 5oC warming produced conditions advantageous to species 1, which completely excluded species 2. At steady state 1, N mineralization increased because of increases in the SOM pool. Conditions were favorable to the reintroduced species 2, which excluded species 1. At steady state 2, species 1 can be reintroduced, and if so, the system will return to steady state 1. Values are relative to initial conditions.
Figure 6. Predicted changes in ecosystem C partitioned by N source in community simulations. The interaction term is not included because it is very small in all cases. Values are relative to initial conditions.
rapidly to altered resource supply, which is related primarily to differences in nPBR. In our simulations, differences in nPBR are roughly proportional to differences in the non–steady state RGR of the species. In the two-species community simulations, high nPBR alone was enough to establish dominance in the short term. However, in all cases, the shift was transitory because secondary element limitations allowed the low-nPBR species to return to codominance. Species NUE was more important in determining the longer-term changes in C and N stocks. High-NUE species were less affected by secondary N limitations, allowing them to establish and maintain dominance when CO2 was doubled. The consequent increase in litter C:N decreased net N mineralization, which further favored the highNUE species and provided it with such a substantial competitive advantage that the low-NUE species was excluded from the community. Eventually
(more than 500 y), increased SOM brought about by increased litter production allowed soil organic N to accumulate, which reestablished a higher rate of net N mineralization. These new conditions favor the reestablishment of the low-NUE species. Vitousek (1986) hypothesized that biological invasions could regulate ecosystem properties by altering energy, nutrient, and water fluxes that in turn could facilitate further biological invasions, and he provides the example of an invading N fixing species in Hawaii’s forests (Vitousek and others 1987; Vitousek and Walker 1989). Enhanced nutrient availability through a variety of means has been used to explain facilitative patterns in several other studies (Muller 1953; Callaway and others 1991; Belsky 1994; Maun 1994). Our community simulations were not very complex, yet the predicted shifts in species dominance after climate change substantially altered ecosystem properties and processes. These alterations were mediated through changes in litter quality and the consequent feedbacks on microbial activity and N availability. In more complex systems open to species invasions, changes in ecosystem properties or processes could facilitate further changes in community composition, and each new species assemblage would affect N availability, productivity, biomass, and soil C storage. It is, therefore, conceiv-
378
D. A. Herbert and others
able that climate change could lead to either aggradation or degradation of ecosystems with respect to the properties we consider depending on changes in composite growth characteristics of established or successfully invasive plant species. Our results have implications for the predictive abilities of biogeochemical models currently used in assessing ecosystem and regional effects of climate change. The question of whether or not C will be stored in ecosystems or lost to the atmosphere as a consequence of a changing climate relies heavily on the growth characteristics and competitive abilities of established and successional plant species. In our simulations, species NUE was clearly important in determining long-term C storage, while nPBR was important in defining time scales of change. The nature of climate change will have additional influences on a changing vegetation. Temperature increases alone led to a shift toward low-NUE species in our simulations, whereas temperature increases combined with elevated CO2 led to a shift favoring high-NUE species. Other potentially important considerations include morphological characteristics that allow one species to shade another and periodic vegetation dieback that resets the system, and these are the focus of our continuing research.
Chapin FS III, Shaver G. 1985. Individualistic growth response of tundra plant species to environmental manipulations in the field. Ecology 66:564–76.
ACKNOWLEDGMENTS
Ingestad T, McDonald AJS. 1989. Interactions between nitrogen and photon flux density in birch seedlings at steady-state nutrition. Physiol Plant 11:1–11.
National Science Foundation grants DEB95–09613, DEB-921175, OPP-9415411, and OPP-9615563 provided funding support for this research. We thank Bonnie Kwaitkowski for assistance in development of the MEL model.
REFERENCES Aerts R. 1996. Nutrient resorption from senescing leaves of perennials: are there general patterns? J Ecol 84:597–608. A˚gren GI, McMurtrie RE, Parton WJ, Pastor J, Shugart HH. 1992. State-of-the-art models of production-decomosition linkages in conifer-grassland ecosystems. Ecol Appl 1:118–38. Bazzaz FA. 1990.The response of natural ecosystems to rising global CO2 concentrations. Annu Rev Ecol Syst 12:167–96. Belsky AJ. 1994. Influence of trees on savanna productivity: tests of shade, nutrients, and tree-grass competition. Ecology 75:367–97. Berendse F, Aerts R. 1987. Nitrogen-use efficiency: a biologically meaningful definition? Funct Ecol 1:293–96. Bloom AJ, Chapin FS III, Mooney HA. 1985. Resource limitation in plants, an economic analogy. Annu Rev Ecol Syst 16:363–92.
Chapin FS III, Shaver GR. 1996. Physiological and growth responses of arctic plants to a field experiment simulating climatic change. Ecology 77:822–40. Chapin FS III, Bloom AJ, Field CB, Waring RH. 1987. Plant responses to multiple environmental factors. Bioscience 37:49–57. Chapin FS III, Shaver GR, Giblin AJ, Nadelhoffer KJ, Laundre JA. 1995. Responses of arctic tundra to experimental and observed changes in climate. Ecology 76:694–711. Ericsson T, Ingestad T. 1988. Nutrition and growth of birch seedlings at varied relative phosphorus rates. Physiol Plant 72:227–35. Field C, Chapin FS III, Matson PA, Mooney HA. 1992. Responses of terrestrial ecosystems to the changing atmosphere: a resource-based approach. Annu Rev Ecol Syst 23:201–36. Field CB, Randerson JT, Malmstro¨m CM. 1995. Global net primary production: combining ecology and remote sensing. Remote Sens Environ 51:74–88. Giblin AE, Nadelhoffer KJ, Shaver GR, Laundre JA, McKerrow AJ. 1991. Biogeochemical diversity along a riverside toposquence in arctic Alaska. Ecological Monographs 61:415–35. Hirose T. 1975. Relations between turnover rate, resource utility and structure of some plant populations: a study in the matter of budgets. J Faculty Sci University of Tokyo, III 11:355–407. Hobbie SE. 1996. Temperature and plant species control over litter decomposition in Alaskan tundra. Ecol Monogr 66:503–22. Hooper DU, Vitousek PM. 1997. The effects of plant composition and diversity on ecosystem processes. Science 277:1302–5.
Jackson RB, Mooney HA, Schulze E-D. 1997. A global budget for fine root biomass, surface area, and nutrient contents. Proc Natl Acad Sci USA 94:7362–6. Killingbeck KT. 1996. Nutrients in senesced leaves: keys to the search for potential resorption and resorption proficiency. Ecology 77:1716–27. Maun MA. 1994. Adaptations enhancing survival and establishment of seedlings on a coastal dune system. Vegetatio 111:59–70. McKane RB, Rastetter EB, Melillo JM, Shaver GR, Hopkinson CS, Fernandes DN. 1995. Effects of global change on carbon storage in tropical forests of South America. Global Biogeochem Cycles 9:329–50. McKane RB, Rastetter EB, Shaver GR, Nadelhoffer KJ, Giblin AE, Laundre JA, Chapin FS III. 1997. Climatic effects on tundra carbon storage inferred from experimental data and a model. Ecology 78:1170–87. McMurtrie RE, Wang YP. 1993. Mathematical models of the photosynthetic response of tree stands to rising CO2 concentrations and temperatures. Plant Cell Environ 16:1–13.
Callaway RM, Nadkarni NM, Mahall BE. 1991. Facilitation and interferences of Quercus douglasii on understory productivity in Central California. Ecology 72:1484–99.
Miller PC, Managan R, Kummerow K. 1982. Vertical distribution of organic matter in eight vegetation types near Eagle Summit Alaska. Holarctic Ecol 5:117–24. Monsi M, Saeki T. 1953. U¨ber den lichtfaktor in den pflanzen-
Chapin FS III. 1980. The mineral nutrition of wild plants. Annu Rev Ecol Syst 11:233–60.
gesellschaften und seine bedeutung fu¨r die stoffproduktion. Jpn J Bot 14:22–52.
Chapin FS III. 1992. Functional role of growth forms in ecosystems and global processes. In: Ehleringer JR, Field CB, editors. Scaling physiological processes leaf to globe. San Diego, CA: Academic Press. 388 p.
Mooney HA. 1972. The carbon balance of plants. Ann Rev Ecol Syst 3:315–46. Muller CH. 1953. The association of desert annuals with shrubs. Am J Bot 40:53–60.
Modeled Plant Growth and Biogeochemistry
379
Rastetter EB, Shaver GR. 1992. A model of multiple-element limitation for acclimating vegetation. Ecology 73:1157–74.
CO2 flux in wet sedge tundras: responses to nutrients, temperature and light. Ecol Monogr 68:75–97.
Rastetter EB, McKane RB, Shaver GR, Melillo JM. 1992. Changes in C storage by terrestrial ecosystems: how C-N interactions respond to CO2 and temperature. Water Air Soil Pollut 64:327–44. Rastetter EB, A˚gren GI, Shaver GR. 1997. Responses of N-limited
Tateno M, Chapin FS III 1997. The logic of carbon and nitrogen interactions in terrestrial ecosystems. Am Nat 149:723–44. Taylor BR, Parkinson D, Parsons WFJ. 1989. Nitrogen and lignin content as predictors of litter decay: a microcosm test. Ecology 70:97–104.
ecosystems to increased CO-2: a balanced-nutrition, coupledelement-cycles model. Ecol Appl 7:444–60. Raynal DJ, Bazzaz FA. 1975. Interference of winter annuals with ambrosia artemisiifolia in early successional fields. Ecology 56:35–49. Schimel DS. 1990. Biogeochemical feedbacks in the earth system. In: Leggett J, editor. Global warming: the greenhouse report. Oxford: Oxford University Press. p 68–82. Shaver GR, Chapin FS III. 1991. Production: biomass relationships and element cycling in contrasting Arctic vegetation types. Ecological Monographs 61:1–31. Shaver G, Chapin FS III. 1980. Response to fertilization by various plant growth forms in an Alaskan tundra: nutrient accumulation and growth. Ecology 61:662–675. Shaver GR, Kummerow J. 1992. Phenology, resource allocation and growth of arctic vascular plants. In: Chapin III FS, Jeffries RL, Reynolds JF, Shaver GR, Svoboda J, editors. Arctic ecosystems in a changing climate: an ecophysiological perspective. San Diego: Academic Press. Shaver GR, Billings WD, Chapin FS III, Giblin AE, Nadelhoffer KJ, Oechel WC, Rastetter EB. 1992. Global change and the carbon balance of arctic ecosystems. BioScience 42:433–41. Shaver GR, Johnson LC, Cades DH, Murray G, Laundre JA, Rastetter EB, Nadelhoffer KJ, Giblin AE. 1998. Biomass and
Tilman D. 1987. Secondary succession and the pattern of plant dominance along experimental nitrogen gradients. Ecol Monogr 57:189–214. Vitousek PM. 1982. Nutrient cycling and nutrient use efficiency. American Naturalist 119:553–72. Vitousek PM. 1984. Litterfall, nutrient cycling, and nutrient limitation in tropical forests. Ecology 65:285–98. Vitousek PM. 1986. Biological invasions and ecosystem properties: can species make a difference? In: Mooney HA, Drake JA, editors. Ecology of biological invasions of North America and Hawaii. Volume 58, Ecological studies, analysis and synthesis. New York: Springer-Verlag. Vitousek PM, Walker LR. 1989. Biological invasions by Myrica faya in Hawaii: plant demography, nitrogen fixation, ecosystem effects. Ecol Monogr 59:247–65. Vitousek PM, Walker LR, Whiteaker LD, Mueller-Dombois D, Matson PA. 1987. Biological invasion of Myrica faya alters ecosystem development in Hawaii. Science 238:802–4. Wikstro¨m F, Ericsson T. 1995. Allocation of mass in trees under nitrogen and magnesium limitation. Tree Physiol 15:339–44. Williams, M, Yanai RD. 1996. Multi-dimensional sensitivity analysis and ecological implications of a nutrient uptake model. Plant Soil 180:311–24.
Appendix A Model Equations, Variables, and Parameters
(1)
(2)
(4)
(6)
dEN dt dBCi dt dDC dt dVCi dt
⫽ RNe ⫹ RNm ⫺ LNe ⫺ UNm ⫺ UNvi ⫽ UCvi ⫺ RCvi ⫺ LCvi
(3)
⫽ LCvi ⫺ RCm ⫺ LCD
(5)
⫽ ⫺ai AiVCi: ifAi ⱖ 0
(7)
dBNi dt dDN dt dVNi dt
⫽ UNvi ⫺ LNvi ⫽ LNvi ⫹ UNm ⫺ RNM ⫺ LND ⫽⫺
dVCi dt
⫽ ⫺ai AiVNi: if Ai ⬍ 0 BAmaxiciiBCi
(8) BAi ⫽
(9) qi ⫽
n
BAmaxi ⫹
兺c B
BCiqminiqmaxi BAiqmaxi ⫹ (BCi ⫺ BAi )qmini
ji Cj
j⫽1
n
(10a) SCi ⫽ bCiVCiBAi (10b) SCT ⫽
n
兺S
(11a) SNi ⫽ bNiVNiBAi
Cj
(11b) SNT ⫽
j⫽1
(12a) wCi ⫽
2(1 ⫺ e ⫺k1SCi ) (1 ⫹ e ⫺k1SCi )
兿1 n
j⫽1
Nj
j⫽1
2
fCje ⫺k1SCj ⫹ fCi fCi ⫹ fCj
兺S
(12b) UCvi ⫽
gCiECwCi (1 ⫺ e ⫺kISCT ) n
(kCi ⫹ EC )
兺w j⫽1
Cj
380
D. A. Herbert and others
Appendix A Model Equations, Variables, and Parameters (Continued)
(13a) wNi ⫽
2(1 ⫺ e ⫺kSSNi ) (1 ⫹ e ⫺kSSNi )
兿1 n
2
fNje ⫺kSSNj ⫹ fNi
j⫽1
fNi ⫹ fNj
gNiENwNi (1 ⫺ e ⫺kSSNT )
(13b) UNvi ⫽
n
(kNi ⫹ EN )
兺w
Nj
j⫽1
(14) LCvi ⫽ mAiBAi ⫹ mWi (BCi ⫺ BAi )
(16) RCvi ⫽ rAiBAi ⫹ rWi (BCi ⫺ BAi )
(15) LNvi ⫽
3
qiBNi mAi
(17) Ai ⫽ ln
BCi
qAi
BAi ⫹
1q B 2 ⫹ h 1B BCi
(20) LND ⫽
(22) UNm ⫽ (24) ⌳C ⫽
CD
qWi
1 dBCi
i
i Ni
(18) LNe ⫽ NeE N␥
mWi
ci
dt
4
(BCi ⫺ BAi )
⫺
2
1 dBNi BNi dt
(19) LCD ⫽ CDDC ⑀N
DC
(21) ⫽
␣ND C2 EN
(23) MN ⫽ DN ⫹ UNm
⑀C
DN (Nm ⫹ EN ) ⑀CMN
DC ⫹ MN
(25) ⌳N ⫽
⑀NDC DC ⫹ MN
(26) RCm ⫽ DC (1 ⫺ ⌳C )
(27) RNm ⫽ MN (1 ⫺ ⌳N )
Ai ai BAi BAmaxi BCi bCi BNi bNi cji DC DN EC EN fCi fNi gCi gNi hi kCi kI kNi kS LCD LCvi LND LNe LNvi mAi mWi qi qAi qmaxi qmini
qWi rAi RCm RCvi RNe RNm rWi SCi SNi SCT SNT t UCvi UNm UNvi VCi VNi wCi wNi ␣N CD Ne ␥ ⑀C ⑀N Nm ⌳C ⌳N MN
acclimation potential acclimation rate (y⫺1 ) active-tissue C in plants (g C m⫺2 ) maximum BAi (g C m⫺2 ) C in plant biomass (g C m⫺2 ) leaf area per unit C (m2 g⫺1 C) N in plant biomass (g N m⫺2 ) root length per unit C (m g⫺1 C) allometric effect of species j on i C in soil detritus (g C m⫺2 ) N in soil detritus (g N m⫺2 ) CO2 concentration (mL m⫺3 ) inorganic N (g N m⫺2 ) canopy dominance parameter soil dominance parameter plant C-uptake rate (g C m⫺2 y⫺1 ) plant N-uptake rate (g N m⫺2 y⫺1 ) acclimation damping (y) 1/2-saturation for CO2 (mL m⫺3 ) light extinction (m2 m⫺2 ) plant 1/2-saturation for N (g N m⫺2 ) soil-resource extinction (m2 m⫺1 ) organic C leaching (g C m⫺2 y⫺1 ) litter C production (g C m⫺2 y⫺1 ) organic N leaching (g N m⫺2 y⫺1 ) inorganic N leaching (g N m⫺2 y⫺1 ) N in litter production (g N m⫺2 y⫺1 ) active-tissue litter loss rate (y⫺1 ) woody-tissue litter loss rate (y⫺1 ) plant optimal C:N (g C g⫺1 N) active-tissue litter C:N (g C g⫺1 N) maximum plant C:N (g C g⫺1 N) minimum plant C:N (g C g⫺1 N)
woody-tissue litter C:N (g C g⫺1 N) active-tissue respiration rate (y⫺1 ) microbial respiration (g C m⫺2 y⫺1 ) plant respiration (g C m⫺2 y⫺1 ) external N supply (g N m⫺2 y⫺1 ) N mineralization (g N m⫺2 y⫺1 ) woody-tissue respiration rate (y⫺1 ) species i leaf area (m2 m⫺2 ) species i root length (m m⫺2 ) total leaf area (m2 m⫺2 ) total root length (m m⫺2 ) time (y) gross photosynthesis (g C m⫺2 y⫺1 ) microbial N uptake (g N m⫺2 y⫺1 ) plant N uptake (g N m⫺2 y⫺1 ) plant C-uptake effort plant N-uptake effort canopy scaling factor root scaling factor microbial N uptake (g N g⫺1 C) organic C loss (y⫺1 ) inorganic N loss (g1⫺␥ N m⫺2⫹2␥ y⫺1 ) inorganic N loss exponent maximum microbial C efficiency maximum microbial N efficiency leached organic matter C:N (g C g⫺1 N) C:N microbial consumption (g C g⫺1 N) microbial 1/2-saturation for N (g N m⫺2 ) microbial C efficiency microbial N efficiency microbial N consumption (g N m⫺2 y⫺1 ) C:N microbial byproducts (g C g⫺1 N) decomposition rate (y⫺1 )
Modeled Plant Growth and Biogeochemistry
381
Appendix B Initial State Variables, Fluxes, and Parameters Used in MEL for Tussock Tundra at Toolik Lake, Alaska
Term Variables BC BN BA SC SN bC bN DC DN EC EN Initial fluxes UCv UNv RCv LCv LNv UNm RNm RCm RNe LNe Plant parameters mA mW rA rW q qA qW kC kN BAmax qmax qmin VC VN kl ks Microbial parameters ␣N Ne ⑀C
Definition
Units
Total EcoLedum Vaccinium Betula system palustre vitis-idea nana
Total plant C Total plant N Active tissue C Leaf area Fine root length Leaf area per g C Fine root length per g C C in soil detritus N in soil detritus Atmospheric CO2 Soil inorganic N
g C m⫺2 g N m⫺2 g C m⫺2 m2m⫺2 m m⫺2 m2 g⫺1 C m g⫺1 C g C m⫺2 g N m⫺2 ppmv g N m⫺2
444.1 8.807 158.69 0.903 2819 0.0138 30.30 15737 809 350 0.1
101.75 1.637 19.02 0.118 85.80 0.0084 17
Gross photosynthesis Plant N uptake Plant respiration Litter C loss Litter N loss Microbial N uptake N mineralization Microbial respiration N deposition Inorganic N leaching
g C m⫺2 y⫺1 g N m⫺2 y⫺1 g C m⫺2 y⫺1 g C m⫺2 y⫺1 g N m⫺2 y⫺1 g N m⫺2 y⫺1 g N m⫺2 y⫺1 g N m⫺2 y⫺1 g N m⫺2 y⫺1 g N m⫺2 y⫺1
207.74 1.799 103.87 103.87 1.799 1.799 4.306 103.87 0.06 0.06
26.51 0.243 13.25 13.25 0.243 0.243
Active tissue litter rate Woody tissue litter rate Active tissue respiration Woody tissue respiration Optimal plant C:N Active tissue litter C:N Woody tissue litter C:N 1 saturation for CO ⁄2 2 1 saturation for N ⁄2 Maximum BA Maximum plant C:N Minimum plant C:N Plant C uptake effort Plant N uptake effort Light extinction Soil resource extinction
y⫺1 y⫺1 y⫺1 y⫺1 g C g⫺1 N g C g⫺1 N g C g⫺1 N mL m⫺3 g N m⫺2 g C m⫺2 g C g⫺1 N g C g⫺1 N
0.4543 0.1113 0.4543 0.1113 50.42 53.30 71.17 350 0.5 351.5 100 27 0.4137 0.5863 0.5 0.00008
0.4651 0.0533 0.4651 0.0533 62.16 48.88 71.61 350 0.5
N uptake N loss Maximum C efficiency
g N g⫺1 C 0.1822 g1⫺␥ N m⫺2⫹⫺2␥ 0.6 0.6
m m⫺2 m m⫺1
86.06 1.687 38.56 0.256 310.26 0.0108 21
120.6 2.158 27.96 0.190 480.65 0.0268 23
Eriophorum Carex vaginatum bigelowii Ref. 89.65 2.174 47.09 0.283 369.01 0.0161 12.5
46.01 1.151 26.05 0.056 1573.22 0.0171 69
a,b a,b a,b a,c b,d c d e e
e
18.13 0.141 9.06 9.06 0.141 0.141
32.62 0.290 16.31 16.31 0.290 0.290
108.66 0.886 54.33 54.33 0.886 0.886
21.82 0.239 10.91 10.91 0.239 0.239
a a a f a a g h i i
0.1988 0.0294 0.1988 0.0294 51.01 64.97 60.53 350 0.5
0.7347 0.6169 0.2653 0.3831
0.2941 0.0873 0.2941 0.0873 55.89 45.18 74.67 350 0.5
0.8348 0.3531 0.8348 0.3531 41.24 57.80 72.96 350 0.5
0.3091 0.1431 0.3091 0.1431 39.97 42.03 60.00 350 0.5
0.2527 0.3732 0.7473 0.6268
0.1248 0.8752
a,b a f f a,b a,b a,b j k
382
D. A. Herbert and others
Appendix B (Continued)
Term ⑀N Nm ⌳C ⌳N MN
Definition Maximum N efficiency C:N consumption N 1⁄2 saturation constant C efficiency N efficiency N consumption C:N Decomposition rate
Units g C g⫺1 N g N m⫺2
g N m⫺2 y⫺1 g C g⫺1 N y⫺1
Total Ecosystem
Ledum palustre
Vaccinium vitis-idea
Betula nana
Eriophorum vaginatum
Carex bigelowii
Ref.
0.9 10.8 1 0.2804 0.4794 11.727 8 0.00459
a Shaver and Chapin 1991; Chapin and others 1995; G. R. Shaver unpublished data from arctic LTER tussock harvests 1982, 1983, and 1989. Assumption that N is not resorbed from senescing woody tissues. b Root mass allometrically estimated from total mass of leaves, stems, and rhizomes based on measurements in Miller and others (1982), Shaver and Chapin (1991), and Shaver and Kummerow (1992). Root N content from Hobbie (1996). Root production based on root to leaf production rates in Shaver and Kummerow (1992) and Hobbie (1996). Assumption that N is not resorbed from senescing roots. c Mass based allometric leaf area from G. R. Shaver unpublished arctic LTER leaf area and biomass measurements. d Jackson and others (1997) and Williams and Yanai (1996). e Giblin and others (1991). f Assumes that net/gross production ⫽ 0.5. g Assumes that net/gross N mineralization ⫽ 0.5. h Calibrated. i McKane and others 1997. Mass balance at steady state dictates that N losses equal N inputs. j McMurtrie and Wang (1993). Calibrated to produce a 133% increase in CO uptake when atmospheric CO concentration is doubled. 2 2 k Rastetter and others 1997. Calibrated to produce a 171% increase in N uptake when available N is doubled.