International Journal of Electronics and Electrical Engineering Vol. 1, No. 3, September, 2013
Effect of Calculation Algorithm on Heart Rate Variability by Chaos Theory Hoang ChuDuc, Phyllis K. Stein Washington University in St. Louis, School of Medicine, 13th floor Northwest Tower, 660 S. Euclid Ave. Saint Louis, Missouri 63110, USA Email:
[email protected]
Hung PhamManh School of Electronics and Telecommunications, Hanoi University of Science and Technology No1 Dai Co Viet, Hanoi, Vietnam Email:
[email protected]
[1]. Even during day and night periods, the autonomic cardiovascular modulation is different. Although the exact mechanisms underlying this circadian profile of adverse vascular events are still unknown. How the autonomic nervous system (ANS) exactly modulates the heart rate remains an open question. Heart rate variability (HRV) can be used to quantify several aspects of the autonomic heart rate modulation [2]. Standard time and frequency domain methods of HRV are well described by the Task Force of the European Society of Cardiology and the North American Society of Pacing and Electrophysiology [3], but they fail to show the dynamic properties of the fluctuations. Therefore, nonlinear methods are typically designed to assess the quality, scaling and correlation properties, rather than to assess the magnitude of variability like standard HRV methods do. However, in agreement with Lefebvre [4] and Yamamoto and Hughson [5], it seems likely that the cardiovascular system follows some nonlinear dynamics which need to be explored further. Indeed, an important feature of a healthy cardiovascular system is adaptation, which can be defined as the capacity to respond to unpredictable stimuli. Consequently, a nonlinear behavior would offer greater flexibility than a linear behavior. The use of nonlinear techniques will probably give additional information related to the dynamical changes in cardiovascular control. While the day-night difference as well as the influence of gender and age on the autonomic modulation of heart rate has often been studied, most studies were limited to the standard HRV parameters. Ramaekers already reported a significant difference between day and night standard HRV, reflecting a higher vagal modulation during the night while Beckers described a tendency for higher nonlinearity during night time [6], [7]. Schwartz found a decreasing autonomic modulation with advancing age, which already starts in childhood [8]. In this paper, not only linear but also a large set of nonlinear techniques are applied to quantify scaling behavior and complexity. In particular, we focus on the recently developed numerical noise titration technique,
Abstract—Heart rate variability (HRV) is the physiological phenomenon of variation in the time interval between heartbeats. It is measured by the variation in the beat-tobeat interval. HRV parameters providing information about the scaling behavior or the complexity of the cardiac system were included. In addition, Chaos theory is a field of study in mathematics, with applications in several disciplines including physics, engineering, economics, biology, and philosophy. Chaos theory studies the behavior of dynamical systems that are highly sensitive to initial conditions, an effect which is popularly referred to as the butterfly effect. The goal was to investigate the influence of gender, age and day-night variation on these nonlinear HRV parameters. Numerical titration yielded similar information as other nonlinear HRV parameters do. However, it does not require long and cleaned data and therefore applicable on short (15 minutes) noisy time series. A higher nonlinear behavior was observed during the night while nonlinear heart rate fluctuations decline with increasing age. Our results support the involvement of the autonomic nervous system in the generation of nonlinear and complex heart rate dynamics. Index Terms—heart rate variability, circadian variations, chaos theory
I.
INTRODUCTION
Heart rate variability has attracted much attention from researchers since the early 1980s. It has long been understood that a metronomic heart rate is pathological, and that the healthy heart is influenced by multiple neural and hormonal inputs that result in variations in interbeat (RR) intervals, at time scales ranging from less than a second to 24 hours. Even after 20 years of study, new analytic techniques continue to reveal properties of the time series of RR intervals. Much research in this area aims to discover or to explain how specific changes in variability can be related to specific pathologies. Cardiovascular structures and functions change with age, increasing the risk of developing cardiovascular disease Manuscript received April 8, 2013; revised June 8, 2013. ©2013 Engineering and Technology Publishing doi: 10.12720/ijeee.1.3.145-148
145
International Journal of Electronics and Electrical Engineering Vol. 1, No. 3, September, 2013
which provides a highly sensitive test for deterministic chaos and a relative measure for tracking chaos of a noise-contaminated signal in short data segments, for example 5 minutes of data. The main goal of this study is to examine the nonlinear dynamics in autonomic heart rate control according to gender, age and day-night periods. Therefore, the study includes a large number of healthy subjects between adolescence and old age. II.
METHODS
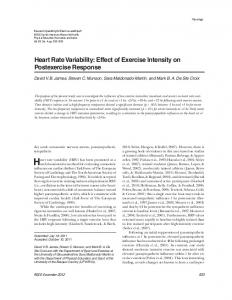
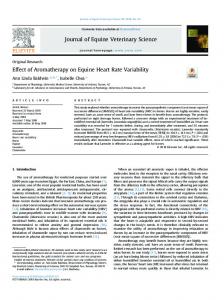
A. Data Acquisition Heart rate variability might be thought that simulating a realistic sequence of RR intervals would be an easy task. The intricate interdependencies of variations at different scales, however, make it difficult to create a simulation of sufficient realism to mislead an experienced observer, and it may be even harder to deceive a program designed to quantify these subtle features. Each of the figures below shows a 10 hour time series of RR intervals at the same scale (the range of heart rates is roughly 70 to 120 bpm in each case).
(ApEn). Also a chaotic signature is calculated by means of the Lyapunov exponent (LE) and the numerical noise titration, a nonlinear data analysis that is recently developed by Poon, Barahona [9] and Stein P K, Domitrovich [10]. A short overview of these methods will be given as they have been used multiple times, except the noise titration technique which will be outlined in detail based on Barahona and Poon [11]. For any heartbeat RR time series yn, n = 1, 2, …, N, a closed-loop version of the dynamics is proposed in which the output yn feeds back as a delayed input. The univariate time series are analyzed by using a discrete Volterra autoregressive series of degree d and memory κ as a model to calculate the predicted time series : yncalc a0 a1 yn1 a2 yn2 a yn a 1 yn21 a 2 yn1 yn2 aM ynd M 1
am zm (n)
(1)
m 0
where r 1, M is the number of polynomial terms of the truncated Volterra expansion from a certain pair (,d). For each data series, the best linear model is obtained by searching for linear which minimizes C(r) with d=1. Analogously, varying nonlinear and d>1 leads to the best nonlinear model. Likewise, the best linear and nonlinear models for surrogate randomized data sets with the same autocorrelation and power spectrum as the original series are obtained. This results in four competing models with linear nonlinear linear error standard deviations original , original , surrogate nonlinear and surrogate . The presence of nonlinear determinism is
now indicated if dopt 1 . Further corroboration is obtained with the following objective statistical criteria: for models with Gaussian residuals, a standard F-test will serve to reject, with a certain level of confidence, the hypothesis that nonlinear models are no better than linear models as one-step-ahead predictors. This Gaussian assumption was verified throughout the analysis by using a 2-test with a 99% cut-off. Alternatively, the results are confirmed by using the nonparametric Mann – Whitney rank-sum statistic, which does not depend on the Gaussian assumption [12]. Taking into account this scheme, the relevance of nonlinear predictors is established when the best nonlinear model from the original data is significantly more predictive than the best linear model from the real data series as well as the best linear and nonlinear models obtained from the surrogate series. To understand the nonlinear detection part completely, two important remarks are inevitable. Firstly, surrogate data are generated by preserving only the linear autocorrelation function of the original data series. The nonlinear autocorrelations are randomized and therefore adding nonlinear terms does not increase the prediction power. Consequently, surrogate data are always best
Figure 1. 24-hour RR interval time series
We have provided an approximately equal number of real 24-hour RR interval time series. These were derived from long-term ECG recordings of adults between the ages of 20 and 50 who have no known cardiac abnormalities, similar to those included in the MIT-BIH Normal Sinus Rhythm Database. These recordings typically begin and end in the early morning (within an hour or two of the subject's awakening). Small numbers of ectopic beats are common in such recordings, as are short intervals of artifacts that may cause false beat detections or missed beat detections. We have excluded recordings with significant amounts of noise or ectopy. B. Nonlinear HRV Parameters Nonlinear HRV parameters do not describe the amount of modulation as such, but are able to describe the scaling and complexity properties of the signal. Often used parameters which study the scaling of the system are 1/f slope, fractal dimension (FD) and detrended fluctuation analysis while the complexity is addressed via the correlation dimension (CD) and approximate entropy
©2013 Engineering and Technology Publishing
linear nonlinear approximated by a linear model: surrogate surrogate . Secondly, the time delay for the embedding is another
146
International Journal of Electronics and Electrical Engineering Vol. 1, No. 3, September, 2013
free parameter which has to be determined in case of continuous signals. The optimal time delay is chosen so
already increasing extremely from 5 a.m., becoming stable from 8 a.m. on and again decreasing monotonously after 7 p.m. reaching the lowest peak at 4 a.m. The values of FD and DFA 1 increase just before and during waking up are almost constant afterwards and start to decrease slightly from late afternoon on. While DFA 1 increases in the morning hours till 10 a.m., DFA DFA 2 reflects exactly the opposite profile. 1/f and CD show an abrupt fall just before and during awakening, similar to heart rate, and a big jump in the late evening. LE did not show a clear 24h profile; however a transient dip was observed in the morning hours. When looking in particular to the noise titration parameters, deterministic chaos seems to increase monotonously in the evening, reaching a maximum early in the morning (3 – 5 a.m.), followed by a decrease and sharp fall around 7 a.m.
linear as to maximize the difference between original and nonlinear . Within the range of acceptable time delays, original linear nonlinear generally surrogate , meaning that the surrogate
prediction power of the linear model of a continuous signal derives mainly from its autocorrelation function. This holds for discrete maps as well. Consequently, and in contrast with other methods, surrogate data play only a confirmative role in this nonlinear detection procedure III.
RESULTS
These ECG records is a detailed clinical summary, including age, gender, diagnosis, and where applicable, data on medical history, medication and interventions, coronary artery pathology, ventriculography, echocardiography, and hemodynamics. The clinical summary is not available for 22 subjects. The diagnostic classes of the remaining 268 subjects are summarized below: TABLE I.
TABLE II. DIFFERENCE IN CHAOTIC BEHAVIOR PARAMETERS (MEAN ±STANDARD DEVIATION) ACCORDING TO GENDER AND DAY OR NIGHT PERIOD Time of a day Day
Type of Data and subjects Number subjects
24h
NLmean [%]
TYPE OF DATA AND SUBJECTS FROM PHYSIONET BANK.
Diagnostic class
Night
of
Men
19.20 ±10
21.43 ±8
19.96 ±9
Women
17.88 ±9
19.93 ±8
18.60 ±8
All
18.57 ±10
20.72 ±8
19.32 ±8
P (gender)
ns
0.0519
ns
1
Myocardial infarction
148
2
Cardiomyopathy/Heart failure
18
Men
53.07 ±19
60.35 ±14
55.85 ±17
3
Bundle branch block
15
Women
48.21 ±20
57.64 ±20
51.94 ±18
4
Dysrhythmia
14
All
50.77 ±20
59.06 ±19
53.99 ±18
5
Myocardial hypertrophy
7
P (gender)
0.0725
ns
ns
6
Valvular heart disease
6
7
Myocarditis
4
8
Miscellaneous
4
9
Healthy controls
52
NLdr [%]
In TABLE II, abbreviations: P (gender) indicates the pvalue for gender differences in case p < 0.1, otherwise ns = non-significant IV.
Heart rate variability is considered a parameter of autonomic cardiovascular control. In this study, the most commonly used nonlinear HRV parameters were examined in a population of the database contains 549 records from 290 subjects (aged 17 to 87, mean 57.2; 209 men, mean age 55.5, and 81 women, mean age 61.6; ages were not recorded for 1 female and 14 male subjects). In addition, the recently developed method of numerical noise titration was applied leading to the new chaotic HRV parameters NLmean and NLdr. Nowadays, this technique has only been applied a few times and always to study relative differences between patient groups. Many previous studies have tried to assess day-night variations or gender- and age-related differences in HRV parameters, although most of these studies have major limitations: small groups, fixed age category, unequal amount of male and female subjects, short duration recordings and use of only a few parameters. All these shortcomings were taken into account in this study. In
All values, expressed as mean ± standard deviation, for mean RR and the nonlinear indices are listed in TABLE I, separately for day and night. For every HRV parameter, it is indicated whether the day-night difference is statistically significant or not. As expected during the night, heart rate was significantly lower (higher mean RR interval). A day-night variation was present in all nonlinear HRV parameters, although one has to remark that day and night period have a different recording length which can slightly affect some nonlinear HRV parameters. More subtle changes during the transitions between day and night are reflected for all nonlinear HRV parameters by quantifying each of the 24 hours. Mean and standard error for each hour are plotted in Fig. 1 for HR and all nonlinear parameters, separately for men and women. In general, an evolution over 24 hours can be observed for all indices, except LE. Heart rate starts ©2013 Engineering and Technology Publishing
DICUSSION
147
International Journal of Electronics and Electrical Engineering Vol. 1, No. 3, September, 2013
of Cardiology and the North American Society of Pacing and Electrophysiology,” Circulation, vol. 93, pp. 1043-1065, 1996. [4] J. H. Lefebvre, D. A. Goodings, M. V. Kamath, and E. L.Fallen, “Predictability of normal heart rhythms and deterministic chaos,” Chaos, vol.3, pp. 267-277, 1993 [5] Y. Yamamoto and R L. Hughson, “Failure in rejecting a null hypothesis of stochastic human heart rate variability with 1/f spectra,” American Institute of Physics conference Proceedings, Noise in Physical Systems and 1/f Fluctuations, pp. 697-700, 1993. [6] D. Ramaekers, H. Ector, A. E. Aubert, and A. Rubens, “Van de Werf F. Heart rate variability and heart rate in healthy volunteers: is the female autonomic nervous system cardioprotective?” Eur. Heart J., vol. 19, pp. 1334-1341, 1998. [7] F. Beckers, B. Verheyden, and A. E. Aubert, “Aging and nonlinear heart rate control in a healthy population,” Am. J. Physiol. Heart Circ. Physiol., vol. 290, pp.2560-2570, 2006. [8] P. J. Schwartz and S. G. Priori, “Sympathetic nervous system and cardiac arrythmias Cardiac electrophysiology. From cell to bedside,” Ed. D. P. Zipes and J. Jalife, Philadelphia: WB Saunders, 1990, pp 330-343. [9] C. S. Poon and M. Barahona, “Titration of chaos with added noise,” PNAS USA, vol. 98, pp. 7107-12, 2001. [10] P. K. Stein, P. P. Domitrovich, N.Hui, P. Rautaharju, and J. S. Gottdiener, “Sometimes higher heart rate variability is not better heart rate variability: results of graphical and nonlinear analyses,” J. Cardiovasc. Electrophysiol., vol. 16, no. 9, pp. 954-959, 2005. [11] M. Barahona and C. S. Poon, “Detection of nonlinear dynamics in short, noisy data series,” Nature, vol. 381, pp. 215-217, 1996. [12] M. B. Kennel and S. Isabelle, “Method to distinguish possible chaos from colored noise and to determine embedding parameters,” Phys. Rev. A, vol. 46, pp. 3111-3118, 1992.
addition, via hour-by-hour analysis, we presented for each nonlinear HRV parameter the clear circadian profile as a function of age or gender. It is generally acknowledged that there is a unique circadian distribution of cardiovascular events with a striking preponderance in the morning hours. A possible link to physiological rhythms with a similar diurnal variation is therefore inevitable. According to our knowledge, only Bonnemeier studied hour-by-hour HRV analysis of Holter recordings in healthy subjects as a function of age and gender, although restricted to only time domain HRV parameters. Our study is an extension and complementary to the previous study as we performed an analysis with nonlinear HRV parameters, giving the benefit of examining the daily profile more in detail instead of only day-night variations. Nevertheless many scaling behavior or complexity parameters showed higher values for women than men, again confirming the added value of chaotic HRV parameters with respect to the other nonlinear HRV parameters. V.
CONCLUSION
Time- and frequency-domain analysis of HRV has been proved effective in evaluating autonomic modulation of the sinus node and in stratifying patients after MI. The marked reduction in HRV observed in high-risk patients seems to be associated with a significant attenuation of the linear and rhythmic components of HRV; thus, a nonlinear approach based on the evaluation of long- and short-term correlation of inter beat intervals seems to be more efficient in detecting the abnormal pattern of R-R fluctuations present in these patients and likely to reflect an abnormal autonomic modulation. This study showed the typical circadian profiles for several nonlinear HRV parameters as a function of age and gender. Not only parameters providing information about the scaling behavior or the complexity of the autonomic heart rate modulation are included, but also the chaotic behavior was quantified by means of the recently developed numerical noise titration technique. This method can be applied on short noisy time series, which can be a big advantage in clinical environment in the future.
Hoang ChuDuc is Researcher at Department of Electronics and Biomedical Engineering, School of Electronics and Telecommunication, Hanoi University of Science and Technology. He has 8 years experience at researcher in biomedical equipment design, signal processing and teaching. From 2010, he does PhD research with project “Impact analysis between the ECG signal and the common defense of the Vietnamese.” In 2013, He came to Washington University in St. Louis, School of Medicine, 13th floor Northwest Tower, 660 S. Euclid Ave. Saint Louis as a visitor researcher.
Phyllis K. Stein is Director at Washington University School of Medicine Heart Rate Variability Laboratory, Division of Cardiology, 13th floor Northwest Tower, 660 S. Euclid Ave. Saint Louis, Missouri 63110.
REFERENCES [1] [2]
[3]
H. Oxenham and N. Sharpe, “Cardiovascular aging and heart failure,” J. Eur, Heart Failure, vol. 5, pp. 427-434, 2003. S. Akselrod, D. Gordon, F. A. Ubel, D. C. Shannon, A. C. Berger, and R. J. Cohen, “Power spectrum analysis of heart rate fluctuation: A quantitative probe of beat-to-beat cardiovascular control,” Science, vol. 213, pp. 220-222, 1981 “Heart rate variability: Standards of measurement, physiological interpretation and clinical use. Task Force of the European Society
©2013 Engineering and Technology Publishing
Hung PhamManh is Researcher at Department of Electronics and Biomedical Engineering, School of Electronics and Telecommunication, Hanoi University of Science and Technology. He has 8 years experience at researcher in biomedical e quipment design, signal processing and teaching.
148