James, Munson, Maldonado-Martin, andPhysiology De Ste Croix Research Quarterly for Exercise and Sport ©2012 by the American Alliance for Health, Physical Education, Recreation and Dance Vol. 83, No. 4, pp. 533–539
Heart Rate Variability: Effect of Exercise Intensity on Postexercise Response David V. B. James, Steven C. Munson, Sara Maldonado-Martin, and Mark B. A. De Ste Croix
The purpose of the present study was to investigate the influence of two exercise intensities (moderate and severe) on heart rate variability (HRV) response in 16 runners 1 hr prior to (-1 hr) and at +1 hr, +24 hr, +48 hr, and +72 hr following each exercise session. Time domain indexes and a high frequency component showed a significant decrease (p < .001) between -1 hr and +1 hr for severe intensity. The low frequency component in normalized units significantly increased (p < .01) for severe intensity at +1 hr. Only severe exercise elicited a change in HRV outcomes postexercise, resulting in a reduction in the parasympathetic influence on the heart at +1 hr; however, values returned to baseline levels by +24 hr.
Key words: autonomic nervous system, parasympathetic, sympathetic
H
eart rate variability (HRV) has been promoted as a useful noninvasive method for evaluating autonomic influence on cardiac rhythm (Task Force of The European Society of Cardiology and The North American Society of Pacing and Electrophysiology, 1996). It is widely accepted that regular exercise training induces adaptations in HRV (i.e., oscillation in the interval between consecutive heartbeats) outcomes with a shift of autonomic balance toward higher parasympathetic activity, which is consistent with improved cardiac health (Task Force of The European Society of Cardiology, 1996). While the cardioprotective benefits of exercising at vigorous intensities are well known (Haskell et al., 2007; Swain & Franklin, 2006), less attention has been paid to the HRV response following a single exercise bout that includes high intensity (Gladwell, Sandercock, & Birch,
Submitted: July 18, 2011 Accepted: October 10, 2011 David V. B. James, Steven C. Munson, and Mark B. A. De Ste Croix are with the Department of Sport and Exercise at the University of Gloucestershire. Sara Maldonado-Martin is with the Department of Physical Education and Sport at the University of the Basque Country (UPV/EHU).
RQES: December 2012
James.indd 533
2010; Seiler, Haugen, & Kuffel, 2007). However, there is a growing body of evidence in this area based on studies of trained athletes (Bernardi, Passino, Robergs, & Appenzeller, 1997; Furlan et al., 1993; Hautala et al., 2001; Seiler et al., 2007), trained students (James, Barnes, Lopes, & Wood, 2002), moderately trained athletes (James, Reynolds, & Maldonado-Martin, 2010; Mourot, Bouhaddi, Tordi, Rouillon, & Regnard, 2004), and detrained (Raczak et al., 2005) and untrained active participants (Gladwell et al., 2010; Heffernan, Kelly, Collier, & Fernhall, 2006; Pober, Braun, & Freedson, 2004; Terziotti, Schena, Gulli, & Cevese, 2001) that a single exercise bout may result in increased sympathetic influence 1 hr postexercise (Bernardi et al., 1997; James et al., 2002; Mourot et al., 2004) and that by 24 hr postexercise the sympathetic influence returns to baseline levels (Bernardi et al., 1997; Mourot et al., 2004; Terziotti et al., 2001). Furthermore, HRV values returned more rapidly to baseline in highly trained than in less trained participants after high-intensity exercise (Seiler et al., 2007). Following an initial suppression of parasympathetic influence at 1 hr postexercise, elevated parasympathetic influence has been observed at 48 hr following prolonged exercise (Hautala et al., 2001). In contrast, one study showed moderate intensity exercise was associated with elevated parasympathetic influence within 1 hr after exercise cessation (Pober et al., 2004). This is an interesting finding, as such changes are known to have a cardiopro-
533
12/4/2012 1:40:08 PM
James, Munson, Maldonado-Martin, and De Ste Croix
tective effect (Lown & Verrier, 1976). Although different studies examined HRV responses at different intensities (Gladwell et al., 2010; Parekh & Lee, 2005; Seiler, Haugen, & Kuffel, 2007; Terziotti et al., 2001), to the best of our knowledge only one directly explored the impact of exercise intensity over 48 hr after exercise cessation (Mourot et al., 2004). In that study, both moderate and high-intensity exercise resulted in reduced parasympathetic influence 1 hr following exercise cessation, and there appeared to be no notable differences between exercise intensity responses up to 48 hr postexercise. However, the study by Mourot et al. (2004) included a potential confounding variable, as participants performed continuous exercise for the moderate-intensity condition and interval exercise for the severe-intensity condition. Therefore, it is difficult to know whether the findings resulted from exercise intensity or exercise type (i.e., continuous vs. interval). To our knowledge, no previous studies examined the effect of exercise intensity, using a fixed exercise type, on HRV response and long-term response (> 24 hr) after exercise. Therefore, the aim of the present study was to investigate the postexercise influence of two exercise intensities, applied as interval exercise, on HRV response. We were interested in the response over 72 hr after exercise cessation and the contrast in the responses following different exercise intensities.
Method Participants Sixteen (14 men and 2 women) experienced runners (M training = 8.8 years, SD = 5.3; M age = 28 years, SD = 8; M body mass 73.8 kg, SD = 8.6; M body height = 176 cm, SD = 7.9; M maximal oxygen uptake = 52.2 mL×kg-1×min-1, SD = 7.1; M basal systolic blood pressure = 129 mmHg, SD = 7; M basal diastolic blood pressure = 76 mmHg, SD = 6) involved in regular endurance training sessions (M = 3.7 session.wk¹, SD = 1.1) from a university population volunteered to participate. All participants completed a health screening and were fully informed of the nature of the study. Participants provided written consent to participate. The University Research Ethics Committee approved all procedures. Participants had no history of diabetes, hypertension, or cardiovascular disease, no symptoms of underlying disease, and received no medication during the course of the study for any diagnosed condition. Procedures A moderate (MOD) and severe (SEV) intensity condition were administered in a counterbalanced order within a repeated measures design. Both conditions consisted of six 800-m bouts of running with 3-min recovery intervals.
534
James.indd 534
Participants completed the MOD at 90% of the velocity at gas exchange threshold (v-GET). They completed the SEV at a velocity corresponding to 1 km×h-1 below the velocity at maximal oxygen uptake (v-VO2max). The MOD and SEV intensities equated to 75 and 95% VO2max, respectively, in accordance with previous findings (James & Doust, 1999). A minimum of 72 hr separated each condition, and participants performed no exercise for 72 hr prior to the first test in each condition. At 1 hr prior to (-1 hr) and at various periods following (+1 hr, +24 hr, +48 hr, +72 hr) each interval exercise session, participants sat quietly for 20 min while HRV and blood pressure were recorded. Participants were instructed not to consume alcohol or caffeine for 24 hr prior to each assessment and not to consume food or fluid other than water “ad libitum” 4 hr prior to each assessment. In addition to performing no exercise for 72 hr prior to the first assessment, participants were instructed to perform no exercise between subsequent assessments. All tests were conducted at the same time of day in a temperature-controlled (M temperature = 19º C, SD = 2.0; M humidity = 34%, SD = 6; M barometric pressure = 766.2 mmHg, SD = 7.7) exercise physiology laboratory. Prior to the first condition, participants visited the laboratory for familiarization with procedures for determining HRV and blood pressure outcomes. In addition, participants’ anthropometric and physiological characteristics were assessed, including vGET and v-VO2max. According to the Task Force of the European Society of Cardiology (1996) various indexes are used to assess HRV, which can be divided into two major categories: time-domain indexes and frequency-domain indexes. In the present investigation, time-domain indexes were the mean normal-to-normal intervals (MNN) between adjacent QRS complexes, the standard deviation of the NN intervals (SDNN), square root of the mean sum of squares of the differences between adjacent NN intervals (rMSSD), and proportion of pairs of adjacent NN intervals differing by more than 50 ms (pNN50). The frequency domain indexes were: high (HF), HF in normalized units (HFnu), low (LF), LF in normalized units (LFnu), very low (VLF), total power (TP), and the LF:HF ratio. Procedures regarding HRV assessment (i.e., points at -1 hr, +1 hr, +24 hr, +48 hr, and +72 hr) have been detailed in previous studies (James et al., 2002; James, Reynolds, & MaldonadoMartin, 2010). Previous investigations showed that HRV measures obtained with the Polar S810 and accompanying software had no appreciable bias or additional random error compared with criterion measures (Nunan et al., 2009). Furthermore, some data suggested that the stability of HRV measures may persist for months and years (Task Force of The European Society of Cardiology, 1996). During a further 5-min period at each time point, participants continued to sit quietly while three repeat arterial blood pressure measurements were taken using a
RQES: December 2012
12/4/2012 1:40:08 PM
James, Munson, Maldonado-Martin, and De Ste Croix
RQES: December 2012
James.indd 535
the natural logarithmic function prior to statistical analysis. The logarithmic transformation provides data that meet the assumptions required for parametric statistical analysis (Pober et al., 2004). Consistent with James et al. (2002), all data are presented as means and 68% confidence intervals, as it is not possible to “back-transform” a log-transformed standard deviation into the original measurement unit. Statistical Analysis We explored interactions between condition (SEV or MOD) and time (-1 hr, +1 hr, +24 hr, +48 hr, +72 hr) using a 2 x 5 fully repeated measures analysis of variance (ANOVA). Regardless of whether a significant interaction was present, we also examined in main effect for time, as we were interested in the response following each condition. Thus, we conducted one-way repeated measures ANOVAs for each condition. When significant main effects were observed (i.e., p < .05), we conducted post hoc t tests to locate the differences. Power analysis calculations indicated that a sample size of 12 was sufficient to provide an estimated power of .83 at the .05 α level.
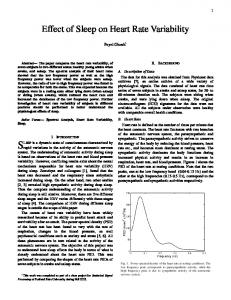
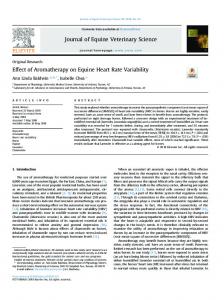
Results Heart rate responses to MOD and SEV interval exercise bouts are shown in Figure 1. Mean and 68% confidence interval for heart rates during the MOD exercise demonstrated a slight increase from 131 (123–139) to 139 (128–150) b×min¹ across the 800-m bouts (i.e., 68–72 % HRmax). Heart rate during the severe exercise increased significantly (p < .01) from 165 (156–174) to
200 Mean Heart Rate (b•min-¹)
clinical grade automated sphygmomanometry (DynaPulse DP-200M, Pulse Metric Inc., San Diego, CA) according to the approach of Forjaz, Matsudaira, Rodrigues, Nunes, and Negrao (1998) with 2 min between each measurement. Collected data were transmitted electronically to a computer for storage and analysis (DynaPulse software version 3.8). The progressive exercise test and two interval exercise sessions were conducted on a motorized treadmill (Ergo ELG 70, Woodway, Weil am Rhein, Germany) and laboratory air was circulated using a floor-mounted fan. Prior to the progressive exercise test, participants performed a 5-min warm-up at a self-selected speed below v-GET and completed their personal stretching routine. In accordance with the recommendations of Buchfuhrer et al. (1983), starting speed was selected so that participants reached exhaustion at 10 ± 2 min. Participants initiated running when the treadmill had reached the predetermined start speed of 8 km×h¹. After 2 min at the first speed, treadmill speed increased 1.2 km×h¹×min¹ (0.16 km×h¹ every 8 s) at a 0% gradient. We used the progressive exercise test to determine VO2max, v-VO2max, GET, v-GET and maximum heart rate (HRmax). Throughout the test, HR was measured using a two-electrode chest strap that transmitted data by coded short-range telemetry to a watch receiver (S810i series, Polar Electro Oy, Kempele, Finland) for storage. During the progressive test, participants’ expired gas was collected continuously and analyzed using a conventional Douglas bag technique (James, Sandals, Draper, & Wood, 2007). The procedure for determining VO2max, GET, and the associated velocities was described previously (James, Sandals, Draper, & Wood, 2007). The NN interval data were analyzed using HRV Analysis Software (version 1.1 for Windows, Biomedical Signal Analysis Group, University of Kuopio, Finland; Niskanen, Tarvainen, Ranta-Aho, & Karjalainen, 2004). Consistent with previous studies (James et al., 2002; Pober et al., 2004), we selected a continuous 5-min data segment for analysis because spectral approaches are conventionally performed on stationary records of 200–500 consecutive heart beats (Cerutti, Bianchi, & Mainardi, 1995). NN intervals were at a steady level, which is a requirement for spectral analysis (Brenner, Thomas, & Shephard, 1998). Power spectrum analysis was conducted using the autoregressive method. Frequency bands were selected conventionally (Task Force of The European Society of Cardiology, 1996): VLF = 0.00–0.04 Hz, LF = 0.04–0.16 Hz, and HF = 0.16–0.40 Hz. TP and the LF:HF ratio were also computed. The LF and HF power components were expressed using normalized units (nu) providing a relative value for each. HRV outcomes in the frequency domain are not normally distributed (Bigger et al., 1992). So, consistent with the approach of Bernardi et al. (1997) and James et al. (2002), these data were transformed using
180 160 140 120 100
Moderate Severe
1
2
3
4
5
6
Exercise Bout
Figure 1. Heart rate response for moderate and severe intensity exercise bouts. Data are presented as group heart rates for each 800-m bout (means and 68% confidence intervals); the difference between moderate and severe condition for each bout is p < .01; increases for the severe condition occur between Bouts 1 and 2 and Bouts 2 and 3.
535
12/4/2012 1:40:08 PM
James, Munson, Maldonado-Martin, and De Ste Croix
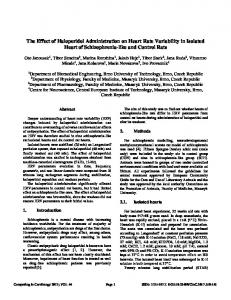
178 (167–189) b.min¹ across bouts (i.e., 86–93% HRmax). Data for the time- and frequency-domain HRV parameters are presented in Table 1. Interactions between condition and time were revealed for SDNN, rMSSD, and pNN50 but not for MNN (time domain outcomes). Post hoc analysis revealed lower values for SEV than MOD at +1 h (p < .01) for all timedomain outcomes (MNN = 11%; SDNN = 31%; rMSSD = 12%; pNN50 = 55%). There were main effects for time or SEV for all time-domain outcomes (p < .001) but not MOD. Compared to values at -1 hr, values at +1 hr were significantly (p < .001) decreased for SEV (MNN = 20%, SDNN= 39%, rMSSD = 54%, and pNN50 = 68%), but values returned to baseline levels by +24 hr (see Table 1). There was a significant interaction (p = .001) between condition and time for the frequency-domain outcomes for TP. The value at +1 hr was significantly lower (50%, p = .003) for SEV (404 ms²) than MOD (810 ms²; frequency domain outcomes). There was a main effect for time for SEV for TP (p < .001), HFms2 (p < .001), LFnu (p = .003), and HFnu (p = .021), with post hoc analysis revealing a
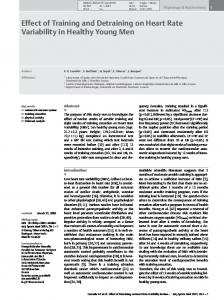
significant decrease for TP (64%, p < .001), HFms2 (78%, p < .001), and HFnu (47%, p = .008), respectively, and a significant increase for LFnu (42%, p = .007) between -1 hr and +1 hr. However, all these values had returned to baseline by +24 hr. There was no Condition x Time interaction (see Table 1). There was no interaction between condition and time and no main effects for time for the LF: HF ratio (see Table 1). Although there was no interaction between condition and time for either systolic or diastolic blood pressures, there was a main effect for time for systolic blood pressure for SEV exercise, with post hoc analysis indicating a significant decrease (7%, p = .001) at +1 hr compared with -1 hr. However, values had returned to baseline by +24 hr (see Table 2).
Discussion Although an increasing number of studies have investigated the HRV response following a single exercise bout,
Table 1. Time and frequency domain heart rate parameters prior to and following moderate and severe intensity exercise TD Condition -1 hr +1 hr +24 hr MNN (ms) SDNN (ms) rMSSD (ms) pNN50 (%) FD TP (ms²) LF (ms²) HF (ms²) LF (nu) HF (nu) LF:HF
+ 48 hr
MOD SEV MOD SEV MOD SEV MOD SEV
975 (826–1125) 979 (871–1088) 68 (38–98) 72 (45–100) 65 (24–106) 72 (30–114) 33 (9–58) 41 (14–67)
876 (714–1038) 780 (697–862)† 64 (34–93) 44 (27–60)†,‡ 58 (14–102) 33 (16–51)†,‡ 29 (3–55) 13 (0–27)†,‡
999 (832–1167) 1001 (846–1157) 60 (39–81) 68 (38–97) 58 (26–90) 66 (23–108) 32 (8–57) 36 (9–62)
970 (818–1121) 1001 (863–1139) 68 (29–108) 72 (39–104) 60 (25–96) 74 (25–123) 32 (7–57) 39 (12–66)
MOD SEV MOD SEV MOD SEV MOD SEV MOD SEV MOD SEV
921 (413–2055) 1138 (555–2329) 463 (233–923) 478 (291–784) 323 (88–1182) 360 (78–1670) 0.55 (0.29–0.80) 0.50 (0.16–0.84) 0.44 (0.16–0.71) 0.49 (0.14–0.83) 2.57 (-0.29–5.43) 3.43 (-1.47–8.33)
810 (345–1902) 404 (176–930)†,‡ 407 (213–779) 280 (122–643) 220 (36–1362) 80 (19–341)† 0.55 (0.24–0.86) 0.71 (0.48–0.94)† 0.42 (0.13–0.71) 0.26 (0.4–0.49)† 9.05 (-12.81–30.90) 18.19 (-21.89–57.46)
886 (447–1756) 927 (422–2037) 375 (182–774) 394 (230–675) 284 (56–1442) 226 (34–1493) 0.54 (0.25–0.83) 0.51 (0.16–0.86) 0.44 (0.16–0.72) 0.46 (0.12–0.80) 8.79 (-15.03–32.61) 21.86 (-49.28–93.00)
877 (402–1911) 1016 (422–2450) 445 (199–996) 382 (199–732) 242 (51–1157) 381 (90–1616) 0.56 (0.27–0.86) 0.43 (0.09–0.77) 0.41 (0.13–0.69) 0.53 (0.20–0.85) 8.45 (-12.88–29.79) 2.30 (-0.56–5.16)
+72 hr
989 (817–1162) 987 (837–1137) 67 (35–100) 71 (43–100) 65 (22–108) 69 (29–108) 31 (6–56) 38 (15–62)
ANOVA (p) 1-way 2-way .069 < .001** .676 < .001** .688 < .001** .858 < .001**
.098
855 (331–2367) .951 1064 (444–2551) < .001** 444 (197–1000) .873 487 (232–1021) .401 306 (70–1330) .695 341 (94–1234) < .001** 0.53 (0.24–0.83) .977 0.50 (0.20–0.80) .003** 0.44 (0.15–0.74) .969 0.39 (0.07–0.71) .02** 2.55 (-0.10–5.21) .595 2.45 (-0.30–5.19) .321
.00*
.029* .025* .007*
.354 .130 .095 .197
.519
Note. TD = time; ANOVA = analysis of variance; MNN = mean N-N interval; MOD = moderate; SEV = severe; SDNN = standard deviation of N-N interval; rMSSD = square root of the mean sum of squares of the differences between adjacent N-N intervals; pNN50 = proportion of pairs of adjacent N-N intervals differing by more than 50 ms; FD = frequency domain; TP = total power; LF = low frequency component of power spectrum; HF = high frequency component of power spectrum; LF:HF = ratio between LF and HF power; nu = normalized units; data are presented as means and (68% confidence interval). *Significant interaction (Condition x Time) (p < .05). **Significant main effect for time (p < .05). †Significantly different from -1 hr value (p < .05). ‡Significantly different from moderate intensity condition (p < .05).
536
James.indd 536
RQES: December 2012
12/4/2012 1:40:08 PM
James, Munson, Maldonado-Martin, and De Ste Croix
most included either one exercise intensity (Heffernan et al., 2006; Pober et al., 2004; Raczak et al., 2005). Those that included different intensities (Gladwell et al., 2010; Mourot et al., 2004; Parekh & Lee, 2005; Seiler et al., 2007) did not assess HRV after long-term recovery (i.e., > 24 hr). This growing body of evidence is further compounded, for comparative purposes, by the diverse range of exercise bouts and methodological differences among the studies. Therefore, in the present study we explored the influence of exercise intensity alone on the postexercise HRV response in a controlled design. The findings of the present study suggest that SEV exercise reduced indicators of parasympathetic influence on the heart (MNN, SDNN, rMSSD, pNN50, HF, HFnu) and increased an indicator of sympathetic influence (LFnu) at +1 hr following the exercise bout. Interestingly, these changes were observed in the presence of a reduction in systolic blood pressure. All changes were reversed by +24 hr, and values remained constant at +24 hr, +48 hr, and +72 hr at the baseline (i.e., -1 hr) level. The results confirm those from previous studies (Gladwell et al., 2010; Seiler et al., 2007) with a greater sympathetic influence postexercise (and a potential increased risk of cardiac events) at SEV intensity. However, this vagal withdrawal reverses in less than +24 hr and persists 48 hr and 72 hr postexercise. Although a cautious approach might be necessary in higher risk populations, particularly when exercise exceeds a moderate intensity, the benefits of higher exercise intensity, with a demonstrated cardioprotective influence (as presented in many studies with cardiac patients and nonpathological populations, including athletes) outweigh the risks of cardiac events via a decrease in parasympathetic activity postexercise (Gladwell et al., 2010; Haskell et al., 2007; Piepoli et al., 2011). An increase in sympathetic influence on the heart between 5 min and 1 hr postexercise was noted in a number of studies (Bernardi et al., 1997; Gladwell et al., 2010; Heffernan et al., 2006; Mourot et al., 2004; Seiler et al.,
2007). A number of studies also noted a decrease in parasympathetic influence on the heart between 15 min and 1 hr postexercise with a decrease in the HF component of the total power spectrum consistently observed (Bernardi et al., 1997; Gladwell et al., 2010; Heffernan et al., 2006; Mourot et al., 2004). Reductions in other indicators of parasympathetic influence were also observed, including HFnu (Furlan et al., 1993; Heffernan et al., 2006) and SDNN (Bernardi et al., 1997; James et al., 2002). In the present study, it is possible that the elevation in sympathetic influence and accompanying reduction in parasympathetic influence on the heart at 1 hr post SEV exercise cessation was a compensatory response to a reduced systolic blood pressure. A reduced systolic blood pressure at 1 hr following exercise cessation was reported previously in normotensive participants (MacDonald, MacDougall, & Hogben, 1999). Even with an increased sympathetic influence and associated decrease in MNN in the present study, blood pressure was not restored to baseline values. We cannot be sure that the increased heart rate (i.e., reduced MNN) provided an increased cardiac output; thus, the shortfall in systolic blood pressure at 1 hr is either a result of reduced stroke volume (and, therefore, cardiac output) or reduced vascular resistance (i.e., total peripheral resistance; TPR). A reduced stroke volume at rest has been reported following a single bout of exercise (Whyte et al., 2000), although typically such reductions have been demonstrated following prolonged exercise (Whyte et al., 2000). Reduced arterial resistance, as indicated by increased arterial diameter, was also reported at 1 hr postexercise (Studinger, Lenard, Kovats, Kocsis, & Kollai, 2003). Vasodilatation works to decrease TPR and blood pressure in blood vessels modulated by local paracrine agents from endothelial cells (e.g., nitric oxide). For example, Rognmo et al. (2008) observed that nitric oxide bioavailability increased significantly after a single bout of high-intensity exercise and decreased to baseline levels after 24 hr.
Table 2. Blood pressure responses prior to and following moderate and severe intensity bouts of exercise Variable
Condition
-1 hr
+1 hr
Systolic (mmHg) Systolic (mmHg) Diastolic (mmHg) Diastolic (mmHg)
MOD
127 (119–135)
SEV
130 (122–130)
MOD
76 (67–83)
74 (67–81)
SEV
74 (67–81)
73 (66–80)
+24 hr
+48 hr
+ 72 hr
ANOVA (p) 1-way 2-way
122 (114–130) 127 (115–139)
125 (113–137)
127 (115–139)
0.120
121 (115–127)* 128 (122–134)
129 (120–138)
127 (117–137)
0.001**
74 (65–83)
74 (64–84)
75 (65–85)
0.645
76 (68–84)
74 (67–81)
78 (68–88)
0.112
0.401
0.492
Note. ANOVA = analysis of variance; MOD = moderate; SEV = severe; data are presented as means and (68% confidence intervals). *Significantly different from value at -1 hr (p < .05). **Significant effect for time (p < .005).
RQES: December 2012
James.indd 537
537
12/4/2012 1:40:09 PM
James, Munson, Maldonado-Martin, and De Ste Croix
In many of thte previous studies in this area, it is difficult to determine the exact exercise intensity from the information provided, in part due to the lack of data regarding participants’ physiological response to the exercise bout. Perhaps this is not surprising, given that these studies were not primarily designed to compare responses following exercises of differing intensity. Mourot et al. (2004) compared continuous and interval exercise in which the work was fixed at 9.4 kJ.kg-1. In the present study, interval exercise was conducted at 1 km·h-1 below the velocity at VO2max (i.e., severe intensity, 95% VO2max) and 90% of the velocity at GET (i.e., moderate intensity, 75% VO2max), respectively. It was important that the exercise was genuinely at MOD and SEV intensities to ensure significantly different intensities in the two conditions. The physiological responses to exercise at these two intensities confirmed the differing nature of the physiological challenge, in which participants attained 86–93% HRmax in the SEV condition as opposed to 68–72% HRmax in the MOD condition. It was particularly important to ensure participants completed the MOD condition at a speed below that attained at gas exchange threshold. In summary, findings from the present study demonstrate a clear intensity effect on the postexercise HRV response, in which SEV resulted in a reduced parasympathetic influence on heart rhythm at 1 hr after exercise cessation. In contrast, MOD resulted in no change in either sympathetic or parasympathetic influence on the heart. Considering that all changes were reversed by +24 hr and values remained constant at +24 hr, +48 hr, and + 72 hr from baseline (i.e., -1 hr), the known benefits of higher intensity exercise outweigh the risks of cardiac events via a decrease in parasympathetic activity in the postexercise period following an SEV bout. Future studies should explore the time course of heart rate variability response following severe intensity exercise, particularly between 1 and 24 hr following exercise cessation.
References Bernardi, L., Passino, C., Robergs, R., & Appenzeller, O. (1997). Acute and persistent effects of a 46-kilometer wilderness trail run at altitude: Cardiovascular autonomic modulation and baroreflexes. Cardiovascular Research, 34, 273–280. Bigger, J. T., Jr., Fleiss, J. L., Steinman, R. C., Rolnitzky, L. M., Kleiger, R. E., & Rottman, J. N. (1992). Correlations among time and frequency domain measures of heart period variability two weeks after acute myocardial infarction. American Journal of Cardiology, 69, 891–898. Brenner, I. K., Thomas, S., & Shephard, R. J. (1998). Autonomic regulation of the circulation during exercise and heat exposure. Inferences from heart rate variability. Sports Medicine, 26, 85–99. Buchfuhrer, M. J., Hansen, J. E., Robinson, T. E., Sue, D. Y., Wasserman, K., & Whipp, B. J. (1983). Optimizing the exercise
538
James.indd 538
protocol for cardiopulmonary assessment. Journal of Applied Physiology, 55, 1558–1564. Cerutti, S., Bianchi, A. M., & Mainardi, L. T. (1995). Spectral analysis of the heart rate variability signal. In M. Malik & A. J. Camm (Eds.), Heart rate variability (pp. 63–74). New York: Futura Publishing Company. Forjaz, C. L., Matsudaira, Y., Rodrigues, F. B., Nunes, N., & Negrao, C. E. (1998). Postexercise changes in blood pressure, heart rate and rate pressure product at different exercise intensities in normotensive humans. Brazilian Journal of Medical and Biological Research, 31, 1247–1255. Furlan, R., Piazza, S., Dell’Orto, S., Gentile, E., Cerutti, S., Pagani, M., & Malliani, A. (1993). Early and late effects of exercise and athletic training on neural mechanisms controlling heart rate. Cardiovascular Research, 27, 482–488. Gladwell, V. F., Sandercock, G. R. H., & Birch, S. L. (2010). Cardiac vagal activity following three intensities of exercise in humans. Clinical Physiology and Functional Imaging, 30, 17–22. Haskell, W. L., Lee, I. M., Pate, R. R., Powell, K. E., Blair, S. N., Franklin, B.A.,...Bauman, B. A. (2007). Physical activity and public health: Updated recommendation for adults from the American College of Sports Medicine and the American Heart Association. Medicine & Science in Sports & Exercise, 39, 1423–1434. Hautala, A., Tulppo, M. P., Makikallio, T. H., Laukkanen, R., Nissila, S., & Huikuri, H. V. (2001). Changes in cardiac autonomic regulation after prolonged maximal exercise. Clinical Physiology, 21, 238–245. Heffernan, K. S., Kelly, E. E., Collier, S. R., & Fernhall, B. (2006). Cardiac autonomic modulation during recovery from acute endurance versus resistance exercise. European Journal of Cardiovascular Prevention & Rehabilitation, 13, 80–86. James, D. V., Barnes, A. J., Lopes, P., & Wood, D. M. (2002). Heart rate variability: Response following a single bout of interval training. International Journal of Sports Medicine, 23, 247–251. James, D. V., & Doust, J. H. (1999). Oxygen uptake during high-intensity running: Response following a single bout of interval training. European Journal of Applied Physiology, 79, 237–243. James, D. V., Reynolds, L. J., & Maldonado-Martin, S. (2010). Influence of the duration of a treadmill walking bout on heart rate variability at rest in physically active women. Journal of Physical Activity & Health, 7, 95–101. James, D. V., Sandals, L. E., Draper, S. B., & Wood, D. M. (2007). Relationship between maximal oxygen uptake and oxygen uptake attained during treadmill middle-distance running. Journal of Sports Sciences, 25, 851–858. Lown, B., & Verrier, R. L. (1976). Neural activity and ventricular fibrillation. The New England Journal of Medicine, 294, 1165–1170. MacDonald, J., MacDougall, J., & Hogben, C. (1999). The effects of exercise intensity on post exercise hypotension. Journal of Human Hypertension, 13, 527–531. Mourot, L., Bouhaddi, M., Tordi, N., Rouillon, J. D., & Regnard, J. (2004). Short- and long-term effects of a single bout of exercise on heart rate variability: Comparison between constant and interval training exercises. European Journal of Applied Physiology, 92, 508–517.
RQES: December 2012
12/4/2012 1:40:09 PM
James, Munson, Maldonado-Martin, and De Ste Croix
Niskanen, J. P., Tarvainen, M. P., Ranta-Aho, P. O., & Karjalainen, P. A. (2004). Software for advanced HRV analysis. Computer Methods & Programs in Biomedicine, 76, 73–81. Nunan, D., Donovan, G., Jakovljevic, D. G., Hodges, L. D., Sandercock, G. R., & Brodie, D. A. (2009). Validity and reliability of short-term heart rate variability from the Polar S810. Medicine & Science in Sports & Exercise, 41, 243–250. Parekh, A., & Lee, C. M. (2005). Heart rate variability after isocaloric exercise bouts of different intensities. Medicine & Science in Sports & Exercise, 37, 599–605. Piepoli, M. F., Conraads, V., Corrá, U., Dickstein, K., Francis, D. P., Jaarsma, T.,…Ponikowski, P. (2011). Exercise training in heart failure: From theory to practice. A consensus document of the Heart Failure Association and the European Association for Cardiovascular Prevention and Rehabilitation. European Journal of Heart Failure, 13, 347–357. Pober, D. M., Braun, B., & Freedson, P. S. (2004). Effects of a single bout of exercise on resting heart rate variability. Medicine & Science in Sports & Exercise, 36, 1140–1148. Raczak, G., Pinna, G. D., La Rovere, M. T., Maestri, R., Danilowicz-Szymanowicz, L., Ratkowski, W.,...Ambroch-Dorniak, K. (2005). Cardiovagal response to acute mild exercise in young healthy subjects. Circulation Journal, 69, 976–980. Rognmo, O., Bjørnstad, T. H., Kahrs, C., Tjønna, A. E., Bye, A., Haram, P. M., Stølen, T.,…Wisløff, U. (2008). Endothelial function in highly endurance-trained men: Effects of acute exercise. The Journal of Strength & Conditioning Research, 22, 535–542. Seiler, S., Haugen, O., & Kuffel, E. (2007). Autonomic recovery after exercise in trained athletes: Intensity and duration effects. Medicine & Science in Sports & Exercise, 39, 1366–1373.
RQES: December 2012
James.indd 539
Studinger, P., Lenard, Z., Kovats, Z., Kocsis, L., & Kollai, M. (2003). Static and dynamic changes in carotid artery diameter in humans during and after strenuous exercise. The Journal of Physiology, 550, 575–583. Swain, D. P., & Franklin, B. A. (2006). Comparison of cardioprotective benefits of vigorous versus moderate intensity aerobic exercise. American Journal of Cardiology, 97, 141–147. Task Force of The European Society of Cardiology and The North American Society of Pacing and Electrophysiology. (1996). Heart rate variability: Standards of measurement, physiological interpretation, and clinical use. Circulation, 93, 1043–1065. Terziotti, P., Schena, F., Gulli, G., & Cevese, A. (2001). Postexercise recovery of autonomic cardiovascular control: A study by spectrum and cross-spectrum analysis in humans. European Journal of Applied Physiology, 84, 187–194. W hyte, G. P., George, K., Sharma, S., Lumley, S., Gates, P., Prasad, K., & McKenna, W. J. (2000). Cardiac fatigue following prolonged endurance exercise of differing distances. Medicine & Science in Sports & Exercise, 32, 1067–1072.
Authors’ Note Please address correspondence concerning this article to Sara Maldonado-Martin, Laboratory of Performance Analysis in Sport, Department of Physical Education and Sport, Faculty of Physical Activity and Sport Sciences, University of the Basque Country (UPV/EHU), Lasarteko Atea, 71, 01007 Vitoria-Gasteiz, Araba-Alava, Basque Country, Spain. E-mail:
[email protected]
539
12/4/2012 1:40:09 PM