GERARD J. KLEYWEGT* AND T. ALWYN JONES. Department of Molecular Biology, Biomedical Centre, Uppsala University, Box 590, S-751 24 Uppsala, ...
829
Acta Co'st. (1996). D52, 829-832
Efficient Rebuilding of Protein Structures GERARD J. K L E Y W E G T * AND
T.
ALWYN JONES
Department of Molecular Biology, Biomedical Centre, Uppsala University, Box 590, S-751 24 Uppsala, Sweden. E-mail: gerard@xray, bmc. uu. se (Received 24 July 1995; accepted 7 Februar3' 1996)
Abstract A computer program, called OOPS, is described which facilitates and speeds up the process of rebuilding a protein structure inside its electron density and reduces the chances of local errors persevering throughout the crystallographic protein structure determination process. The program uses a set of criteria to judge how reasonable each protein residue is and it generates macros for the macromolecular crystallographic modelbuilding program O [Jones, Zou, Cowan & Kjeldgaard (1991). Acta Co, st. A47, 110-119] which, when executed, will take the crystallographer on a journey along all suspect residues.
1. Introduction Building and rebuilding of protein structures into electron-density maps is a time-consuming, errorprone and often tedious chore. Assuming that the chain of the protein has been traced correctly, there still looms the very real danger of smaller local errors in the structure (Br/ind6n & Jones, 1990; Kleywegt & Jones, 1995). Three types of common errors at the residue level are: a poor fit of the model to the data, violations of common-sense chemistry and stereochemistry, disagreement with statistical data on protein structure. In order to recognise and, if possible, correct such errors, for every residue in the protein, questions typically to be addressed include: does this residue fit the local electron density? Does it have reasonable sidechain stereochemistry? Does it have favourable ~p, ~p main-chain torsion angles? Are there any atoms with unusually high temperature factors? Is the peptide O atom placed correctly? Is the peptide bond close to planar? Have large local shifts occurred during refinement compared to the previous or starting model? Gathering and managing all this information manually is a laborious and error-prone process: it is easy to overlook one or more suspect residues if several hundred, let alone thousand, residues need to be checked. Moreover, once the structure has been moderately well refined, the fraction of problematic residues will have become fairly small, which means that perhaps nine out of ten residues don't need to be © 1996 International Union of Crystallography Printed in Great Britain - all rights reserved
scrutinized at all (at least for the purpose of building a good protein structure). Since most of the questions one has to ask oneself for every residue can be answered by appropriate computer programs, the next logical step is to develop a program which will do just that and which uses the results to help focus the attention of the crystallographer on those residues which are suspect for one or more reasons (for instance, because they have been incorrectly built, because they suffer from disorder, or because they play a special structural role). We have written a program, called OOPS, which does just that. OOPS is tightly coupled to the macromolecular crystallographic modelbuilding program O (Jones, Zou, Cowan & Kjeldgaard, 1991). Some of the input it requires consists of so-called O data blocks (a one-dimensional array containing one attribute value for each residue). The program's major output is a set of O macros which will automatically take the crystallographer on a journey along the suspect residues. OOPS can be used to check any or all of the following criteria.
1.1. Real-space fit (RS fit) of the model to the densi~.' The real-space fit value of a residue (Jones, Zou, Cowan & Kjeldgaard, 1991) is defined as the correlation coefficient (RSCC) or the R factor (RSRF) between an experimental map and the calculated electron density around that residue. Therefore, RS-fit values indicate, on a per-residue basis, how well the current model fits the data. A well refined structure at intermediate resolution (-~2-2.4,~) usually has very few residues with an RSCC value of less than 0.7. With O, RS-fit values can be calculated for all atoms of each residue, for only the main-chain atoms or for any other subset (e.g., side-chain atoms) (Jones, Zou, Cowan & Kjeldgaard, 1991). Each of these attributes can be checked by OOPS. The type of experimental map used to calculate the RS-fit values can be selected freely by the user; possible choices include conventional 2 F , - F,. and 3F,,- 2F,. maps, averaged 2F,, -F,. maps and simulated-annealing omit maps (Hodel, Kim & BriJnger, 1992). In the latter case, the RS-fit values constitute a real-space equivalent to Briinger's free R value (Brfinger, 1992b). Acta Co'stallographica Section D ISSN 0907-4449
(c) 1996
830
REBUILDING PROTEIN STRUCTURES
1.2. Main-chain geometry This includes a check of the peptide orientation (socalled pep-flip), main-chain ~0, ~p torsion angles, and the planarity of the peptide plane. The pep-flip value of a residue i is defined as follows (Jones, Zou, Cowan & Kjeldgaard, 1991): the best-fitting fragments to the zone i - 2 : i + 2 are located in a database of well refined structures; the pep-flip value, then, equals the rootmean-square (r.m.s.) distance between the carbonyl O atom of residue i and the equivalent carbonyl O atoms of the database fragments after superposition onto the zone i - 2 : i + 2. In our experience, residues with a pep-flip value which exceeds ~--2.5A merit closer inspection (this cut-off value is appropriate for the current O database; if a larger database is used, a lower cut-off value should probably be used). In such cases, most often the peptide bond has been built incorrectly (i.e., with the carbonyl O atom pointing into the opposite direction compared to the equivalent atoms in the database fragments). Alternatively, the residue may be of structural interest, since there is usually a good structural reason for a residue actually having a large pep-flip value. Pep-flip values, except for the two first and the two last residues of a polypeptide chain, can be calculated with O (Jones, Zou, Cowan & Kjeldgaard, 1991). OOPS can also check main-chain 99, ~p angle combinations to pinpoint residues that lie outside the allowed areas of the Ramachandran plot (Ramakrishnan & Ramachandran, 1965). Residues with less common qg, ~p angles are often incorrectly built (or not well defined by the data) but sometimes a residue may adopt an unusual main-chain conformation in order to enable it to play a particular structural/functional role. In some cases, incorrect ~p, ~p angles are due to a pep-flip error (flipping the peptide bond between residues i and i + 1 will change both the ~p angle of residue i and q9 angle of residue i + 1 by ,~ 180). Finally, the peptide planarity can be assessed by calculating the improper dihedral angle C i - - C T ~ N,÷ 1 - O ~ which is zero for a perfectly planar peptide. 1.3. Side-chain geometry This includes a check of unusually large rotamer sidechain (RSC) fit values (Zou & Mowbray, 1994) and of the chirality at Cc~ atoms in non-glycine residues. The RSC-fit value is defined as follows: for each residue i, the rotamer that it resembles most closely is located in a database; the RSC-fit value, then, equals the r.m.s. distance between the side-chain atoms of residue i and the corresponding atoms in the selected database rotamer, after superposition onto residue i. RSC-fit values, therefore, provide an indication of how well a residue's side-chain conformation fits with those found in a database of well refined structures and, hence, implicitly, an indication of how good the side chain's
stereochemistry is. In our experience, residues which have an RSC-fit value greater than ~-,1.5 A merit closer scrutiny (Zou & Mowbray, 1994). RSC-fit values, for all residue types except glycyl and alanyl, can be calculated with O (Jones, Zou, Cowan & Kjeldgaard, 1991). The chirality of the Cot atoms may be assessed by calculating the deviation of the improper dihedral angle C T - - N i - - C i - - C ~ from its ideal value of 33.9 ~-' (Laskowski, MacArthur, Moss & Thornton, 1993).
1.4. Temperature factors and occupancies This includes checks for residues which contain at least one atom whose temperature factor or occupancy is too high or too low (as defined by the user). For instance, high temperature factors may arise as a result of mobility, disorder, sequence heterogeneity or underdetermination in the data, but also because of a trivial error in the amino-acid sequence [see Sinning et al. (1993) for an example of this]. In addition, the r.m.s. AB value for bonded atoms can be calculated and residues with high values for this statistic flagged as suspect. For water molecules only, the so-called QualWat values (Arnold & Rossmann, 1990) can be assessed. This quantity takes both the resolution of the data and the temperature factor and occupancy of individual water molecules into account. It is defined as follows, QualWat = 100 × Q × exp[-B/(4d2)], where d is the resolution, B the temperature factor and Q the occupancy of the O atom of a water molecule. An absent water molecule would have a QualWat value of zero; a fully occupied, immobile water molecule would have a value of 100. 1.5. Mask violations If real-space electron-density averaging procedures are used, it is necessary to make sure that all atoms in the molecule are covered by the molecular envelope or mask being used. OOPS can be used to check if all atoms, given a certain radius, are covered by a mask of the type that is used in the RAVE averaging package (Jones, 1992; Kleywegt & Jones, 1994). 1.6. Comparison with another model It is often useful to compare an intermediate model to either the model as it was prior to the previous refinement round, or to the starting model, or to the structure of a related protein, or to an NCS-related molecule. OOPS can be used to compare the current model to another model, and first checks for every residue if it has newly been inserted or mutated (in both cases inspection of the density is desirable, regardless of
GERARD J. K L E Y W E G T AND T. A L W Y N JONES the values of all quality indicators). If this is not the case, the following criteria are checked. The extent to which the residue has been altered or moved during refinement (by calculating the residue r.m.s.d.). The extent to which the temperature factors have changed (by calculating r.m.s. AB for all atoms in the residue). The extent to which the occupancies have changed (by calculating r.m.s. A Q for all atoms in the residue). The extent to which the main-chain ~p, ~p torsion angles have changed {by calculating [(A~02+ A 1/z2)/2]1/2 }. The extent to which the side-chain Xl, X2 torsion angles have changed {by calculating [(Axe+ Axe)~2] I/'-, or IAxll for residues for which X2 is undefined}. 1.7. User-defined criteria The only requirements for these criteria are that they are provided to the program in the form of a numeric O data block, and that violations can be expressed as follows: 'residue i violates criterion n, if the value of this criterion for this residue is greater than (or less than) a given cut-off value'. In this fashion, it is fairly simple to include quality checks performed by other programs, for example the GeomPlot option of X-PLOR (Brfinger, 1992a), or the Directional Atomic Contact Analysis facility of Whatlf (Vriend & Sander, 1993). The auxiliary program ODBMAN (unpublished program) can be used to extract data from the output of other programs, and to create O data blocks from it. OOPS could even be used for checking NMR-based protein structures, for example by providing the program with the number of constraint/restraint violations per residue. Even simpler, the number of N O E ' s and dihedral-angle restraints for each residue could be used: if this number is low for a residue, and if the geometry of its main or side chain is unusual, then one may conclude that it is more likely that this is an artefact resulting from a lack of data than a reflection of reality. The user has to provide cut-off values for all numeric attributes, but reasonable default values are suggested by the program. OOPS takes into account that some attributes are undefined (or undefinable) for certain types of residue. For example, an N-terminal residue has no definable pep-flip value, no ( i - 1) peptide and, therefore, an undefined 99 angle: a glycine residue has undefined RS-fit values for the side-chain atoms, an undefined RSC-fit value and an achiral Ca atom. In addition, only a few attributes are defined for nonamino-acid residues such as nucleotides, nucleosides, saccharides, salt and metal ions, solvent molecules, and iigands. Depending on which criteria are included in the analysis, the input to OOPS comprises a number of O
831
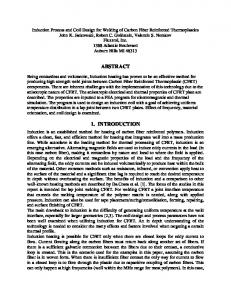
data-block files as well as a PDB file and a mask file. The output of the program consists of (a) a listing of statistics and histograms as well as plot files for most of the checked attributes; (b) a list of suspect residues, i.e. residues which violate one or more of the checked criteria; and (c) an 'electronic notebook' file (this file contains a critique of all residues; it can be edited while the crystallographer is rebuilding the model, and thus provides a record of what changes were made to the model). More important, however, is the fact that OOPS generates a set of O macro files which, when executed, will take the crystallographer on a journey along each of the possibly bad residues (see Fig. 1 for an example). When the first macro is activated from within O, it will put the first of these residues at the centre of the display. Subsequently, it will print a summary of the criteria that were violated by this particular residue. Optionally, a set of user-supplied commands is executed (for example, to display the electron-density maps and any residues in the vicinity). Finally, a command to execute the next macro is automatically put on the O menu, so that it can be executed by the crystallographer by means of a simple click of the mouse. At this stage, the user would decide what to do with this residue: edit the mask, try a different rotamer, flip the peptide around, etc'., or perhaps make a note of the fact that this residue plays an important structural role. Subsequently, a click of the mouse will activate the next macro and take the user to the second suspect residue. The final part of the program's output consists of a new O data-block file which contains a count of the number of criteria that were violated by each residue. This file can be read into O and can be used, for instance, to colour the residues in the molecule according to their degree of 'badness'. This is quite useful in itself, since it instantly reveals areas where a number of subsequent residues are problematic (for centre
zone M 6 A A5
print
Residue
print
Bad RS-fit
print
Mask
print
Too
print
Hit or type
menu menu obj
GLU A5
too high
(all atoms)
temperature
factor
"@oops/3"
@oops/3
on o n _ o f f
@oops/2
off
on off
sphere
I0 e n d
sph
= 0.408
tight = 140.12
for next
baddy
@draw_map.omac
bell
Fig. 1. Example of an O macro file generated by OOPS(line numbers have been inserted for clarity: they are not part of the actual macro). The O command on line I puts the centre of gravity of the residue under scrutiny at the centre of the display. Line 2 prints a message telling the user which residue is being shown. Lines 3.4 and 5 tell the user why the residue is suspect. Line 6 prints a message telling the user what to do in order to go to the next suspect residue. Lines 7 and 8 update the O menu. Line 9 contains user-detined commands (including a macro to draw appropriate electron-density maps) which are to be executed for every residue.
832
REBUILDING PROTEIN STRUCTURES
example, because of mobility and disorder of surface loops, or because a whole stretch of residues is not covered by the mask). A plot file of this information is also produced. We have used OOPS for quite some time now and find that it significantly reduces the time required for one rebuilding cycle. In addition to focussing the crystallographer's attention on the minority of residues (usually) which are possibly problematic, the program also draws attention to residues which actually do have unusual main or side-chain geometry. In many cases, these residues play a pivotal structural and/or functional role in the protein one is investigating. Ultimately, the quality of the final model is of course dependent on the quantity and quality of the X-ray data, although, as the resolution gets lower, the subjective judgment of the crystallographer becomes more and more important (to the point where it is possible to get even the chain trace completely wrong, at resolutions as 'high' as 2 . 4 - 2 . 8 A ) . However, using careful refinement and rebuilding procedures one can often obtain good models even at low resolution [see, for instance, the comparison of the 2.6 and 2.0 A models of human alpha-class glutathione S-transferase discussed by Kleywegt & Jones (1995)]. OOPS can assist in this process by pinpointing poor and unusual aspects of the current model. The program does not, however, suggest possible remedies; these are discussed in a more detailed paper (Kleywegt & Jones, 1996). It is important to realise that OOPS can be viewed as a quality-control tool, but when it is used as such, it cannot also be used for validating the final model. Model validation should entail the checking of aspects of the model that have not been imposed during the rebuilding and refinement process (be it explicitly, such as bond-distance restraints or NCS constraints, or implicitly, such as side-chain rotamers).
2. Software details A typical OOPS run, using a protein of --~ 150 residues and checking all criteria, takes on the order of half a minute of CPU time on an Iris Indigo. OOPS has been written in Fortran-77; it runs on Silicon Graphics Iris and Indigo as well as on Evans & Sutherland ESV and
on DEC Alpha/OSF1 workstations. OOPS is available in executable form free of charge to academic users via anonymous ftp from rigel.bmc.uu.se, directory pub/ oops. This work was supported by the Swedish Natural Science Research Council and Uppsala University. Note added in proof: the program Whatlf (Vriend & Sander, 1993) now contains a facility to produce O-style data blocks for use with OOPS and O (Hooft, 1996).
References Arnold, E. & Rossmann, M. G. (1990). J. Mol. Biol. 211, 763-801. Br~ind6n, C. I. & Jones, T. A. (1990). Nature (London), 343, 687-689. Briinger, A. T. (1992a). X-PLOR. A system for crystallography and NMR, Yale University, New Haven, CT, USA. Brtinger, A. T. (1992b). Nature (London), 355, 472-475. Hodel, A., Kim, S. H. & Briinger, A. T. (1992). Acta Cryst. A48, 851-859. Hooft, R. W. W. (1996). Personal communication. Jones, T. A. (1992). Molecular Replacement, edited by E. J. Dodson, S. Glover & W. Wolf. pp. 91-105. Warrington: Daresbury Laboratory. Jones, T. A., Zou, J. Y., Cowan, S. W. & Kjeldgaard, M. (1991). Acta Cryst. A47, 110-119. Kleywegt, G. J. & Jones, T. A. (1994). From First Map to Final Model, edited by S. Bailey, R. Hubbard & D. A. Waller, pp. 59-66. Warrington: Daresbury Laboratory. Kleywegt, G. J. & Jones, T. A. (1995). Structure, 3, 535540. Kleywegt, G. J. & Jones, T. A. (1996). Methods Enzymol. In the press. Laskowski, R. A., MacArthur, M. W., Moss, D. S. & Thornton, J. M. (1993). J. Appl. Cryst. 26, 283-291. Ramakrishnan, C. & Ramachandran, G. N. (1965). Biophys. J. 5, 909-933. Sinning, I., Kleywegt, G. J., Cowan, S. W., Reinemer, P., Dirr, H. W., Huber, R., Gilliland, G. L., Armstrong, R. N., Ji, X., Board, P. G., Olin, B., Mannervik, B. & Jones, T. A. (1993). J. Mol. Biol. 232, 192-212. Vriend, G. & Sander, C. (1993). J. Appl. Cryst. 26, 47-60. Zou, J. Y. & Mowbray, S. L. (1994). Acta Cryst. D50, 237249.