Hindawi Publishing Corporation Journal of Applied Mathematics Volume 2013, Article ID 754539, 9 pages http://dx.doi.org/10.1155/2013/754539
Research Article Electroencephalography Signal Grouping and Feature Classification Using Harmony Search for BCI Tae-Ju Lee, Seung-Min Park, and Kwee-Bo Sim School of Electrical and Electronics Engineering, College of Engineering, Chung-Ang University, Heukseok-dong, Dongjak-gu, Seoul 156-756, Republic of Korea Correspondence should be addressed to Kwee-Bo Sim;
[email protected] Received 28 June 2013; Revised 27 September 2013; Accepted 27 September 2013 Academic Editor: Zong Woo Geem Copyright © 2013 Tae-Ju Lee et al. This is an open access article distributed under the Creative Commons Attribution License, which permits unrestricted use, distribution, and reproduction in any medium, provided the original work is properly cited. This paper presents a heuristic method for electroencephalography (EEG) grouping and feature classification using harmony search (HS) for improving the accuracy of the brain-computer interface (BCI) system. EEG, a noninvasive BCI method, uses many electrodes on the scalp, and a large number of electrodes make the resulting analysis difficult. In addition, traditional EEG analysis cannot handle multiple stimuli. On the other hand, the classification method using the EEG signal has a low accuracy. To solve these problems, we use a heuristic approach to reduce the complexities in multichannel problems and classification. In this study, we build a group of stimuli using the HS algorithm. Then, the features from common spatial patterns are classified by the HS classifier. To confirm the proposed method, we perform experiments using 64-channel EEG equipment. The subjects are subjected to three kinds of stimuli: audio, visual, and motion. Each stimulus is applied alone or in combination with the others. The acquired signals are processed by the proposed method. The classification results in an accuracy of approximately 63%. We conclude that the heuristic approach using the HS algorithm on the BCI is beneficial for EEG signal analysis.
1. Introduction The brain-computer interface (BCI) is a system that connects a human brain and a machine. Without using an external control device, humans would be able to control devices such as brain-controlled mobile robots, wheelchairs, and robot manipulators [1–3] with their thoughts. Therefore, we greatly anticipate that the BCI system will become a technology not only for the average person but also for the disabled including people suffering from a neurodegenerative disorder such as amyotrophic lateral sclerosis and brainstem stroke [4]. To implement the BCI, various signal acquisition methods have been proposed. Among the various BCI systems, the electroencephalography (EEG)-type BCI is promising technology. The BCI system based on EEG does not require surgical operation and is considered as the ultimate goal of the systems for practical use because of its relative convenience [5]. Furthermore, the EEG signal has a higher temporal resolution than functional magnetic resonance imaging (fMRI) or functional near-infrared spectroscopy (f NIRS) signals. This characteristic provides the detailed states of brain activity
in a very short time. However, several restrictions exist in the use of the EEG signals in the BCI system. Although the EEG signal has a high temporal resolution, it has very poor spatial resolution. If we want to observe the details of the brain state in a small area, we have to use many electrodes on the scalp, which will result in channel increment; that is, channel increment is an ineluctable requirement and induces a “curse of dimensionality.” Similar to other systems, the BCI system consists of three stages: sensing, signal processing, and applications. The brain-wave signal from a sensor is used for the application according to the class of the signal. The curse of dimension causes a problem in signal processing, which adds more complexity, increases the computational time, and complicates the classification. To avoid a high-dimensional computational problem resulting from the use of many channels, existing research suggests two primary methods: the multimodal integration method [6, 7] and the channel-selection method. The first method, which combines several signals, requires the solution to several limitations. fMRI or f NIRS requires
2 a larger space for the equipment, and building the entire system is expensive [8]. Further, the multimodal experimental method can be potentially contaminated [9]. On the other hand, the channel-selection method is a preferable and convenient method although some data are dropped. This method restricts the channels using the brain area or mathematical models [10–12]. However, this method focuses only on one stimulus at a time. Therefore, it cannot handle simultaneous stimuli in the human brain. The BCI system that employs the EEG signal for actual use overcomes the disadvantage of the curse of dimension. In the BCI system, the performance is dependent on feature extraction and classification. From the raw-data signal, we can extract the EEG features. In this process, the common spatial pattern (CSP) algorithm is commonly used as a feature extraction algorithm [13, 14]. In the classification, even though many approaches have been attempted and the support vector machine (SVM) is preferred [15–17], a dominant algorithm is absent. The linear discriminant analysis and the original SVM algorithm are linear classifications, and their performance in nonlinear EEG signal analysis is poor. The SVM algorithm with a kernel function is not only redundant when the dimension becomes higher but also difficult in unsupervised cases. The artificial neural network is powerful and can classify nonlinear data; however, it suffers from a weakness because the length of time needed for learning cannot be approximated. Thus, a new approach to BCI feature classification is needed. The present paper presents a solution to the two problems of conventional channel selection and feature classification using the harmony search (HS) algorithm, a music-inspired metaheuristic algorithm. The metaheuristic algorithm finds the solution using rules and randomness; thus, it does not require too many computational resources [18]. In nondeterministic polynomial-time hard (NP-hard) problems, we can solve the problem using the heuristic algorithm faster than that using the exact computational method. The HS algorithm, one of the nature-inspired heuristic algorithms, possesses advantages that are not available in the other heuristic algorithms. HS can maintain diversity; thus, the search solution effectively and easily escapes from the local optimum [19]. In addition, the HS algorithm is easy to use, has a simple structure, and requires only two parameters. By using the HS algorithm, we can determine the group of EEG signal channels to eliminate the restriction of the curse of dimension in signal processing and develop a classification for BCI system applications. In Section 2, we present the theoretical background of the HS and feature extraction algorithms. In Section 3, we show the proposed methods. Sections 4 and 5 present the experiment and analysis of the channel grouping and classification. We conclude this paper in Section 6.
2. Theoretical Background 2.1. Harmony Search Algorithm. As the name suggests, the HS algorithm originates from musical harmony [20]. If we assume that the variables are the instruments, the pitches of
Journal of Applied Mathematics the instruments are the values of the variables. Similar to the orchestra player who determines the harmony to create a good balance, the HS algorithm searches the best state of a given problem defined by an objective function. The HS algorithm has a harmony memory (HM) that saves the previous results, and its structure is described in a matrix form: 𝑥11 [ 2 [ 𝑥1 [ . [ . [ . [𝑥1
HMS
𝑥21 𝑥22 .. .
... ...
1 𝑥𝑁 2 𝑥𝑁 .. .
] ] ], ] ]
(1)
HMS 𝑥2HMS . . . 𝑥𝑁 ]
where 𝑥𝑛𝑖 is the selected solution of the 𝑛th variable, HMS is the HM size, and 𝑁 is the number of variables. The HM obtains the latest best result; thus, the HM members change when the result of the new value is better than the worst result in the HM. The new value is selected in three ways: selected by HM, randomly selected from the range of possible solutions, or selected by a local area search called the pitch adjustment. The selection by the HM is performed using the HM consideration rate (HMCR). The pitch adjustment, a mutation of the HM member, also has an occurrence rate, which is called the pitch adjustment rate (PAR). The random search and the pitch adjustment prevent premature convergence and maintain the diversity of the solution. These processes are represented as follows: 𝑥𝑛New 𝑥𝑛 ∈ {𝑋𝑛 , 𝑋 is possible solution} w.p. 𝑅Random { { { ← {𝑥𝑛 ∈ {𝑥1 , 𝑥2 , . . . , 𝑥HMS } w.p. 𝑅Memory 𝑛 𝑛 𝑛 { { 𝑖 𝑥 ± 𝑚 w.p. 𝑅pitch , { 𝑛 (2) where 𝑚 is the pitch adjustment size, and 𝑅Random , 𝑅Memory , and 𝑅pitch are the probability of the random search, HMCR, and PAR, respectively. 2.2. Parameter-Setting-Free Harmony Search. In the basic HS algorithm principle, we use several parameters, namely, HMS, HMCR, and PAR. Generally, the HMS value ranges from 10 to 100. Although this value depends on the iteration number, the result is not sensitive to the HMS. In contrast, the HMCR and PAR control the result of the HS algorithm. To select a proper parameter value, some investigations have been conducted [21, 22]. The parameter-setting-free (PSF) HS proposed by Geem and Sim [23] is one of the parameter control methods for automatic selection of the parameters. This method uses one more memory to represent the method that generates the HM values. The memory is the same as that of the HM. Then, we obtain the new parameter values on the basis of the following equations: HMCR𝑛 = PAR𝑛 =
Number of 𝑥𝑛 made by “random selection” HMS
Number of 𝑥𝑛 made by “pitch adjustment” . HMS
(3)
Journal of Applied Mathematics
3
In each iteration time, the PSF HS calculates the HMCR and PAR. Then, we obtain the proper adaptive parameters. Using this PSF technique, the value to be initialized is only the HMS. 2.3. Common Spatial Patterns. The CSP algorithm is one of the useful methods for feature extraction of the EEG signals. For two different classes 𝑐1 and 𝑐2 , we obtain multiple spatial filters that maximize the variance of one class and minimize that of the other class. The spatial filter matrix 𝑊 is obtained by solving the following equation [24]: w∗ = arg max { w∈𝑅𝑁
wT 𝑅s|𝑐1 w wT 𝑅s|𝑐2 w
},
(4)
where 𝑅s|𝑐1 and 𝑅s|𝑐2 are the covariance matrices of signal s given in each class. The 𝑊 matrix consists of 𝐿 eigenvectors of w∗ . Thus, the final goal of the CSP is to obtain the linear transform ̂s, which is represented by the following equation: ̂s = 𝑊T s.
(5)
3. Methodology 3.1. Mean Square Error and Euclidean Matrices. To derive the objective function, the mean square error (MSE) and the Euclidean distances were used. The MSE matrix was used for grouping the EEG channels. A low MSE means that the two signals are almost the same. Moreover, if the MSE is zero, the two signals are the same. Therefore, the group with a minimum MSE has similar characteristics and can be regarded to have the same reaction for the same stimulus. For the grouping of the signals, we first normalized the EEG data acquired from 64 channels. We divided the EEG signals with the maximum values in each channel. Then, the elements in the 𝑗th row and 𝑘th column of the MSE matrix were represented as follows (here, the diagonal members of the MSE matrix were zero): MSE𝑗,𝑘 =
2 1 ∑{𝑠 (𝑡) − 𝑠𝑘 (𝑡)} T 𝑡 𝑗
where 𝑗, 𝑘 = 1, 2, . . . , 64. (6)
In (6), 𝑠𝑗 (𝑡) and 𝑠𝑘 (𝑡) are the normalized signal vectors of the𝑗th and 𝑘th channels at time 𝑡, respectively. For the feature extraction, we used the Euclidean distance matrix. Similar to grouping, we assumed that the same class members were located close to one another. From this assumption, we determined the group with the shortest overall distance. After feature extraction was completed, the features were expressed in a vector space. Then, the (𝑗, 𝑘) elements of the Euclidean distance matrix were represented as follows (the diagonal of the MSE matrix is zero, and 𝑠∗ represents the mean feature vector in the 𝐿-𝐷 space): Dist𝑗,𝑘 = 𝑠𝑗∗ − 𝑠𝑘∗ where 𝑗, 𝑘 = 1, 2, . . . , 𝐿. (7) 2 3.2. Minimum-Seeking Harmony Search. To represent the member of a group or class, we used a binary switch vector
(BSV), which indicates which channel or vector was selected. If the 𝑗th member of the BSV is one, the 𝑗th channel or vector is included in the group or class. Therefore, we determine the BSV values that generate the minimum result of the objective function using the HS algorithm. The objective function used in this study is the following: 1+𝐷
,
(8)
1 𝐷 = ∑∑𝑑𝑗𝑘 . 2 𝑗 𝑘
(9)
arg min
∗ ,ℎ 𝐷,𝑠̃
ℎ 𝑠̃∗
In (8), 𝑠̃∗ is the channel number or feature selected by the BSV, and ℎ is a constant determined by 𝑠̃∗ . The numeral “1” in the numerator is used to prevent the value of (8) from becoming zero. 𝐷 is the summation of the entire MSE or the distances selected by the BSV. In (9), 𝑑𝑗𝑘 is the selected member of the MSE matrix or the Euclidean distance matrix selected by the BSV. BSV contains the information in which the data, especially the channels or features, are selected. To apply the BSV to the HS algorithm, we can use the binary HS algorithm [25]. However, the binary HS algorithm has difficulty in applying pitch adjustment and requires more memory than the basic HS algorithm. This characteristic affects the speed performance and accuracy of the binary HS algorithm. Thus, in the HS, we converted each 𝑟 binary number in the BSV to a 2𝑟 -radix. Then, the solution ranged from 0 to 2𝑟 − 1, and the pitch adjustment size 𝑚 was 𝑟. In this study, we used 𝑟 = 4. When the value was above the range of the pitch adjustment, we used the circular method. The value of ℎ was determined by the following process: when the value of 𝑠̃∗ is from 0 to 𝑆̃∗ , the objective function is represented as follows: 1 { = ∞, { { 0ℎ { { { { { {1 + 0 Objective function = { 1ℎ = 1, { { { 1+𝐷 { { , { { { 𝑠̃∗ ℎ {
if 𝑠̃∗ = 0 if 𝑠̃∗ = 1
(10)
if 1 < 𝑠̃∗ < 𝑆̃∗ .
We assumed that the optimal value of 𝑠̃∗ was 𝑠̂, and the value of the objective function with 𝑠̂ was represented as 𝑓̂𝑠. Then, if 𝑠̃∗ = 𝑠̂ − 1, the objective function satisfies the following equation: 1 + 𝐷̂𝑠−1 ℎ
(̂𝑠 − 1)
=
1 + 𝐷̂𝑠 − ∑𝑗 𝑑𝑗𝑘
= (𝑓̂𝑠 −
𝑠̂ℎ ∑𝑗 𝑑𝑗𝑘 𝑠̂ℎ
(
𝑠̂ ℎ ) 𝑠̂ − 1
1 ℎ ) (1 + ) . 𝑠̂ − 1
(11)
From the definition of 𝑠̂, the following relationship should be satisfied: (12) 𝑓̂𝑠−1 − 𝑓̂𝑠 > 0.
4
Journal of Applied Mathematics
If 𝑠̃∗ = 𝑠̂ + 1, the objective function satisfies the following equation: 1 + 𝐷̂𝑠+1 (̂𝑠 + 1)ℎ
=
1 + 𝐷̂𝑠 + ∑𝑗 𝑑𝑗𝑘 𝑠̂ℎ
= (𝑓̂𝑠 +
∑𝑗 𝑑𝑗𝑘 𝑠̂ℎ
(
𝑠̂ ℎ ) 𝑠̂ + 1
) (1 −
FP1
ℎ
1 ) . 𝑠̂ + 1
𝑓̂𝑠+1 − 𝑓̂𝑠 > 0.
(14)
From (11) and (12), we obtain the following relationship: 𝑓̂𝑠 >
(1 + (1/̂𝑠 − 1))ℎ (∑𝑗 𝑑𝑗𝑘 /̂𝑠) ℎ
(1 + (1/̂𝑠 − 1)) − 1
AF3
(13)
From the definition of 𝑠̂, the following relationship should also be satisfied:
FP2 AF4
F7
F5
F3
F1
Fz
F2
F4
F6
F8
FT7
FC5
FC3
FC1
FCz
FC2
FC4
FC6
FT8
T7
C5
C3
C1
Cz
C2
C4
C6
T8
TP7
CP5
CP3
CP1
CPz CP2
CP4
CP6
TP8
P7
P5
P3
P1
Pz
P4
P6
P8
PO6
PO8
M1
M2
PO7 PO5 PO3
.
FPz
O1
(15)
CB1
P2
POz PO4 Oz
O2 CB2
From (10), 𝑓̂𝑠 ≤ 1. Then, (15) is transformed into the following relationship: 𝑠̂ℎ − (̂𝑠 − 1)ℎ > ∑𝑑𝑗𝑘 .
(16)
𝑗
The same process can be applied to (13) and (14). From (13), (14), and (16), we obtain the following: 𝑆̃∗
ℎ
ℎ
𝑆̃∗ +1
ℎ
∑𝑑𝑗𝑘 + (̂𝑠 − 1) < ̂s < ∑ 𝑑𝑗𝑘 + (̂𝑠 + 1) .
𝑗=1
S1 S2
(17)
𝑗=1
Equation (17) should be satisfied for all 𝑘 values. Therẽ∗ 𝑆̃∗ fore, ∑𝑗=1 𝑑𝑗𝑘 and ∑𝑆𝑗=1+1 𝑑𝑗𝑘 can be, respectively, converted to the maximum summation of 𝑑𝑗𝑘 , which has a value of one in the BSV (𝑑maxone ), and the minimum summation of 𝑑𝑗𝑘 , which has a value of zero in the BSV (𝑑minzero ). Equation (17) is rewritten as follows: 𝑑maxone + (̂𝑠 − 1)ℎ < ̂sℎ < 𝑑minzero + (̂𝑠 + 1)ℎ .
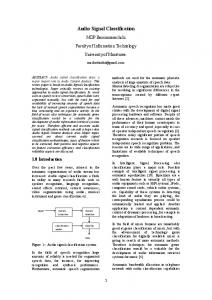
Figure 1: Electrode placement in accordance with 64CH international 10–20 system.
(18)
In this equation, 𝑑maxone and 𝑑minzero are constant, and 𝑠̂ is determined by the HS process. Therefore, the value of ℎ should satisfy (18).
4. Experiment In the experiments, we used a commercial product, the Neuroscan EEG signal acquisition device (Neuroscan system, Compumedics, USA), to acquire the EEG signals. This device consists of the Synamps2 and Stim2 hardware, and the software for acquisition and preprocessing is Curry 7. We used an EEG cap with 64 electrodes for the EEG signals and five additional electrodes for noise reduction. The subjects were three healthy men in their mid-twenties. The subjects were selected without using any selection criteria to ensure generality of the results. All subjects had undergone one or more brain-wave experiments not related to this study. The subjects were fully aware of the entire experimental
S3 0 1 3 4 6 7 9 10 12 13 15 16 18 19 20 (s)
Figure 2: Timing chart of the stimuli in one session.
process, risk, and objective of the experiment. The entire experimental process was conducted under the experimental ethics and experimental safety regulations of the ChungAng University. The subjects wore EEG caps on their heads and sat in a comfortable position in front of the monitor. Electrodes were placed in accordance with the international 10–20 system [26]. The sampling rate of the EEG signals was 250 Hz, and we used a band-pass filter to obtain signals from 8 to 70 Hz. Commonly, a low-frequency signal below 8 Hz contains biological noise such as blinking eyes and heartbeat. The following Figure 1 shows the location of the electrodes. The actual electrodes were placed on the human scalp so that the real position of the electrodes represented an arc. In this study, however, we installed the electrodes in a line for ease in understanding the position of the electrodes. The subjects received three types of stimuli without feedback. To reduce noise, the subject movements were restricted. The experiment was repeated 10 times per subject. One experiment involved six sessions, and one session consisted of seven epochs. The order of the epochs was random. The same epoch was repeated 60 times, and each stimulus was repeatedly administered 240 times. The nonstationary
Journal of Applied Mathematics
5 Subject 1
5
5
5
5
5
5
5
5
5
5
5
5
5
5
5
0
0
0
0
0
0
0
0
0
0
0
0
0
0
0
−5 −5
0
−5 5 −5
0
−5 5 −5
0
−5 5 −5
0
−5 5 −5
0
5
−5 −5
0
−5 5 −5
0
−5 5 −5
0
−5 5 −5
0
−5 5 −5
0
5
−5 −5
0
−5 5 −5
0
−5 5 −5
0
−5 5 −5
0
−5 5 −5
5
5
5
5
5
5
5
5
5
5
0
0
0
0
0
0
0
0
0
0
0
0
0
0
0
−5 −5
−5 5 −5
−5 5 −5
−5 5 −5
−5 5 −5
−5 −5
−5 5 −5
−5 5 −5
−5 5 −5
−5 5 −5
−5 −5
−5 5 −5
0
−5 5 −5
−5 5 −5
−5 5 −5
0
5
0
0
0
0
0
5
0
0
0
0
5
0
5
5
0
5
5
5
5
5
5
0
0
0
0
0
0
−5 −5
0
−5 5 −5
0
−5 −5
5
0
−5 5 −5
0
−5 −5
5
Sound 5
5
5
5
5
5
5
5
0
0
0
0
0
0
0
0
0
0
−5 5 −5
0
−5 5 −5
0
−5 5 −5
0
−5 5 −5
5
5
5
5
5
0
0
0
0
0
−5 −5
0
5
0
−5 5 −5
0
−5 5 −5
0
−5 5 −5
0
5
5
5
0 −5 −5
−5 5 −5
0
0
−5 5 −5
0
0
−5 5 −5
0
−5 5 −5
0
−5 5 −5
5
5
5
5
0
0
0
0
0
−5 −5
0
−5 5 −5
5
5
0
0
−5 −5
Sound, visual
0
−5 5 −5
0
−5 5 −5
0
−5 5 −5
0
5
5
5
0
0
0
0
0
0
−5 5 −5
0
−5 5 −5
0
−5 5 −5
0
−5 5 −5
5
5
5
5
5
0
0
0
0
0
0
−5 5 −5
5
5
0
0
0
−5 5 −5
0
−5 5 −5
0
5
0
−5 5 −5
0
−5 5 −5
0
0
−5 5 −5
0
5
0
5
0
5
5
5
5
5
0
5
0
5
0
5
5
0
0
0
0
0
−5 5 −5
−5 5 −5
−5 5 −5
−5 5 −5
0
0
0
0
5
5
5
5
5
0
0
0
0
0
−5 −5 0
0
−5 5 −5
5
5
0
0
0
−5 5 −5
0
−5 5 −5
0
5
0
−5 5 −5
0
−5 5 −5
5
Sound, movement
5
−5 −5
−5 5 −5
0
0
5
−5 −5
−5 −5
5
5
−5 −5
0
5
5
0
5
−5 −5
−5 −5
5
Movement
5
0
−5 5 −5
Visual
5
−5 −5
0
5
Visual, movement
All stimuli
Figure 3: Results of grouping for Subject 1.
characteristic of the EEG signals allowed us to obtain results from a number of trials despite the small number of subjects. We used three types of stimuli in this study: audio, visual, and finger movement. Each stimulus was given in 1 s. A monitor, an earphone, and a button pad were used to introduce the stimuli, which were given in rotation. The timing of the stimuli in one session is presented in the following timing chart, Figure 2. S1, S2, and S3 represent the three stimuli, and their order was randomly changed. The resting time between stimuli was 2 s, and the entire session lasted for 20 s. First, one stimulus was administered three times. Subsequently, two stimuli were concurrently administered. At the final, three stimuli were given at once. At 300 ms before the motion stimulus was given, a white cross mark appeared on the black screen.
The audio stimulus was a 1000-Hz stereo pure tone made by Stim2. The monitor screen was black when the audio stimulus was administered, with the earphone controlled by a specific amplifier for the least delay stimulus. The visual stimulus was administered in 1 s when the monitor screen was green, and the other stimuli were controlled so that the unrelated channels were unaffected. The motion stimulus was quite different from the other stimuli because the subject made a physical movement by pressing the button pad using their fingers. The motion image was difficult to notice in the experiments and affected the concentration of the subject. Therefore, we used real movements in this stimulus even though noise from the movements was present. To reduce the noise, the subject used only one finger and kept the other body parts still. The motion stimulus indicates a white cross
6
Journal of Applied Mathematics Subject 2 5
5
5
5
5
5
5
5
5
5
5
5
5
5
0
0
0
0
0
0
0
0
0
0
0
0
0
0
0
−5 −5 5
0
−5 5 −5 5
0
−5 5 −5 5
0
−5 5 −5 5
0
−5 5 −5 5
5
−5 −5 5
0
−5 5 −5 5
0
−5 5 −5 5
0
−5 5 −5 5
0
−5 5 −5 5
5
−5 −5 5
0
−5 5 −5 5
0
−5 5 −5 5
0
−5 5 −5 5
0
−5 5 −5 5
0
0
0
0
0
0
0
0
0
0
0
0
0
0
0
−5 −5 5
0
−5 5 −5 5
0
−5 5 −5 5
0
−5 5 −5 5
0
−5 5 −5 5
5
−5 −5 5
0
−5 5 −5 5
0
−5 5 −5 5
0
−5 5 −5 5
0
−5 5 −5 5
0
5
−5 −5 5
0
−5 5 −5 5
0
−5 5 −5 5
0
−5 5 −5 5
0
−5 5 −5 5
0
0
0
0
0
0
−5 −5
0
−5 5 −5
0
−5 5 −5
0
−5 5 −5
0
−5 5 −5
−5 −5
0
−5 5 −5
0
−5 5 −5
0
−5 5 −5
0
−5 5 −5
0
5
−5 −5
0
−5 5 −5
0
−5 5 −5
0
−5 5 −5
0
−5 5 −5
0
0
0
5
0
0
Sound 5
5
5
5
0
0
0
0
0
0
0 −5 −5 5
0
0 0
0 −5 −5
−5 5 −5 5
−5 5 −5 5
−5 5 −5
0
0 0
0 0
−5 5 −5 5
−5 5 −5 5 0
0
−5 5 −5
−5 5 −5 5
0
0 0
−5 5 −5 5
−5 5 −5
−5 5 −5 5
0
−5 5 −5 5
0
−5 5 −5
5
5
5
0
0
0
0
−5 −5 5
0
−5 5 −5 5
0
−5 5 −5 5
0
−5 5 −5 5
0
−5 5 −5 5
0
−5 5 −5 5
0
−5 5 −5 5
0
−5 5 −5 5
0
−5 5 −5 5
0
0
0
0
0
−5 −5
0
−5 5 −5
0
−5 5 −5
0
−5 5 −5
0
−5 5 −5
0
0
5
5
5
5
5
0
0
0
0
0
0
0
0
0
0
−5 5 −5 5
0
5
0
5
−5 −5
0
−5 5 −5 5
0 −5 −5 5
0 0
−5 5 −5 5
0
−5 5 −5
0
0
−5 5 −5 5
0 0
−5 5 −5 5
0
−5 5 −5
0
s
0
−5 5 −5 5
0 0
−5 5 −5 5
0
−5 5 −5
0
0
5
0
5
0
5
0
Movement 5
5
−5 −5 5
0 0
−5 5 −5 5
0
0
−5 5 −5
0
0
0
0
−5 5 −5 5
0 5
−5 −5 5
5
0
0
−5 5 −5 5
0
−5 5 −5 5
0 0
−5 5 −5 5
0 0
−5 5 −5 5
0 −5 −5
0 −5 5 −5
0
0
Sound, movement
0
0
0
5
−5 −5 5
0
5
0
0
5
5
Sound, visual
−5 −5 5
0
5
0
0
0 0
0
Visual
5
−5 −5 5
0
0
5
5 0 0
−5 5 −5 5
0
0
0
−5 5 −5 5
0
−5 5 −5 5
0
0
0
−5 5 −5
0
−5 5 −5
0
−5 5 −5
0
5
0
5
0
5
Visual, movement
5
0
0
5
0
5
0
5
0
All stimuli
Figure 4: Results of grouping for Subject 2.
symbol on the screen to prepare the subject, and a white sentence “press button” appeared on the screen to signal to the subject to push the button pad. 4.1. Channel Grouping. For the channel grouping, we used the PSF HS algorithm and the MSE method for the objective function. In the previous research, we used the binary HS and the correlated coefficient. However, the previous method exhibited poor performance in terms of computational time. In this study, we used the proposed method to improve the speed and accuracy. The number of iterations of the HS and HMS used in this study was 5000 and 20, respectively. The number of trials for one epoch of the HS algorithm was 10. We identified the groups by determining the number of times each channel was grouped with the other channels. All 30 experiments for the three subjects were summarized in three results in Section 5.1. 4.2. Feature Classification. In the classification, we used the HS algorithm with PSF where the HMS was 20 and the number of iterations was 50000. The results of channel grouping which dimension of the signal data decreased were used for classification. The CSP algorithm was used for feature extraction. To match the number of channels, we
selected a minimum number of channels among the stimuli. In the CSP procedure, we used the data from the given two stimuli and determined the eigenvectors of the filtered signal. The data were classified without using any training method.
5. Results and Analysis 5.1. Channel Grouping. The results of the channel grouping are shown in the following Figures 3, 4, and 5 and Table 1. We searched the group by comparing all cases. The results for subject 1 exhibited were distinct. The audio stimulus activated the front of the brain, the visual stimulus activated the backside of the brain, and the motion stimulus activated the middle of the brain. Generally, the functions of the brain are known to be specialized by the location. The area starting with “C” includes the vicinity from the Cz channel to the C6 channel, which is also known as the motor cortex. The visual stimulus activated the visual cortex and the back of the brain. A similar tendency could be observed in the other subjects. All subjects showed the relationship between the motion stimulus and the “C” area. Although slight differences existed, the results agreed with those of the existing research, which also explained the visual and audio stimuli. Therefore,
Journal of Applied Mathematics
7 Subject 3
5
5
5
5
5
5
5
5
5
5
5
5
5
5
5
0
0
0
0
0
0
0
0
0
0
0
0
0
0
0
−5 −5
0
−5 5 −5
0
−5 5 −5
0
−5 5 −5
0
−5 5 −5
0
5
−5 −5
0
−5 5 −5
0
−5 5 −5
−5 5 −5
0
0
−5 5 −5
0
5
−5 −5
0
−5 5 −5
0
−5 5 −5
0
−5 5 −5
0
−5 5 −5
5
5
5
5
5
5
5
5
5
5
0
0
0
0
0
0
0
0
0
0
0
0
0
0
0
−5 −5
−5 5 −5
−5 5 −5
−5 5 −5
−5 5 −5
−5 5 −5
−5 −5
0
−5 5 −5
−5 5 −5
−5 5 −5
−5 5 −5
0
5
0
0
0
0
0
5
−5 −5
0
−5 5 −5
0
−5 5 −5
−5 5 −5
0
0
5
0
5
5
5
5
0
0
0
−5 −5
0
−5 −5
5
0
−5 −5
5
Sound
5
5
0
Visual
5
0
0
5
5
5
5
5
5
5
5
5
0
0
0
0
0
0
0
0
0
0
0
0
0
0
0
−5 −5
−5 5 −5
−5 5 −5
−5 5 −5
−5 5 −5
−5 −5
−5 5 −5
−5 5 −5
−5 5 −5
−5 5 −5
−5 −5
−5 5 −5
−5 5 −5
−5 5 −5
−5 5 −5
0
0
0
0
5
0
0
0
0
5
0
5
5
0
5
0
5
0
0
5
5
5
5
5
5
5
5
5
5
5
5
5
5
0
0
0
0
0
0
0
0
0
0
0
0
0
0
0
0
−5 5 −5
0
−5 5 −5
0
−5 5 −5
0
−5 5 −5
0
5
5
−5 −5
0
−5 5 −5
0
−5 5 −5
0
−5 5 −5
0
−5 5 −5
0
5
−5 −5
5
5
0
0
0
−5 −5
−5 −5
0
5
Sound, visual 5
5
5
5
0
0
0
0
0
0
−5 5 −5
5
0
5
−5 5 −5
0
5
−5 5 −5
0
5
−5 5 −5
0
0
0
0
0
0
−5 5 −5
−5 5 −5
−5 5 −5
−5 5 −5
0
5
0
0
5
0
5
5
0
5
0
−5 5 −5
0
5
0
−5 5 −5
0
−5 5 −5
0
−5 5 −5
0
5
Visual, movement
5
−5 −5
0
−5 −5
5
Sound, movement
5
−5 −5
0
0
5
5
−5 −5
5
Movement
5
0
0
5
0
5 0 −5 −5
All stimuli
Figure 5: Results of grouping for Subject 3.
Table 1: Channel group results. Subject Subject 1
Subject 2
Subject 3
Stimuli Audio Visual Motions Audio Visual Motions Audio Visual Motions
Channel name FP1, AF3, FT7, FC5, FC3, FC1, FCz P5, P3, P1, Pz, P2, P4, PO4 C5, C3, C1, Cz, C2 P5, P3, P1, Pz PO7, PO5, PO3, POz, O1 C5, C3, C1, Cz, C2, CP2 F7, F5, F3, F1, Fz, F2, F4, AF4 PO3, POz, PO4, PO6, PO8, O1, O2, CB1 C5, C3, C1, Cz
we conclude that the results of the grouping are related to the given stimuli.
Furthermore, the similar group made by a single stimulus also could be found in the groups subjected to two or three stimuli including a previous single stimulus. Therefore, we can analyze the EEG and the brain by separated stimuli. Additionally, the number of channels used in the analysis was reduced by the proposed method. These characteristics can make the EEG analysis easier. However, in some cases, determining the relationship between the stimulus and the group was difficult. This problem implied two limitations of this work. First is the difficulty in strictly controlling the experimental conditions including the state of the subject. A human brain constantly and unconsciously receives stimuli. If an unwanted stimulus is administered, the accuracy would worsen. The second is the problem resulting from averaging the signals. EEG signals have a high temporal resolution, and the data sampling rate used in this study was 250 Hz. However, the grouping method
8
Journal of Applied Mathematics Audio-motion
90
85
85
80
80
75
75
Accuracy (%)
Accuracy (%)
Audio-visual
90
70 65 60
70 65 60
55
55
50
50
45
1
2
3
4
5
6
7
8
9
10
45
1
2
3
4
5
6
7
8
9
10
Trial
Trial Subject 1 Subject 2 Subject 3
Subject 1 Subject 2 Subject 3
Figure 6: Classification accuracy of the audio and visual stimuli.
Figure 8: Classification accuracy of the audio and motion stimuli.
Visual-motion
90 85
exceeded the decision boundary of the two classes by a rate of approximately 63%. Furthermore, the classified data were nonlinear high-dimensional data.
Accuracy (%)
80 75 70 65 60
6. Conclusion
55 50 45
1
2
3
4
5
6
7
8
9
10
Trial Subject 1 Subject 2 Subject 3
Figure 7: Classification accuracy of the visual and motion stimuli.
focused on the summation of the MSEs in 1 s. Therefore, the advantage of EEG was not well presented. 5.2. Feature Classification. We used the HS algorithm for classification. The classification in the feature space was attempted 10 times for 120 features. Figures 6, 7, and 8 show the results of the classification for two stimuli. For Subject 1, the best classification result was 74.17%, and the worst classification result was 55%. The average accuracy rate was 62.83%. For Subject 2, the best classification result was 77.50%, and the worst classification result was 55%. The average accuracy rate was 64.61%. For Subject 3, the best classification result was 72.50%, and the worst classification result was 50.83%. The average accuracy rate was 62.53%. The HS algorithm is a heuristic algorithm; thus, the results had an accuracy-rate range. However, without any learning method or prior information, the proposed method
In this study, we have built a group to easily analyze EEG signals and proposed an EEG signal classification method based on HS. Signal processing and classification are important, as they determine the accuracy of the entire system. Therefore, we focused on solving the problems of a BCI system in signal processing and classification. First, we employed EEG signal grouping using the HS algorithm to reduce the channel complexity. From the EEG signal grouping, we did not only reduce the channel used in the analysis but also separately analyzed the signal of each stimulus. Therefore, the computational time and the complexity of the data were reduced. The proposed method could be the smartest solution for EEG signal analysis for problems with large data and dimension. Next, we classified the EEG signals using HS. We proposed a novel classification method with a metaheuristic algorithm for nonlinear data such as the EEG signals. The proposed method also focused on unsupervised classification; thus, we could classify the data without training or prior information. We believe that the proposed two methods could be helpful in enhancing the BCI implementation and the EEG analysis field.
Acknowledgment This work was supported by the Mid-Career Researcher Program through an NRF Grant funded by the MEST (no. 2012-0008726).
Journal of Applied Mathematics
9
References [1] L. Bi, X. Fan, and Y. Liu, “EEG-based brain-controlled mobile robots: a survey,” IEEE Transactions on Human-Machine Systems, vol. 43, no. 2, pp. 161–176, 2013. [2] I. Iturrate, J. M. Antelis, A. K¨ubler, and J. Minguez, “A noninvasive brain-actuated wheelchair based on a P300 neurophysiological protocol and automated navigation,” IEEE Transactions on Robotics, vol. 25, no. 3, pp. 614–627, 2009. [3] A. Frisoli, C. Loconsole, D. Leonardis et al., “A new gaze-BCIdriven control of an upper limb exoskeleton for rehabilitation in real-world tasks,” IEEE Transactions on Systems, Man, and Cybernetics C, vol. 42, no. 6, pp. 1169–1179, 2012. [4] J. R. Wolpaw, “Brain-computer interface research comes of age: traditional assumptions meet emerging realities,” Journal of Motor Behavior, vol. 42, no. 6, pp. 351–353, 2010. [5] E. E. Fetz, “Real-time control of a robotic arm by neuronal ensembles,” Nature Neuroscience, vol. 2, no. 7, pp. 583–584, 1999. [6] P. LeVan, J. Maclaren, M. Herbst, R. Sostheim, M. Zaitsev, and J. Hennig, “Ballistocardiographic artifact removal from simultaneous EEG-fMRI using an optical motion-tracking system,” NeuroImage, vol. 75, pp. 1–11, 2013. [7] A. Ishikawa, H. Udagawa, Y. Masuda, S. Kohno, T. Amita, and Y. Inoue, “Development of double density whole brain f NIRS with EEG system for brain machine interface,” in Proceedings of the 33rd Annual International Conference of the IEEE Engineering in Medicine and Biology Society (EMBS ’11), pp. 6118–6122, September 2011. [8] O. A. P. Sosa, Y. Quijano, M. Doniz, and J. E. Chong-Quero, “BCI: a historical analysis and technology comparison,” in Proceedings of the Pan American Health Care Exchanges Conference (PAHCE ’11), pp. 205–209, Rio de Janeiro, Brazil, April 2011. [9] Y. O. Halchenko, S. J. Hanson, and B. A. Pearlmutter, “Multimodal integration: FMRI, MRI, EEG, MEG,” in Advanced Image Processing in Magnetic Resonance Imaging,, CRC Press, Boca Raton, Fla, USA, 2005. [10] T. N. Lal, M. Schr¨oder, T. Hinterberger et al., “Support vector channel selection in BCI,” IEEE Transactions on Biomedical Engineering, vol. 51, no. 6, pp. 1003–1010, 2004. [11] J. Meng, G. Huang, D. Zhang, and X. Zhu, “Optimizing spatial spectral patterns jointly with channel configuration for braincomputer interface,” Neurocomputing, vol. 104, pp. 115–126, 2013. [12] C. Brunner, M. Naeem, and G. Pfurtscheller, “Dimensionality reduction and channel selection of motor imagery electroencephalographic data,” Computational Intelligence and Neuroscience, vol. 2009, Article ID 537504, 8 pages, 2009. [13] H. Lu, H.-L. Eng, C. Guan, K. N. Plataniotis, and A. N. Venetsanopoulos, “Regularized common spatial pattern with aggregation for EEG Classification in small-sample setting,” IEEE Transactions on Biomedical Engineering, vol. 57, no. 12, pp. 2936–2946, 2010. [14] B. Wang, C. M. Wong, F. Wan, P. U. Mak, P.-I. Mak, and M. I. Vai, “Trial pruning based on genetic algorithm for single-trial EEG classification,” Computers and Electrical Engineering, vol. 38, no. 1, pp. 35–44, 2012. [15] B. Blankertz, S. Lemm, M. Treder, S. Haufe, and K.-R. M¨uller, “Single-trial analysis and classification of ERP components: a tutorial,” NeuroImage, vol. 56, no. 2, pp. 814–825, 2011. [16] S. Siuly and Y. Li, “Improving the separability of motor imagery EEG signals using a cross correlation-based least square support
[17]
[18]
[19]
[20]
[21]
[22]
[23]
[24]
[25]
[26]
vector machine for brain-computer interface,” IEEE Transactions on Neural Systems and Rehabilitation Engineering, vol. 20, no. 4, pp. 526–538, 2012. A. Vuckovic and F. Sepulveda, “Delta band contribution in cue based single trial classification of real and imaginary wrist movements,” Medical and Biological Engineering and Computing, vol. 46, no. 6, pp. 529–539, 2008. K. S. Lee and Z. W. Geem, “A new meta-heuristic algorithm for continuous engineering optimization: harmony search theory and practice,” Computer Methods in Applied Mechanics and Engineering, vol. 194, no. 36–38, pp. 3902–3933, 2005. X.-S. Yang, “Harmony search as a metaheuristic algorithm,” Music-Inspired Harmony Search Algorithm, vol. 191, pp. 1–14, 2009. Z. W. Geem, J. H. Kim, and G. V. Loganathan, “A new heuristic optimization algorithm: harmony search,” Simulation, vol. 76, no. 2, pp. 60–68, 2001. Q.-K. Pan, P. N. Suganthan, M. F. Tasgetiren, and J. J. Liang, “A self-adaptive global best harmony search algorithm for continuous optimization problems,” Applied Mathematics and Computation, vol. 216, no. 3, pp. 830–848, 2010. L. D. S. Coelho and V. C. Mariani, “An improved harmony search algorithm for power economic load dispatch,” Energy Conversion and Management, vol. 50, no. 10, pp. 2522–2526, 2009. Z. W. Geem and K.-B. Sim, “Parameter-setting-free harmony search algorithm,” Applied Mathematics and Computation, vol. 217, no. 8, pp. 3881–3889, 2010. M. G. Wentrup and M. Buss, “Multiclass common spatial patterns and information theoretic feature extraction,” IEEE Transactions on Biomedical Engineering, vol. 55, no. 8, pp. 1991– 2000, 2008. L. Wang, Y. Mao, Q. Niu, and M. Fei, “A multi-objective binary harmony search algorithm,” Advances in Swarm Intelligence, vol. 6729, no. 2, pp. 74–81, 2011. E. Niedermeyer and F. L. da Silva, “EEG recording and operation of the apparatus,” in Electroencephalography: Basic Principles, Clinical Applications, and Related Fields, Lippincott Williams and Wilkins, Baltimore, Md, USA, 2004.
Advances in
Operations Research Hindawi Publishing Corporation http://www.hindawi.com
Volume 2014
Advances in
Decision Sciences Hindawi Publishing Corporation http://www.hindawi.com
Volume 2014
Journal of
Applied Mathematics
Algebra
Hindawi Publishing Corporation http://www.hindawi.com
Hindawi Publishing Corporation http://www.hindawi.com
Volume 2014
Journal of
Probability and Statistics Volume 2014
The Scientific World Journal Hindawi Publishing Corporation http://www.hindawi.com
Hindawi Publishing Corporation http://www.hindawi.com
Volume 2014
International Journal of
Differential Equations Hindawi Publishing Corporation http://www.hindawi.com
Volume 2014
Volume 2014
Submit your manuscripts at http://www.hindawi.com International Journal of
Advances in
Combinatorics Hindawi Publishing Corporation http://www.hindawi.com
Mathematical Physics Hindawi Publishing Corporation http://www.hindawi.com
Volume 2014
Journal of
Complex Analysis Hindawi Publishing Corporation http://www.hindawi.com
Volume 2014
International Journal of Mathematics and Mathematical Sciences
Mathematical Problems in Engineering
Journal of
Mathematics Hindawi Publishing Corporation http://www.hindawi.com
Volume 2014
Hindawi Publishing Corporation http://www.hindawi.com
Volume 2014
Volume 2014
Hindawi Publishing Corporation http://www.hindawi.com
Volume 2014
Discrete Mathematics
Journal of
Volume 2014
Hindawi Publishing Corporation http://www.hindawi.com
Discrete Dynamics in Nature and Society
Journal of
Function Spaces Hindawi Publishing Corporation http://www.hindawi.com
Abstract and Applied Analysis
Volume 2014
Hindawi Publishing Corporation http://www.hindawi.com
Volume 2014
Hindawi Publishing Corporation http://www.hindawi.com
Volume 2014
International Journal of
Journal of
Stochastic Analysis
Optimization
Hindawi Publishing Corporation http://www.hindawi.com
Hindawi Publishing Corporation http://www.hindawi.com
Volume 2014
Volume 2014