Sep 8, 2006 - IV and V contain the dis- cussion and a summary. II. ... size of the fundamental band gap between occupied and unoccupied states, whereas ...
Electronic structure and optical properties of lightweight metal hydrides M. J. van Setten,1 V. A. Popa,2 G. A. de Wijs,1 and G. Brocks2
arXiv:cond-mat/0609189v1 [cond-mat.mtrl-sci] 8 Sep 2006
1
Electronic Structure of Materials, Institute for Molecules and Materials, Faculty of Science, Radboud University Nijmegen, Toernooiveld 1, 6525 ED Nijmegen, The Netherlands 2 Computational Materials Science, Faculty of Science and Technology and MESA+ Research Institute, University of Twente, P.O. Box 217, 7500 AE Enschede, The Netherlands (Dated: February 4, 2008) We study the electronic structures and dielectric functions of the simple hydrides LiH, NaH, MgH2 and AlH3 , and the complex hydrides Li3 AlH6 , Na3 AlH6 , LiAlH4 , NaAlH4 and Mg(AlH4 )2 , using first principles density functional theory and GW calculations. All these compounds are large gap insulators with GW single particle band gaps varying from 3.5 eV in AlH3 to 6.5 eV in the MAlH4 compounds. The valence bands are dominated by the hydrogen atoms, whereas the conduction bands have mixed contributions from the hydrogens and the metal cations. The electronic structure of the aluminium compounds is determined mainly by aluminium hydride complexes and their mutual interactions. Despite considerable differences between the band structures and the band gaps of the various compounds, their optical responses are qualitatively similar. In most of the spectra the optical absorption rises sharply above 6 eV and has a strong peak around 8 eV. The quantitative differences in the optical spectra are interpreted in terms of the structure and the electronic structure of the compounds. PACS numbers: 61.50.Lt, 61.66.Fn, 71.20.Nr
I.
INTRODUCTION
The large scale utilization of hydrogen as a fuel crucially depends on the development of compact hydrogen storage materials with a high mass content of hydrogen.1 Hydrides of group I-III metals in the upper rows of the periodic table could meet this requirement. These metals are sufficiently light for their hydrides to have a large gravimetric hydrogen density; for instance, MgH2 contains 7.7 wt.% hydrogen. One must be able to extract hydrogen at a moderate temperature, however, and therefore the metal hydride should be neither too stable nor too unstable. Simple metal hydrides do not satisfy this demand. For example, the binding energy of MgH2 is too large,2,3 whereas the binding energy of AlH3 is close to zero.4 This has stimulated research into binary intermetallic hydrides such as the alanates MAlH4 , M′ (AlH4 )2 , with M and M′ a light alkali and alkaline earth metal, respectively. Some of the properties of these compounds have indeed improved as compared to the simple hydrides, but the compound that meets both the stability and the storage capacity demands has not been found yet. Whereas sodium alanate, NaAlH4 , releases hydrogen in two reaction stages with enthalpies close to the ideal value, its active gravimetric hydrogen density is only 5.5 wt.%.1,5,6 Magnesium alanate, Mg(AlH4 )2 , and lithium alanate, LiAlH4 , have a higher active gravimetric hydrogen density of 7.0 and 8.0 wt.%, respectively. However, they are not sufficiently stable with respect to decomposition into simpler hydrides.7,8,9,10,11,12 A suitable ternary intermetallic hydride might satisfy all requirements. The number of possible ternary compounds is very large, however, and searching for the optimal composition becomes very tedious, unless one uses a
combinatorial approach. Such a technique has been proposed recently, in which thin films are grown with tunable composition gradients.13 The composition is then a function of the position on the film. This avoids having to synthesize all compositions individually, but one still needs to be able to identify the most promising ones. It is proposed that identification can be based upon the optical properties of suitable metal hydrides being very different from those of their host metals.13 This has first been demonstrated conclusively for YH3 ,14 and since then for a number of other so-called “switchable mirror” rare earth and transition metal compounds.15,16,17,18,19,20,21 The compounds that absorb the maximum amount of hydrogen, become semiconductors or insulators. If one applies this technique to group I-III metal hydrides, it is relevant to know how the optical properties of these compounds depend on their composition and structure. In this paper we report a systematic first principles study of the band gaps, the electronic structure and the optical properties of group I-III metal hydrides. Band gaps and single particle excitations are calculated within the GW quasi-particle approach; optical excitations are obtained using the random phase approximation (RPA). We focus upon a number of elements that are of interest for lightweight metal hydrides, i.e., Li, Na, Mg and Al. In particular, we consider the series of simple metal hydrides LiH, NaH, MgH2 , AlH3 and the binary metal hydrides Li3 AlH6 , Na3 AlH6 , LiAlH4 , NaAlH4 and Mg(AlH4 )2 .6,8,22,23,24,25,26,27,28 The trends in the optical spectra and electronic structure are discussed and interpreted in terms of the structure and bonding of the materials. This paper is organized as follows. In Sec. II we outline the computational methods used in our study. The results are presented in Sec. III, first for the simple hy-
2 drides, then for the binary M3 AlH6 hydrides and finally for the MAlH4 alanates. Secs. IV and V contain the discussion and a summary.
II.
COMPUTATIONAL METHODS
The results discussed in this paper are obtained using a combination of density functional theory (DFT) and GW calculations. DFT is used at GGA level to optimize the ground state structure and obtain single particle wave functions to be used in the calculation of the optical response. GW is used to generate single particle excitation energies within the quasi-particle (QP) approximation, starting from DFT/LDA wavefunctions and eigenvalues. The optical response is given by the frequency dependent dielectric function, which is calculated within the random phase approximation (RPA). In the latter we use single particle wave functions and excitation energies and neglect exciton and local field effects. The main difference between the DFT and the QP excitation spectra is the size of the fundamental band gap between occupied and unoccupied states, whereas the dispersion of the bands is quite similar. We use a scissors operator to the DFT eigenvalues to approximate QP excitation energies on a dense grid in the Brillouin zone, which is required to calculate the dielectric function.
A.
DFT calculations
DFT total energies are calculated with the PW91 generalized gradient approximation (GGA) functional29 and the projector augmented wave (PAW) method,30,31 as implemented in the Vienna Ab initio Simulation Package (VASP).32,33,34 We use standard frozen core PAW potentials and a plane wave basis set with a kinetic energy cutoff of 312 eV. The tetrahedron scheme is applied for the Brillouin zone integration using k-point meshes with a spacing between 0.01 and 0.03 ˚ A−1 . The cell parameters and the atomic positions within a unit cell are optimized by minimizing the total energy, except for the alkali alanates, where only the atomic positions are optimized and the cell parameters are taken from experiment. These optimized structures are used as input for the GW calculations.
B.
GW calculations
DFT calculations generally give good results for ground state properties, but not for excited states. The electronic band gap, for instance, can be underestimated by ∼ 50%, and even more than that for small band gap materials. This stems from an unjustified interpretation of the DFT (Kohn-Sham) eigenvalues as single particle excitation energies. The latter can be obtained from
the quasi-particle (QP) equation, which involves the nonlocal, energy dependent self-energy Σ, � � 1 2 − ∇ + vext (r) + VH (r) ψnk (r) + 2 Z + dr′ Σ(r, r′ ; ǫnk )ψnk (r′ ) = ǫnk ψnk (r), (1) where vext stands for the sum of all nuclear or ionic potentials, VH is the electrostatic or Hartree potential resulting from the electrons, ψnk (r) is the QP wave function, and ǫnk is the QP energy, i.e., the single particle excitation energy. In practice Eq. (1) is solved using a number of approximations. The GW technique approximates the self-energy Σ by a dynamically screened exchange interaction. A large variety of GW implementations exist, in which quite different levels of approximation are used. We will explain our procedure here and benchmark it on simple hydrides in the next section. The G0 W0 approximation is defined by constructing the self-energy Σ from the orbitals and eigenvalues obtained in a DFT calculation within the local density approximation (LDA). If the QP and LDA wave functions LDA do not differ significantly, i.e., ψnk (r) ≅ ψnk (r), then 35,36 Eq. (1) is approximated by hnk + Σnk (ǫnk ) = ǫnk ,
(2)
LDA LDA | − 21 ∇2 + vext + VH |ψnk where hnk = hψnk i and LDA LDA Σnk = hψnk |Σ|ψnk i. Eq. (2) is non-linear in ǫnk and it is solved by a root-searching technique.37 GW calculations are computationally demanding, so pseudopotentials are used to represent the ion cores and only the valence electrons are treated explicitly. Calculations within this scheme have been applied to a wide range of semiconductors and insulators.38 They lead to band gaps that are usually within 10% of the experimental values, although occasionally somewhat larger deviations are found.39 In principle, an overlap between core and valence charge densities contributes to the screening, and thus to the self-energy. This contribution is neglected in a pseudopotential approach, but a simple estimate of its effect is made by adding
(Vxc [ρv + ρc ] − Vxc [ρv ])nk ,
(3)
to the QP energies, where Vxc is the LDA exchangecorrelation potential, ρc,v are the core and valence charge densities, and nk indicates the expectation value with respect to an LDA wave function as in Eq. (2).40,41 The QP equation, Eq. (1), is not related to DFT, but the scheme outlined above depends on LDA eigenvalues and wave functions through the G0 W0 approximation for the self-energy and through the approximation represented by Eq. (2). The dependence on LDA eigenvalues can be avoided by constructing the self-energy (GW ) from QP energies and solve the QP equation self-consistently. We have previously observed that selfconsistency on the eigenvalues is in fact vital to obtain
3 good results for small band gap semiconductors that are incorrectly described by LDA as being metallic.40,41 For large band gap materials, however, this self-consistency does not improve upon the G0 W0 results.42 The dependence on LDA wave functions can be relaxed by solving Eq. (1) instead of Eq. (2). However, for large band gap materials this changes the results only marginally.42 The dependence of the self-energy on the LDA wave functions is not that easily avoided. Self-consistency applied to QP wave functions worsens the results as compared to the G0 W0 approximation.42 Since all hydrides considered in this paper turn out to be large band gap insulators, we use the G0 W0 approximation to calculate the QP spectrum. Starting from the optimized structures we generate wave functions and eigenvalues from an LDA calculation with norm-conserving pseudopotentials and a plane wave kinetic energy cutoff of 748 eV.43 The self-energy G0 W0 is calculated using the real space, imaginary time formalism.41,44,45,46 We include 350 LDA states, use a real space grid mesh with a typical spacing of 0.3-0.4 ˚ A and an interaction cell parameter of ∼ 25 ˚ A . The QP equation is solved in the approximation represented by Eq. (2). We estimate that with these parameters QP band gaps are converged numerically to within ±0.02 eV. C.
Macroscopic dielectric function
Optical excitations are two-particle excitations, but neglecting excitonic effects they can be approximated by transitions between single particle states. There is no experimental indication of strong excitonic effects in metal hydrides. For instance, in LiH the binding energy of the lowest lying exciton is less than 0.05 eV.47,48 In this paper we assume that such excitonic effects can be neglected. In addition we neglect local field effects. If we consider quasi-particles as independent particles, then the imaginary part of the macroscopic dielectric function obtains the simple form49,50,51 ε(2) (ˆ q, ω) =
2 2
8π e V
lim
|q|→0
1 X 2
|q|
kvc
2
× |huck+q|uvk i| δ(ǫck+q − ǫvk − ~ω),(4) ˆ gives a direction, vk (ck) label single partiwhere q cle states that are occupied (unoccupied) in the ground state, and ǫ, u are the single particle energies and the translationally invariant parts of the wave functions; V is the volume of the unit cell. We have assumed spin degeneracy. Almost all optical data on hydrides are obtained on micro- or nano-crystalline samples whose crystallites have a significant spread in orientation. The most relevant quantity then is the directionally averaged dielectric ˆ . Eq. (4) involves function, i.e., ε(2) (ω) averaged over q calculating uck+q for small q and each k and extrapolating to q = 0. Details can be found in Ref. 52.
The summation over the Brillouin zone in Eq. (4) is performed using a weighted tetrahedron scheme.53 We found that this scheme allows for a faster convergence with respect to the number of k-points than various smearing methods. To calculate the dielectric tensor, we use the same plane wave kinetic energy cutoff and k-point mesh as for the DFT/GGA calculations. The number of empty bands included is sufficiently large as to describe all transitions up to at least 16 eV. If the imaginary part of the dielectric function, ε(2) (ω), is calculated for all frequencies ω, then the real part, ε(1) (ω), can be obtained by a Kramers-Kronig transform. The static component ε(1) (0) = ε∞ can also be calculated using density functional perturbation theory. Since the latter calculation includes local field effects, comparing ε∞ obtained with the two techniques is a way of assessing the importance of these effects.52 In order to produce the right band gap one should use the GW QP energies in Eq. (4). The k-point mesh used in an ordinary GW calculation is not sufficiently dense to obtain an accurate dielectric function, however, and it is computationally very expensive to increase the density of this mesh. As we will show below, the main difference between the GW and the GGA energies for the systems studied, is the size of the band gap between the occupied and the unoccupied states. The differences between the dispersions of the GW and GGA bands are relatively small. Therefore we adopt a simple “scissors” operator approximation for the energy differences in Eq. (4),51 GGA GW GGA ǫck+q − ǫvk = ǫGGA + Egap − Egap . ck+q − ǫvk
III. A. 1.
(5)
RESULTS
Simple hydrides Test calculations
Calculations on LiH and NaH are relatively straightforward because these compounds have a simple rocksalt structure. They can be used to benchmark the calculations. The calculated single particle band gaps of LiH and NaH are listed in Table I. As is usual, DFT severely underestimates the gap, with LDA giving smaller values than GGA. Our calculated GW gaps for LiH and NaH are close to those obtained in recent PAW all-electron GW calculations.54,55 As stated in the previous section, our calculations use pseudopotentials and take into account explicitly the valence electrons only. The GW band gaps as calculated from the QP energies obtained by solving Eq. (2), are indicated by EgGW in Table I. They are somewhat larger than the PAW values. If one applies the core correction of Eq. (3), our GW band gaps become somewhat smaller than the PAW values, as shown by the column marked EgGW,core in Table I. The differences between the pseudopotential and the PAW GW gaps are small, however, i.e. of the order of 2-4% and
4 TABLE I: Single particle band gaps Eg (eV) of simple hydrides from DFT (GGA and LDA) and GW calculations. EgGW,core refers to applying the correction of Eq. (3). LiH NaH MgH2 AlH3 a Ref.
EgGGA EgLDA EgGW EgGW,core GW lit. 3.00 2.61 4.75 4.54 4.64a , 5.24b , 5.37c 4.99exp,d 3.79 3.42 5.87 5.50 5.68e 3.79 3.36 5.64 5.32 5.25f , 5.58g 2.18 1.79 4.31 3.54
TABLE II: Valence band widths (eV) from DFT (GGA and LDA) and GW calculations. The directionally averaged real part of the static dielectric constant, calculated with (LF E) and without local field effects. LiH NaH MgH2 AlH3
GGA 5.41 3.58 6.34 8.60
LDA 5.62 4.00 6.62 8.82
GW 5.81 3.99 6.66 8.92
ε∞ LF E 4.28 3.03 3.90 4.43
ε∞ 4.34 3.06 3.98 4.55
54
b COHSEX, c Ref. 56
Ref. 48
d Experimental e Ref. 55 f cited in g Ref. 58
2.
LiH and NaH
gap at T = 4.2 K, Ref. 47
Ref. 57
the PAW values are in between the EgGW,core and EgGW values. The band gap of LiH given in Ref. 48 has been calculated using the rather crude COSHEX approximation, which is known to lead to a much higher gap.54 The value given in Ref. 56 is much higher than that obtained in other GW calculations, including ours, for which we have no explanation. The experimental band gap of LiH is higher than the calculated GW values,47 but the difference is within the usual 5-10%.38,39 To our knowledge no experimental data are available for NaH. The band gap of MgH2 is calculated for the optimized rutile or α-structure,7 which is the most stable structure at room temperature and ambient pressure.59 The EgGW,core value we obtain is very close to that cited in Ref. 57. A recently obtained PAW value for the band gap of MgH2 is again in between our EgGW,core and EgGW values.58 For AlH3 no other data are available to our knowledge. One can observe that core effects are relatively large in this compound. In the following we will use the EgGW,core values. The validity of using the scissors operator approximation for calculating the optical response, see Eq. 5, is illustrated by comparing band widths calculated with DFT and GW . The valence band widths are given in Table II. The difference between the GW and the LDA values is within 3% and the difference between the GW and the GGA values is within 10%. Note that the latter is on the same scale as the difference between the LDA and the GGA values. This accuracy is acceptable for our purposes. We have also checked in more detail that the dispersions of the individual bands in the DFT and GW band structures are very similar. Table II also lists the static dielectric constant calculated with and without local field effects. The small differences between these numbers indicate that it is reasonable to neglect local field effects in calculating the dielectric function.
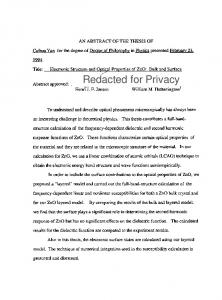
The calculated optimized lattice parameters of LiH and NaH in the rock salt structure are 4.02 and 4.83 ˚ A, respectively. These values are somewhat smaller than the experimental lattice parameters of 4.09 and 4.91 ˚ A due to neglecting the zero point motions of the hydrogen atoms, as discussed in Ref. 60. The band structures and the directionally averaged ε(2) (ω) of LiH and NaH are shown in Fig. 1. The valence bands in both LiH and NaH are strongly dominated by hydrogen, which reflects the ionic character of the bonding.48,54,55,56 The conduction bands have a mixed hydrogen and cation character. The lattice parameter of LiH is significantly smaller than that of NaH. Because of the smaller distance between the hydrogen atoms the band widths in LiH are generally larger than in NaH. This is most easily observed in the valence band, whose dispersion is quite similar in LiH and NaH, but the (GW ) valence band width in LiH is 5.81 eV, whereas in NaH it is 3.99 eV. The conduction bands of the two compounds are qualitatively different. In LiH the conduction band minimum is at X, whereas in NaH it is at L, which causes the gap in LiH to be direct, whereas in NaH it is indirect. In NaH there is little participation of cation states in the lower lying conduction bands. A calculation on an fcc lattice of H− ions with the NaH lattice parameter and a homogeneous background charge instead of the Na+ cations, gives essentially the same band structure. In LiH the participation of the Li cations to the conduction band is larger. The conduction band minimum at X is lowered in energy because here the Li-2p state participates in a bonding combination with hydrogen states. Similarly, the conduction band minimum at L is raised in energy because the Li-2s state contributes to an anti-bonding combination with hydrogen states. The differences between the band structures of LiH and NaH lead to markedly different dielectric functions, as is shown in the lower panel of Fig. 1. The calculated direct optical gap in LiH is 4.54 eV, whereas in NaH it is a much larger 6.37 eV. The main peak in the NaH spectrum originates from transitions at L and X, whose onset is at comparable photon energies. Both valence and conduction bands of NaH have hydrogen character and the oscillator strength of these transitions is rather large.
5 LiH
12
10
10
E - EF (eV)
12 8
8
6
6
4
4
2
2
0
0
-2
-2
-4 W
Γ
L
Γ
X W K
-4 W
Γ
L
14 12 10 8 6 4 2 0 -2 -4 -6 -8 -10 X
X W K
Γ
NaH
LiH
16
14
12
12
10
10
8
6
4
4
2
2 6
8
10
12
14
4 6 ω (eV)
14 12 10 8 6 4 2 0 -2 -4 -6 -8 -10 R Z
8
10
Γ
Z
R
12
14
16
A
Γ
M
AlH3
Γ
P1
MgH2
Γ P2
A
4
5
6
12
14
D
AlH3 0.1
0 3
8
6
0 4
MgH2
16
14
ε(2)(ω)
ε(2)(ω)
NaH
14
E - EF (eV)
14
0 4
6
8
10
12
14
4 6 ω (eV)
8
10
16
FIG. 1: Upper panels: electronic band structures of LiH and NaH. The zero of the energy scale is at the top of the valence band. Lower panels: imaginary parts of the directionally averaged macroscopic dielectric functions of LiH and NaH. The calculated optical gaps of LiH and NaH are 4.54 and 6.37 eV, respectively. Unless explicitly stated otherwise, the results presented in the figures are based upon GGA calculations modified by a scissors operator extracted from the GW results.
FIG. 2: Upper panels: electronic band structures of MgH2 and AlH3 . The zero of the energy scale is at the top of the valence band. P1 and P2 correspond to the points (0.5,-1,0.5) and (0.5,0.5,0.5). Lower panels: imaginary parts of the directionally averaged macroscopic dielectric functions of MgH2 and AlH3 . The calculated optical gaps of MgH2 and AlH3 are 6.19 and 3.54 eV, respectively.
The result is a sharp and dominant peak just above the onset of the optically allowed transitions. The optical spectrum of LiH has more structure. The onset at 4.54 eV is due to transitions at X, and at a somewhat higher energy transitions near K and W contribute. At energies ∼ 9 eV transitions at L become allowed, which results in a peak in the dielectric function at that energy. Since the bands of LiH have a larger dispersion than those of NaH, the optical response of LiH is spread out over a larger energy range.
The band structure of MgH2 is shown in Fig. 2. Our results are in general agreement with those obtained in previous work.58,62 There is a small hybridization between the H and the Mg states in the valence bands, with the lowest two valence bands having some Mg s and the highest two having some Mg p character, respectively. As in the case of LiH and NaH, the valence bands have a dominant hydrogen character, however. The conduction bands have a mixed magnesium hydrogen character and the bottom of the conduction band has a considerable Mg 3s contribution. MgH2 has a calculated indirect gap of 5.32 eV, see Table I, whereas the direct optical gap is 6.19 eV. The experimental optical gap obtained in Ref. 57 is 5.6 ± 0.1 eV, which would indicate that our GW result overestimates the gap by 10%.
3.
MgH2
α-MgH2 has the rutile structure, i.e. space group P 42 /mnm with Mg, H atoms in 2a, 4f Wyckoff positions, respectively, and two formula units per unit cell. The optimized calculated lattice parameters are a = 4.52 ˚ A and c = 3.01 ˚ A, with the H atoms at x = 0.304. This is in good agreement with the experimental values a = 4.50 ˚ A, c = 3.01 ˚ A and x = 0.304.61 The magnesium atoms are sixfold octahedrally coordinated by the hydrogen atoms at distances between 1.94 and 1.96 ˚ A. Each MgH6 octahedron shares the hydrogen atoms at its corners with neighboring octahedra. Each hydrogen atom is shared by three octahedra and is therefore coordinated by three magnesium atoms.
The lower panel of Fig. 2 shows the dielectric function of MgH2 . The onset of optical transitions occurs almost at the same energy at various regions throughout the Brillouin zone, which results in a steep rise of the dielectric function and a peak close to 8 eV. At energies above 9 eV transitions from the lower valence bands start to play a role, see for instance the interval Z-M in the upper panel of Fig. 2. This results in a shoulder in the dielectric function at ∼ 9 eV. Finally, the shoulder at ∼ 11 eV in the spectrum involves transitions to higher lying conduction bands, associated with rather delocalized states having considerable Mg character.
6 4.
AlH3
AlH3
LDOS [states / (atom eV)]
Al d Al p Al s
0.04
0.02
0 0.3
Hd Hp Hs
0.2 0.1 0
DOS [states / (cell eV)]
AlH3 has a rhombohedral structure with space group R3c and the Al, H atoms in the 6b, 18e Wyckoff positions, respectively. The unit cell contains two formula units. The optimized lattice parameters are a = 4.49 ˚ A and c = 11.82 ˚ A, with the H atoms at x = 0.623. These values are in good agreement with the experimental values a = 4.45 ˚ A, c = 11.80 ˚ A and x = 0.628.63 The interatomic Al-Al distances in the ab plane and along the c axis are 4.45 ˚ A and 3.24 ˚ A, respectively. The aluminium atoms form a distorted face centered structure, where each Al atom is octahedrally coordinated by H atoms with an AlH distance of 1.75 ˚ A. Each AlH6 octahedron shares its corners with neighboring octahedra and each H atom at a corner forms a bridge between two Al atoms. Since these bridges are not linear, i.e. the Al-H-Al bond angle is 141o, the octahedra are tilted with respect to one another. The band structure of AlH3 is shown in Fig. 2. There is hybridization between H and Al states, but the six valence bands are dominated by hydrogen, as are the valence bands of the other hydrides. In contrast to MgH2 , AlH3 has a direct band gap, which is located at Γ. The band gap is 3.54 eV, which is notably smaller than the gap in the other hydrides discussed above. This is caused by a single conduction band that disperses to ∼ 2 eV below the other conduction bands. This band has a large Al 3s contribution. The dielectric function of AlH3 is shown in the lower panel of Fig. 2. Although the optical response starts at the direct gap of 3.54 eV, see the inset in Fig. 2, it reaches significant values only above 6 eV. The weak response between 3.54 and 6 eV is caused by the fact that only a single conduction band contributes with a low density of states. Moreover, since that band has Al 3s character, whereas the valence bands have dominant H character, the oscillator strength of these transitions is small. The dielectric function rises sharply above 6 eV and peaks above 7 eV. The spectrum has a distinct broad shoulder between 9 and 10 eV and also some weaker shoulders at higher energies. In order to interpret the dielectric function it is instructive to analyze the total density of states (DOS) and the local density of states (LDOS) of AlH3 . These are shown in Fig. 3. The valence DOS has a sharp peak just below the Fermi level and two broad peaks at ∼ −2.5 eV and ∼ −6 eV below the Fermi level. These three peaks originate from respectively 3s, 3p and 3d aluminium states hybridizing with the 1s hydrogen states, as can be observed in the upper two panels of Fig. 3. In the solid the states are broadened into strongly overlapping bands. In the dielectric function transitions from the highest two of these valence peaks gives rise to the structure between 6 and 10 eV in Fig. 2. The energy associated with transitions from the lowest valence peak is too high to give any significant contribution to the dielectric function. Qualitatively the optical spectra of AlH3 and MgH2 show some similarity, despite the difference in structure
LDOS [states / (atom eV)]
0.06
total
3 2 1 0 -10
-8
-6
-4
-2
0 2 4 E - EF (eV)
6
8
10
12
FIG. 3: (Color online) Local densities of states (LDOS) in atomic angular momentum projection; bottom panel: total density of states. The Fermi energy is at the top of the valence band.
between these materials. In both cases the dielectric function sharply rises above 6 eV and peaks between 7 and 8 eV. The spectrum of AlH3 is broader due to a larger dispersion of the bands, reflecting the somewhat denser packing of the hydrogen atoms in this compound. From Fig. 1 one observes that the dielectric function of NaH also rises steeply above 6 eV and peaks just above 7 eV. The spectrum of NaH is narrower than that of MgH2 and AlH3 , reflecting the less dense packing of hydrogen atoms in this compound, which results in a smaller band dispersion. Only the spectrum of LiH is qualitatively different as it rises below 5 eV in a broad shoulder. As discussed in Sec. III A 2, there is a significant contribution from the Li states in this case. B.
The binary hydrides Li3 AlH6 and Na3 AlH6
The optimized atomic positions of Li3 AlH6 and Na3 AlH6 are given in Table III. Both Li3 AlH6 and Na3 AlH6 consist of a stacking of AlH6 octahedra and alkali cations. The octahedra are slightly distorted with Al-H distances of 1.75 ˚ A in Li3 AlH6 and 1.78 to 1.80 ˚ A in Na3 AlH6 . These compounds contain a relatively large
7 TABLE III: Optimized atomic positions in the binary hydrides. The labels “1a” etc. refer to the Wyckoff positions. The cell parameters are taken from the references. The structures are in good agreement with previous experimental and theoretical work.8,26,27,28,64,65,66,67,68,69
TABLE IV: Single particle band gaps Eg (eV) of the binary hydrides calculated with DFT (GGA and LDA) and GW . EgGW,core refers to applying the correction of Eq. (3); optGW refers to the direct optical gap
Compound Space group unit cell Li3 AlH6 R¯ 3 (148)a a = 5.64 ˚ A α = 91.4◦
Li3 AlH6 Na3 AlH6 LiAlH4 NaAlH4 Mg(AlH4 )2
Na3 AlH6
P 21 /n (14)b a = 5.51 ˚ A b = 5.67 ˚ A A c = 7.91 ˚ β = 89.9◦
LiAlH4
P 21 /c (14)c a = 4.84 ˚ A b = 7.81 ˚ A c = 7.83 ˚ A β = 112.1◦
NaAlH4
I41 /a (88)d a = 5.01 ˚ A c = 11.31 ˚ A P¯ 3m1 (164)e a = 5.23 ˚ A A c = 6.04 ˚
Mg(AlH4 )2
6f 1a 1b 6f 6f 2b 4e 2a 4e 4e 4e 4e 4e 4e 4e 4e 4e 4b 4a 16f 1a 2d 2d 6i
Li Al Al H H Na Na Al H H H Li Al H H H H Na Al H Mg Al H H
x
y
z
0.9329 0 1/2 0.7054 0.7941 0 0.9908 0 0.0983 0.2331 0.1583 0.5727 0.1395 0.1784 0.3561 0.2394 0.7953 0 0 0.2354 0 1/3 1/3 0.1680
0.4396 0 1/2 0.9287 0.5885 0 0.4566 0 0.0515 0.3327 0.2622 0.4650 0.2016 0.0988 0.3720 0.0816 0.2631 1/4 1/4 0.3900 0 2/3 2/3 -0.1680
0.7512 0 1/2 0.0675 0.4518 1/2 0.2553 0 0.2125 0.5413 0.9347 0.8254 0.9314 0.7614 0.9775 0.1142 0.8714 5/8 1/8 0.5454 0 0.7064 0.4415 0.8118
a Ref.
70 28 8 d Ref. 71 e Ref. 7 b Ref. c Ref.
fraction of alkali cations. Since sodium atoms are larger than lithium atoms, the distance between the AlH6 octahedra in Na3 AlH6 is considerably larger. The AlAl distance in Na3 AlH6 is 5.59 ˚ A, whereas in Li3 AlH6 it is 4.88 ˚ A. As for the simple hydrides discussed in Sec. III A 2, this size effect leads to noticeable differences in the electronic structure and the optical properties of Li3 AlH6 and Na3 AlH6 . The local electronic densities of states (LDOS) of both compounds is given in Fig. 4. As in AlH3 the valence bands have dominant hydrogen character, although there is Al character mixed in. The splitting into three peaks with approximate relative intensity 1:3:2 can be interpreted in terms of an octahedral ligand field splitting.28 The peaks correspond respectively to the 3s, 3p and 3d(eg ) aluminum states hybridizing with the 1s hydrogen levels in the AlH6 octahedra. As can be observed in Fig. 4 the spd splitting in Li3 AlH6 and Na3 AlH6 is comparable, which reflects the similarity of the AlH6 octahedral structure in both compounds. Comparing to Fig. 3 one observes that the splitting is also comparable
EgGGA 3.65 2.54 4.67 4.63 4.40
EgLDA 3.13 2.00 4.19 4.12 3.99
EgGW,core 5.10 3.94 6.55 6.41 6.48
optGW 5.31 3.94 6.89 6.50 6.87
to that in AlH3 , again suggesting the similarity in the octahedral structure. The interaction between the octahedra in the solid results in a broadening of the three peaks. Unlike in AlH3 the AlH6 octahedra in Li3 AlH6 and Na3 AlH6 are not directly connected, which limits the interaction and the broadening. Therefore, the three peaks remain nonoverlapping. One expects their widths to increase as the distance between the octahedra decreases and indeed the valence peaks in the DOS of Li3 AlH6 are wider than in Na3 AlH6 . The conduction band of both compounds is rather featureless up to at least 22 eV. There is somewhat more cation s character at the bottom of the conduction band in Na3 AlH6 , whereas the bonding in Li3 AlH6 probably has a somewhat more covalent character, as in the simple hydrides. The calculated band gaps are given in Table IV. As discussed in Sec. III A 1, DFT calculations severely underestimate the gap, with LDA giving a ∼ 0.5 eV smaller value than GGA. The most important results are in the last two columns of Table IV, which give the GW single particle gap and the direct optical gap. The single particle gap is indirect in Li3 AlH6 and direct in Na3 AlH6 .73 The fairly large difference between the gaps of Li3 AlH6 and Na3 AlH6 is striking. Moreover, the fact that the gap of Li3 AlH6 is larger is somewhat counterintuitive. Naively one would expect that the larger broadening of the AlH6 octahedron levels discussed above would narrow the gap, since it leads to a larger valence band width. The origin of the band gap difference between Li3 AlH6 and Na3 AlH6 is discussed in Sec. IV. The directionally averaged dielectric functions of Li3 AlH6 and Na3 AlH6 are shown in Fig. 5. The dielectric function of Li3 AlH6 has a shoulder starting above 6 eV, a peak just above 8 eV and a shoulder below 12 eV. Since the conduction band DOS is rather uniform and featureless up to at least 22 eV, these features in the dielectric function can be directly linked to transitions from the three octahedron valence peaks. Despite the much smaller band gap of Na3 AlH6 the dielectric function starts to increase appreciably only at an energy between 5 and 6 eV, which is not that much lower than in Li3 AlH6 . Transitions from the top two valence peaks give rise to the complicated pattern between 6 and 9 eV; transitions from the third valence peak gives the
8
Na3AlH6
Li3AlH6 0.5
Li d Li p Li s
0.4 0.3
Na d Na p Na s
LDOS [states / (atom eV)]
0.2 0.1 0
Al d Al p Al s
0.4 0.3 0.2 0.1 0
Hp Hs
0.4 0.3 0.2 0.1 0 -10 -8
-6
-4
-2
0
2
4
6
8 -10 -8 E - EF (eV)
-6
-4
-2
0
2
4
6
8
10
FIG. 4: (Color online) Local densities of states (LDOS) of Li3 AlH6 and Na3 AlH6 .72 For clarity the area under the d-line is shaded. The Fermi energies are at the top of the valence band. The conduction band DOS is almost constant up to at least 22 eV.
Li3AlH6
12
Na3AlH6
C.
The binary hydrides LiAlH4 , NaAlH4 and Mg(AlH4 )2
10
ε(2)(ω)
8 6 4 2 0 4
6
8
10
12
14
4 6 ω (eV)
8
10
12
14
16
FIG. 5: Imaginary parts of the directionally averaged macroscopic dielectric functions of Li3 AlH6 and Na3 AlH6 .
above 10 eV. Qualitatively these spectra have a resemblance to that of AlH3 , see Fig. 2, reflecting the dominant role played by the AlH6 octahedra.
The optimized structures of LiAlH4 , NaAlH4 and Mg(AlH4 )2 are given in Table III. For LiAlH4 and NaAlH4 we have used the experimental unit cells and optimized the atomic positions only; for Mg(AlH4 )2 we have also optimized the size and shape of the unit cell.7 All three materials consist of a packing of AlH4 tetrahedra and alkali or alkaline earth cations. The tetrahedra are slightly distorted and the Al-H distances vary from 1.62 to 1.65 ˚ A in LiAlH4 , 1.64 ˚ A in NaAlH4 and from 1.60 to 1.62 ˚ A in Mg(AlH4 )2 . Unlike the two compounds discussed in the previous section, the volume fraction taken up by the cations is relatively small and the distance between the AlH4 tetrahedra is hardly influenced by the size of the cations. The Al-Al distance is 3.75 ˚ A in LiAlH4 , 3.78 ˚ A in NaAlH4 and 3.86 ˚ A in Mg(AlH4 )2 . The LDOS of LiAlH4 , NaAlH4 and Mg(AlH4 )2 is shown in Fig. 6. As for the compounds discussed before, the valence bands have dominant hydrogen character with some Al character mixed in. The splitting into two peaks with approximate relative intensity 1:3 is due to a tetrahedral ligand field splitting of the Al 3p and 3s levels hybridized with H 1s levels in AlH4 .28 The
9
LiAlH4 0.5 0.4 0.3
Li d Li p Li s
Mg(AlH4)2
NaAlH4
Mg d Mg p Mg s
Na d Na p Na s
LDOS [states / (atom eV)]
0.2 0.1 0 0.4 0.3
Al d Al p Al s
0.2 0.1 0 0.4
Hp Hs
0.3 0.2 0.1 0 -10 -8 -6 -4 -2 0 2 4 6 8 10 -8 -6 -4 -2 0 2 4 6 8 -10 -8 -6 -4 -2 0 2 4 6 8 10 E - EF (eV)
FIG. 6: (Color online) Local densities of states (LDOS) of LiAlH4 , NaAlH4 and Mg(AlH4 )2 .72 For clarity the area under the d-line is shaded. The Fermi energies are at the top op of the valence band. The conduction band DOS is almost constant up to at least 22 eV.
LiAlH4
12
Mg(AlH4)2
NaAlH4
10 8 ε(2)(ω)
splitting is comparable in all three compounds, which reflects the similarity of the structure and bonding of the AlH4 tetrahedra in these compounds. The interaction between the tetrahedra causes a broadening of these levels in the solid. Fig. 6 shows that also the resulting band widths of these valence states is comparable in all three compounds. Apparently the widths are not extremely sensitive to the details of the structure, which are quite different for LiAlH4 , NaAlH4 and Mg(AlH4 )2 . They are sensitive to the distance between the tetrahedra, but this is comparable for the three compounds. Compared to the valence bands, the features in the conduction bands are less distinct. Both in NaAlH4 and in Mg(AlH4 )2 the bottom of the conduction band has considerable s character derived from the empty 3s state of the cation. The conduction band in LiAlH4 is featureless. The LDOS on the Al atoms is very similar in NaAlH4 and in Mg(AlH4 )2 , but there are small differences with LiAlH4 . There is significant Al d character in the valence band in the latter compound, and almost none in the other two compounds. In the conduction band of LiAlH4 there is a considerable Al s contribution, and much less in the other compounds. In order to evaluate these differences we have also calculated the LDOS for the LiAlH4 structure with the
6 4 2 0 4
6
8 10 12 14
4
6
8 10 12 14 ω (eV)
4
6
8 10 12 14 16
FIG. 7: Imaginary parts of the directionally averaged macroscopic dielectric functions of LiAlH4 , Na3 AlH6 and Mg(AlH4 )2 .
Li+ ions replaced by a uniform positive background. The LDOS on the Al atoms then becomes very similar to that in the NaAlH4 and Mg(AlH4 )2 compounds. All these features indicate that NaAlH4 and Mg(AlH4 )2 can be considered as ionic compounds, i.e., as a packing of AlH− 4 anions and Na+ or Mg2+ cations, whereas in LiAlH4 there may be a stronger covalent contribution. The calculated band gaps are given in Table IV. The
10
IV.
DISCUSSION
The electronic structure and the dielectric function of the binary compounds discussed in Secs. III B and III C are foremost determined by the lattice of (AlH6 )− octahedra and (AlH4 )− tetrahedra, respectively, whereas the cations have a minor influence. In this section we will discuss this proposition in more detail. The exact value of the band gap is not important in this discussion, only its relative variation with structure and composition. Since the latter is described qualitatively by DFT/GGA calculations, see Table IV, we will only use GGA results in this section. We have calculated the dielectric functions of lat− tices of (AlH4 ) tetrahedra in the LiAlH4 , NaAlH4 and Mg(AlH4 )2 structures, but with the Li+ , Na+ and Mg2+ cations replaced by a uniform positive background charge. The results are compared to the dielectric functions of the real compounds in Fig. 8. It can be observed that removing the cations in LiAlH4 hardly changes the dielectric function. Removing the cations in NaAlH4 results in a slight shift of the dielectric response to higher energies. This is related to the disappearance of the peak at the bottom of the conduction band, which has a sodium s character, see the middle panel of Fig. 6. Also in Mg(AlH4 )2 removing the cations results in small changes in the dielectric function only. These are mainly caused by the disappearance of the magnesium related peaks at the bottom of the conduction band and a resulting flattening of the conduction bands, see the right panel of Fig. 6. In conclusion, although removing the cations results in small changes in the conduction band, overall the dielectric function changes very little, which means that it − is foremost determined by the lattice of (AlH4 ) anions. Such a behavior is not uncommon for ionic compounds.
12
LiAlH4
Mg(AlH4)2
NaAlH4
10 8 ε(2)(ω)
GW single particle band gaps of the three compounds are almost the same and also in the optical gaps there is very little difference.74 This similarity indicates that the electronic structure around the band gap is foremost − determined by the (AlH4 ) tetrahedra. The distances between these tetrahedra are similar in these three compounds and apparently the detailed differences in their packing are relatively unimportant. This conclusion is strengthened by the dielectric function, which is shown in Fig. 7. The maximal dielectric response of Mg(AlH4 )2 is somewhat smaller than that of LiAlH4 and NaAlH4 , but the shape of the three curves is remarkably similar. The double peak structure of the valence band of the LDOS, which appears in all three compounds in Fig. 6, is almost washed out in the dielectric response. Transitions from the lowest valence band can be recognized only as a faint shoulder near 10 eV. It is then not surprising that the smaller differences between the LDOS of LiAlH4 and the other two compounds do not influence the dielectric functions much.
6 4 2 0 4
6
8
4
6
ω (eV)
8
4
6
8
10
FIG. 8: (Color online) Dielectric functions of MAlH4 compounds (black, solid) and of the corresponding systems with Li+ , Na+ , and Mg2 + ions substituted by a uniform background charge (red, dashed). These results are based upon GGA calculations without scissors operator cerrection.
For instance, in alkali halides such as NaCl both the top of the valence band and the bottom of the conduction band are determined by the anion lattice.75,76 Going one step further one can correlate the relative size of the band gap with the distance between the anions. We will illustrate this using the DOS of Mg(AlH4 )2 , which is shown in Fig. 9(a). Replacing the Mg2+ ions by a uniform positive background does not change the DOS significantly, as can be observed in Fig. 9(b). In Fig. 9(c)(e) the cell parameters are increased while the geometry − of the (AlH4 ) tetrahedra is fixed. As the distance between the anions increases, the band widths of all bands decreases, but those of the valence bands decrease much more rapidly. At a large distance the DOS is essentially − that of an isolated (AlH4 ) tetrahedron, where the valence states are split into states of s and p symmetry due to the tetrahedral ligand field. The upper states of p symmetry show a small splitting, since the tetrahedron has a small trigonal distortion. The gap between the highest valence state and the lowest conduction state in the isolated tetrahedron is only ∼ 0.5 times the band gap in the solid, compare Figs. 9(b) and 9(e). In general, the larger the distance between the anions, the smaller the gap. This result seems to be somewhat counterintuitive, as at the same time the valence and conduction band widths are decreasing and in general this would increase the gap. The result can be understood in terms of the electrostatic (Madelung) potential.77 Decreasing the lattice constant, the electrostatic potential on the anions becomes more attractive to electrons, due to the closer packing of the cations. The same argument also holds for a uniform positive background, i.e., a decreasing lattice constant leads to a more attractive Madelung potential on the anions. All states on the anions experience this potential and lower their energy. The size of this shift, however, depends upon the degree of localization of the state. If a states is completely localized, the Madelung potential will maximally lower its energy. On the other hand, if a state is completely delocalized, its energy shift is zero, since the system as a whole is
11 15
6
a 10 5
calculated gaps Ae2 / d fit
EgGGA (eV)
5 0
b
4
10 3
5 0
2 0
DOS [states / (cell eV)]
c
0.1
0.05
0.15
0.2
0.25
1/d (A-1)
10
FIG. 10: Calculated GGA band gaps of the expanded (AlH4 )− -lattice (circles) fitted to Ae2 /d (dashed line), whith d the distance between the anions; A = 1.57.
5 0
d 10
the band gaps of the binary compounds, see Table IV. In LiAlH4 , NaAlH4 and Mg(AlH4 )2 the Al-Al distance, which is a measure for the distance between the anions, is almost the same, so their band gaps are very close. The Al-Al distance in Li3 AlH6 is much smaller than in Na3 AlH6 , which explains the larger band gap in the former compound.
5 0
e 10 5 0 -8
-6
-4
-2
0
2
4
6
8
E - EF (eV) FIG. 9: GGA densities of state of (a) Mg(AlH4 )2 and (b) with the Mg2+ ions replaced by a uniform background charge. While fixing the geometry of the (AlH4 )− ions, the lattice is expanded by a factor of 1,5 (c), 2 (d), and 5 (e).
charge neutral. The key point is that in our systems the valence states are much more localized than the conduction states. This is immediately evident from Fig. 9(b)-(e), where the valence band widths decrease much faster with an increasing lattice constant than the conduction band widths. As a result, the more localized valence states increase their energy significantly faster with an increasing lattice constant than the conduction band states. Since this effect is much larger than the effect of the decreasing band widths, increasing the lattice constant results in a smaller band gap. This is quantified in Fig. 10, where the band gaps of the 2, 3, 4, 5 and 6 times expanded lattice are fitted to an expression Ae2 /d, with d the distance between the anions. The constant A = 1.57 represents the difference in localization of the valence and conduction states. This simple model breaks down if the localization of the states strongly depends upon d, i.e. in the 1.5 and 2 times expanded lattice. It occurs if d becomes sufficiently small, see Fig. 9(b). This concept can be used to interpret the trend in
V.
SUMMARY
In this paper the electronic structures and dielectric functions of the simple hydrides LiH, NaH, MgH2 and AlH3 , and the complex hydrides Li3 AlH6 , Na3 AlH6 , LiAlH4 , NaAlH4 and Mg(AlH4 )2 , have been studied by first principles calculations. The equilibrium structures of these compounds are obtained from DFT/GGA total energy minimizations. GW calculations within the QP approximation provide the single particle excitation energies, i.e., the electronic band structures. We use the G0 W0 approximation based upon LDA wave functions and eigenvalues. The difference between the dispersions of the GW and the GGA bands is less than 10%. Therefore, the band structures are well represented by GGA band structures that are corrected by applying a scissors operator between occupied and unoccupied states in order to obtain the GW band gap. From the single particle wave functions we then calculate the directionally averaged dielectric functions within RPA, neglecting exciton effects. We also neglect local field effects, but from calculations on static dielectric constants we conclude that this is a reasonable approximation. All compounds are large gap insulators with band gaps that vary from 3.5 eV in AlH3 to 6.5 eV in the MAlH4 compounds. In all cases the valence bands are dominated by the hydrogen atoms, whereas the conduction bands have mixed contributions from hydrogen and metal cation states. The band gap in LiH, AlH3 and Na3 AlH6 is direct, whereas in all the other compounds it is indirect. The optical response of most compounds is qual-
12 itatively similar, notwithstanding sizeable differences in their band structure and band gap. The dielectric function ε(2) (ω) rises sharply at photon energies corresponding to ∼ 6 eV, and around ∼ 8 eV it has a strong peak reaching values in the range 10-15. In the direct gap materials ε(2) (ω) has a weak tail going to lower energies. Between ∼ 8 and ∼ 12 eV, ε(2) (ω) gradually decreases to a value ≤ 2 at 12 eV. Most of the materials specific optical information can be found in this energy range, albeit in the form of relatively weak shoulders in ε(2) (ω). The electronic structure and the optical properties of the aluminium compounds can be interpreted in terms of aluminium hydride complexes, i.e., AlH6 octahedra in AlH3 , Li3 AlH6 and Na3 AlH6 , and AlH4 tetrahedra in LiAlH4 , NaAlH4 . Explicit calculations on lattices of these complexes, without the Li, Na, and Mg cations, show that the latter have a relatively small effect on the DOS and on the optical response. The distance be− tween the (AlH4 ) tetrahedra in LiAlH4 , NaAlH4 and Mg(AlH4 )2 is almost the same. Since the interaction between the tetrahedra is then similar, this explains why the optical spectra of these compounds are very similar. The same reasoning can be applied to Li3 AlH6 and
1
2
3
4
5
6
7
8
9
10
11
12
13
14
15
16
See, e.g., F. Sch¨ uth, B. Bogdanovic, and M. Felderhoff, Chem. Commun. 20, 2249 (2004). R. Griessen and A. Driessen, Phys. Rev. B and 30, 4372 (1984). K. Bohmhammel, U. Wolf, G. Wolf, and E. K¨ onigsberger, Thermo. Acta. 337, 195 (1999). C. Wolverton, V. Ozolins, and M. Asta, Phys. Rev. B 69, 144109 (2004). B. Bogdanovic and M. Schwickardi, J. Alloys Compd. 253, 1 (1997). B. Bogdanovic, M. Felderhoff, S. Kaskel, A. Pommerin, K. Schlichte, and F. Schuth, Adv. Math. 15, 1012 (2003). M. J. van Setten, G. A. de Wijs, V. A. Popa, and G. Brocks, Phys. Rev. B 72, 073107 (2005). O. M. Løvvik, S. M. Opalka, H. W. Brinks, and B. C. Hauback, Phys. Rev. B 69, 134117 (2004). O. M. Løvvik and P. N. Molin, Phys. Rev. B 72, 073201 (2005). A. Andreasen, T. Vegge, and A. S. Pedersen, J. Solid State Chem. 178, 3672 (2005). M. Mamatha, C. Weidenthaler, A. Pommerin, M. Felderhoff, and F. Schuth, J. Alloy. Compd. 416, 303 (2006). T. N. Dymova, D. P. Aleksandrov, V. N. Konoplev, T. A. Silina, and A. S. Sizareva, Russ. J. Coord. Chem 20, 263 (1994). R. Gremaud, A. Borgschulte, J. L. M. van Mechelen, W. Lohstroh, H. Schreuders, A. Z¨ uttel, B. Dam, and R. Griessen, Submitted to APL. (2005). J. N. Huiberts, R. Griessen, J. H. Rector, R. J. Wijnaarden, J. P. Dekker, D. G. de Groot, and N. J. Koeman, Nature 380, 231 (1996). J. W. J. Kerssemakers, S. J. van der Molen, N. J. Koeman, R. Gunther, and R. Griessen, Nature 406, 489 (2000). T. J. Richardson, J. L. Slack, R. D. Armitage, R. Kostecki,
3−
Na3 AlH6 in terms of a lattice of (AlH6 ) octahedra. However, the distance between the octahedra is smaller in the Li compound because of the smaller size of the cation. The band gap then becomes larger, which can be understood from the influence of the increased Madelung potential on the more localized valence states.
Acknowledgments
The authors wish to thank R. A. de Groot and P. J. Kelly for helpful discussions, J. Furthm¨ uller for the use of his optics package and G. Kresse for making the linear response routines in VASP available. This work is part of the research programs of ‘Advanced Chemical Technologies for Sustainability (ACTS)’ and the ‘Stichting voor Fundamenteel Onderzoek der Materie (FOM)’. The use of supercomputer facilities was sponsored by the ‘Stichting Nationale Computerfaciliteiten (NCF)’. These institutions are financially supported by ‘Nederlandse Organisatie voor Wetenschappelijk Onderzoek (NWO)’.
17
18
19
20
21
22 23
24
25
26
27
28
29
30
B. Farangis, and M. D. Rubin, Appl. Phys. Lett. 78, 3047 (2001). W. Lohstroh, R. J. Westerwaal, B. Noheda, S. Enache, I. A. M. E. Giebels, B. Dam, and R. Griessen, Phys. Rev. Lett. 93, 197404 (2004). W. Lohstroh, R. J. Westerwaal, J. L. M. van Mechelen, C. Chacon, E. Johansson, B. Dam, and R. Griessen, Phys. Rev. B 70, 165411 (2004). P. Kumar and L. K. Malhotra, Thin Solid Films 491, 270 (2005). A. C. Lokhorst, B. Dam, I. A. M. Giebels, M. S. Welling, W. Lohstroh, and R. Griessen, J. Alloy. Compd. 404, 465 (2005). M. Kremers, N. J. Koeman, R. Griessen, P. H. L. Notten, R. Tolboom, P. J. Kelly, and P. A. Duine, Phys. Rev. B 57, 4943 (1998). J. A. Dilts and E. C. Ashby, Inorg. Chem. 11, 1230 (1972). T. N. Dymova, V. N. Konoplev, D. P. Aleksandrov, A. S. Sizareva, and T. A. Silina, Koord. Khim. 21, 175 (1995). K. J. Gross, E. H. Majzoub, and S. W. Spangler, J. Alloys Compd. 356, 423 (2003). A. Z¨ uttel, S. Rentsch, P. Fischer, P. Wenger, P. Sudan, P. Mauron, and C. Emmenegger, J. Alloys Compd. 356, 515 (2003). M. Fichtner, J. Engel, O. Fuhr, A. Gloss, O. Rubner, and R. Ahlrichs, Inorg. Chem. 42, 7060 (2003). M. E. Arroyo y de Dompablo and G. Ceder, J. Alloys Compd. 364, 6 (2003). A. Peles, J. A. Alford, Zhu Ma, Li Yang, and M. Y. Chou, Phys. Rev. B 70, 165105 (2004). J. P. Perdew, J. A. Chevary, S. H. Vosko, K. A. Jackson, M. R. Pederson, D. J. Singh, and C. Fiolhais, Phys. Rev. B 46, 6671 (1992). G. Kresse and D. Joubert, Phys. Rev. B 59, 1758 (1999).
13 31 32
33
34 35
36
37
38
39
40
41
42
43
44
45
46
47
48
49 50 51
52
53
54
55
P. E. Blochl, Phys. Rev. B 50, 17953 (1994). G. Kresse and J. Furthm¨ uller, Phys. Rev. B 54, 11169 (1996). G. Kresse and J. Furthm¨ uller, Comput. Mater. Sci. 6, 15 (1996). G. Kresse and J. Hafner, Phys. Rev. B 47, 558 (1993). M. S. Hybertsen and S. G. Louie, Phys. Rev. B 34, 2920 (1986). R. W. Godby, M. Schl¨ uter, and L. J. Sham, Phys. Rev. B 37, 10159 (1988). The QP energies ǫnk are complex. The real parts comprise the band structure and are used as single particle excitation energies. The imaginary parts give the inverse QP lifetimes. F. Aryasetiawan and O. Gunnarsson, Rep. Prog. Phys. 61, 237 (1998). G. Onida, L. Reining, and A. Rubio, Rev. Mod. Phys. 74, 601 (2002). P. van Gelderen, P. A. Bobbert, P. J. Kelly, and G. Brocks, Phys. Rev. Lett. 85, 2989 (2000). P. van Gelderen, P. A. Bobbert, P. J. Kelly, G. Brocks, and R. Tolboom, Phys. Rev. B 66, 075104 (2002). V. A. Popa, G. Brocks, and P. J. Kelly, cond-mat/0507013 (2005). N. Troullier and J. L. Martins, Phys. Rev. B 43, 1993 (1991). M. M. Rieger, L. Steinbeck, I. D. White, H. N. Rojas, and R. W. Godby, Comput. Phys. Commun. 117, 211 (1999). H. N. Rojas, R. W. Godby, and R. J. Needs, Phys. Rev. Lett. 74, 1827 (1995). J. W. van der Horst, P. A. Bobbert, P. H. L. de Jong, M. A. J. Michels, G. Brocks, , and P. J. Kelly, Phys. Rev. B 61, 15817 (2000). V. G. Plekhanov, V. A. Pustovarov, A. A. O‘KonnelBronin, T. A. Betenekova, and S. O. Cholakh, Fiz. Tverd. Tela 18, 2438 (1976). S. Baroni, G. P. Parravicini, and G. Pezzica, Phys. Rev. B 32, 4077 (1985). S. L. Adler, Phys. Rev. 126, 413 (1962). N. Wiser, Phys. Rev. 129, 62 (1963). R. Del Sole and R. Girlanda, Phys. Rev. B 48, 11789 (1993). M. Gajdos, K. Hummer, G. Kresse, J. Furthm¨ uller, and F. Bechstedt, Phys. Rev. B 73, 045112 (2006). B. Adolph, J. Furthm¨ uller, and F. Bechstedt, Phys. Rev. B 63, 125108 (2001). S. Leb`egue, M. Alouani, B. Arnaud, and W. E. Pickett, Europhys. Lett. 63, 562 (2003). S. Leb`egue, B. Arnaud, M. Alouani, and P. E. Bloechl, Phys. Rev. B 67, 155208 (2003).
56 57
58
59
60 61
62 63 64
65
66
67
68
69
70
71
72
73
74
75
76
77
E. L. Shirley, Phys. Rev. B 58, 9579 (1998). J. Isidorsson, I. A. M. E. Giebels, H. Arwin, and R. Griessen, Phys. Rev. B 68, 115112 (2003). C. Moys´es, Ara´ ujo, S. Leb`egue, O. Eriksson, B. Arnaud, M. Alouani, and R. Ahuja, J. Appl. Phys. 98, 096106 (2005). P. Vajeeston, P. Ravindran, A. Kjekshus, and H. Fjellv˚ ag, Phys. Rev. Lett. 89, 175506 (2002). J. L. Martins, Phys. Rev. B 41, 7883 (1990). M. Bortz, B. Bertheville, G. B¨ ottger, and K. Yvon, J. Alloys Compd. 287, L4 (1999). R. Yu and P. K. Lam, Phys. Rev. B 37, 8730 (1988). J. W. Turley and H. W. Rinn, Inorg. Chem. 8, 18 (1969). E. R¨ onnebro, D. Nor´eus, K. Kadir, A. Reiser, and B. Bogdanovic, J. Alloys Compd. 299, 101 (2000). S. C. Chung and H. Morioka, J. Alloys Compd. 372, 92 (2004). A. Aguayo and D. J. Singh, Phys. Rev. B 69, 155103 (2004). P. Vajeeston, P. Ravindran, R. Vidya, H. Fjellv˚ ag, and A. Kjekshus, Apl. Phys. Lett. 82, 6951 (2003). B. C. Hauback, H. W. Brinks, and H. Fjellv˚ ag, J. Alloys Compd. 346, 184 (2002). Y. Song, R. Singh, and Z. X. Guo, J. Phys. Chem. B 110, 6906 (2006). H. W. Brinks and B. C. Hauback, J. Alloys Compd. 354, 143 (2003). B. C. Hauback, H. W. Brinks, C. M. Jensen, K. Murphy, and A. J. Maeland, J. Alloys Compd. 358, 142 (2003). We use atomic radii 0.79, 1.23, 1.59, 1.36 and 0.81 ˚ A for H, Li, Na, Mg and Al, respectively. In Ref. 28 a value of 4.6 eV is given for the single particle gap of Na3 AlH6 . This value is obtained by applying a G0 W0 shift to the GGA band gap, whereas we apply the shift to the LDA gap. The difference with our value of 3.94 eV then mainly reflects the difference between the LDA and GGA gaps, see Table IV. Experience indicates that applying a G0 W0 shift to the LDA gap generally results in a value that is within 10% of the experimental single particle gap, see Refs. 38,39. In Ref. 28 a value of 6.9 eV is given for the single particle gap of NaAlH4 . Again this value is obtained by applying a G0 W0 shift to the GGA band gap. P. K. de Boer and R. A. de Groot, Am. J. Phys. 67, 443 (1999). P. K. de Boer and R. A. de Groot, Eur. Phys. J. B 4, 25 (1998). J. C. Slater and W. Shockley, Phys. Rev. 50, 705 (1936).