APPLIED PHYSICS LETTERS
VOLUME 83, NUMBER 2
14 JULY 2003
Optical properties and electronic structure of rock-salt ZnO under pressure A. Seguraa) and J. A. Sans Institut de Cie`ncia dels Materials-Dpto. de Fı´sica Aplicada, Universitat de Vale`ncia, Ed. Investigacio´, E-46100 Burjassot (Vale`ncia), Spain
F. J. Manjo´n Departimento de Fı´sica Aplicada, Universitat Polite`cnica de Vale`ncia, 03801 Alcoy (Alicante), Spain
A. Mun˜oz and M. J. Herrera-Cabrera Departimento De Fı´sica Fundamental II, Universidad de la Laguna, 38204 La Laguna (Tenerife), Spain
共Received 10 February 2003; accepted 14 May 2003兲 This letter reports on the pressure dependence of the optical absorption edge of ZnO in the rock-salt phase, up to 20 GPa. Both vapor-phase monocrystals and pulsed-laser-deposition thin films on mica have been investigated. Rock-salt ZnO is shown to be an indirect semiconductor with a band gap of 2.45⫾0.15 eV, whose pressure coefficient is very small. At higher photon energies, a direct transition is observed 共4.6 eV at 10 GPa兲, with a positive pressure coefficient 共around 40 ⫾3 meV/GPa between 5 and 19 GPa兲. These results are interpreted on the basis of first-principles electronic band structure calculations. © 2003 American Institute of Physics. 关DOI: 10.1063/1.1591995兴 Zinc oxide 共ZnO兲 is attracting a renewed attention owing to its potential applications in ultraviolet optoelectronic devices.1 At room pressure, ZnO crystallizes in the wurtzite structure 共W-ZnO兲 and transits to the rock-salt structure 共RSZnO兲 at about 9 GPa.2 Upon decompression, the reverse transition in bulk crystals has a large hysteresis and occurs below 4 GPa.3,4 Several authors have claimed to be able to obtain metastable RS-ZnO at ambient conditions.5,6 This possibility has recently been proved for nanocrystalline samples in which the RS phase is maintained at ambient conditions after a pressure cycle up to 16 GPa.7 It has also been proved that thin films of Mgx Zn1⫺x O grown by pulsed laser deposition 共PLD兲 have the RS structure for x⬎0.5 with band-gap energies larger than 5 eV and increasing with the Mg content.8 Therefore, the knowledge of the electronic structure of RS-ZnO and, more specifically, of the nature and value of its band-gap, is a subject of interest for future technological applications of these nanocrystallites or thin films. Apart from being a powerful material preparation technique, high pressure is also a very efficient tool for understanding the electronic structure of semiconductors.9 However, relatively few experimental results have been reported on the electronic structure of W-ZnO under pressure,10–12 as compared to other II-VI compounds. The same holds for RS-ZnO, whose electronic properties have been investigated only in theoretical papers,13–15 which predict an indirect semiconductor character. In this letter, we report on the pressure dependence of the absorption edge of RS-ZnO measured at room temperature 共RT兲 and discuss the results on the basis of firstprinciples density-functional-theory calculations. For the optical absorption measurements, both W-ZnO bulk single crystals and thin films were used. Large bulk single crystals were grown by the vapor-phase method16 and broken into small splints with parallel faces and 15-m thick for measurements in the diamond anvil cell 共DAC兲. Thin a兲
Electronic mail:
[email protected]
films were prepared by PLD on mica monocrystalline substrates. The target for the thin-film preparation was a compressed pellet of 5N ZnO powder annealed at 950 °C for 6 h in air atmosphere. Samples were prepared at relatively low temperature (400 °C) with a dynamically controlled atmosphere of 5N oxygen at 2⫻10⫺4 mbar and then subjected to 6 h annealing in air at higher temperatures 共up to 600 °C). For optical absorption measurements in the UV-Vis-NIR range under pressure, a sample was placed together with a ruby chip into a 200-m-diameter hole drilled on a 50-mthick Inconel™ gasket and inserted between the diamonds of a membrane-type DAC.17 Methanol–ethanol–water 共16:3:1兲 was used as a pressure transmitting medium, and the pressure was determined through the ruby luminescence linear scale.18 The optical setup was similar to the one described in Ref. 17. It consists of a Xe lamp, fused silica lenses, reflecting optics objectives, and an UV-Vis spectrometer, which allows for transmission measurements up to the absorption edge of IIA diamonds 共about 5.5 eV兲. The electronic structure at different pressures of RS-ZnO has been calculated through the ab initio total energy pseudopotential plane wave method using the density functional theory 共DFT兲 in the framework of the local density approximation 共LDA兲. The semi-core 3d electrons of Zn are treated as forming part of the valence states. Plane waves up to 130 Ry energy cutoff were used in order to have highly convergent results. As regards the wurtzite phase, in both the bulk and thin film samples, a monotonous blueshift of the absorption edge is observed as pressure increases. In the experiment with bulk ZnO samples, the use of a 15-m-thick sample allows only for the observation of the low-energy tail of the absorption edge in W-ZnO. The transition from the W-ZnO bulk sample to the NaCl phase occurs at about 9.5⫾0.2 GPa, and is observed as a neat change in the shape of the absorption coefficient 关see Fig. 1共b兲兴. The absorption edge exhibits a structure related to the wurtzite phase up to 16 GPa. Above
0003-6951/2003/83(2)/278/3/$20.00 278 © 2003 American Institute of Physics Downloaded 23 Jul 2003 to 158.42.129.75. Redistribution subject to AIP license or copyright, see http://ojps.aip.org/aplo/aplcr.jsp
Appl. Phys. Lett., Vol. 83, No. 2, 14 July 2003
Segura et al.
279
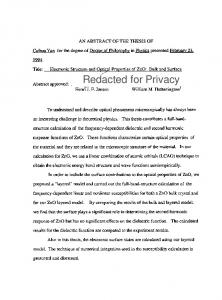
FIG. 3. RT absorption edge of rock-salt ZnO at different pressures, as measured in a thin film deposited on mica. Inset: pressure dependence of the photon energy at a constant absorption coefficient ( ␣ ⫽105 cm⫺1 ). FIG. 1. Change of the absorption coefficient at the wurtzite-to-rock-salt transition in ZnO thin films on mica 共a兲 and bulk samples 共b兲.
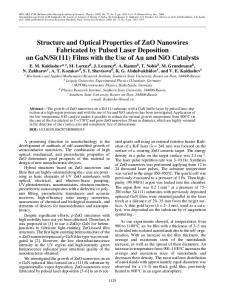
that pressure, and contrary to what happens for most highpressure phases of II-VI semiconductors, the sample does not exhibit any trace of light scattering and the absorption edge can be accurately measured. Figure 2 shows the absorption edge in RS-ZnO as measured in the down-stroke from 19 to 4 GPa with the bulk sample. The low-energy tail of the absorption edge has a quadratic dependence on the photon energy at all pressures, as illustrated in the inset of Fig. 2 for P⫽14.5 GPa. Then this tail can be assigned to an indirect transition with a band-gap of 2.47⫾0.02 eV 共at 14.5 GPa兲. At other pressures 共from 4.7 to 19.9 GPa兲 the band-gap values vary between 2.33 and 2.61 eV, but do not show any clear trend of pressure dependence. The average value would be 2.45⫾0.15 eV. This is about half the theoretical values predicted by correlated Hartree–Fock calculations 共5.54 eV兲13 or by quasiparticle methods 共4.51 eV兲.15 Our result is also to be compared to the extrapolated value of the band gap of RS-Mgx Zn1⫺x O thin films for x ⫽0, that is slightly higher than 3 eV.8 This is a normal dis-
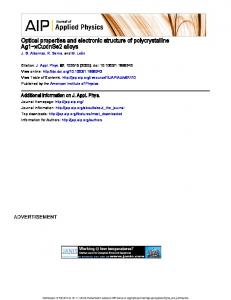
agreement, as transmission measurements in thin films are not sensitive to the low values of the absorption coefficient typical of indirect transitions and, consequently, yield overestimated band-gap values. Contrary to the low-energy tail, the absorption spectrum at higher photon energies exhibits a clear pressure dependence. Above 3.5 eV 共see Fig. 2兲, the absorption edge becomes steeper and blueshifts with a increasing pressure. The pressure coefficient, as determined from the shift of the photon energy at a constant absorption coefficient, is about 34 ⫾2 meV/GPa between 5 and 19 GPa. In ZnO/mica thin films the phase transition to the NaCl phase is observed also at about 9.5⫾0.2 GPa, as a sudden change in the absorption edge, from the step-like shape typical of the wurtzite phase, with its exciton-related maximum, to a structureless absorption tail 关see Fig. 1共a兲兴. As discussed earlier, the small thickness of the films prevents the observation of the indirect transition at 2.47 eV. Instead, an absorption edge at photon energies higher than 4.5 eV is observed, which is likely related to an allowed direct transition. Figure 3 shows this absorption edge at several pressures. The inset of Fig. 3 shows the pressure dependence of the direct gap, as determined from extrapolating the linear part of the ␣ 2 versus h v plot at each pressure. The pressure coefficient of this absorption edge is 40⫾3 meV/GPa. Figure 4 shows the pressure dependence of the ab initio calculated electronic band structure, on the basis of which we will discuss the experimental results. RS-ZnO turns out to be an indirect semiconductor. Its conduction band minimum 共CBM兲, located at the ⌫ point of the Brillouin zone 共BZ兲, is about 1.1 eV above the valence band maxima 共VBM兲, located at the L point and midway in the ⌫–K 共or ⌺兲 direction. The fundamental transition is correctly predicted to be indirect, even if the band gap is underestimated 共1.1 eV versus the experimental value of 2.45 eV兲. In the ⌫ point of the BZ in the RS structure (Oh point group兲 p and d states belong to different representations and do not mix. Away from the ⌫ point, p and d states mix and the resulting p – d repulsion results in the upwards dispersion of p bands in directions ⌫–K 共⌺兲 and ⌫–L 共⌳兲 of the BZ Consequently, the VBM
FIG. 2. RT absorption edge of rock-salt ZnO at different pressures, as measured in a bulk sample. Inset: square root of the absorption coefficient as a function of photon energy at 14.5 GPa. Downloaded 23 Jul 2003 to 158.42.129.75. Redistribution subject to AIP license or copyright, see http://ojps.aip.org/aplo/aplcr.jsp
280
Segura et al.
Appl. Phys. Lett., Vol. 83, No. 2, 14 July 2003
zinc-blende II-VI materials.22 According to that model, when p – d mixing is symmetry forbidden, one should expect deformation potentials for direct transitions at the ⌫ point to be close to those in light III-V zinc-blende compounds,22 as it actually happens in RS-ZnO. In the same direction, it is also relevant to notice that the ‘‘band-gap anomaly,’’ 20,21 illustrated in the II-VI wurtzite semiconductors by the larger band gap of ZnS 共3.7 eV兲 with respect to ZnO 共3.35 eV兲, does not occur in the RS phase: the band gap of RS-ZnO 共2.45 eV兲 is larger than the one of RS-ZnS 共2.0 eV兲.23 In summary, we have investigated the electronic band structure of rock-salt ZnO in bulk crystals and thin films observing the same wurtzite-to-rock-salt phase transition pressure (9.5⫾0.2 GPa) in both types of samples. RS-ZnO is an indirect gap semiconductor with a band gap of 2.45 ⫾0.15 eV 共at 13.5 GPa兲. An intense direct transition at higher energy 共about 4.5 eV at 10 GPa兲, with a large positive pressure coefficient (40⫾3 meV/GPa), has also been observed and assigned to the lowest direct transition at the ⌫ point of the BZ. Further investigations are needed to solve the discrepancy between the measured and calculated energies and pressure coefficients of the indirect band gaps. FIG. 4. Electronic band structure of rock-salt ZnO along high-symmetry directions of the BZ at several pressures, as calculated through ab initio DFT-LDA pseudopotential method.
occurs away from the ⌫ point and the material has indirect character. The calculated pressure coefficient of the indirect band gaps 共L–⌫ and ⌺–⌫兲 are both positive (⬇25 meV/GPa). This result contrasts with the pressure insensitivity of the observed indirect transition and prevents an unambiguous assignment. On the opposite, the direct transition at higher photon energy can be reasonably assigned. Direct transitions at X and L points have very large energies and pressure coefficients 共see Fig. 4兲, then the most reasonable assignment seems to be the ⌫–⌫ direct transition. This assignment is supported by the comparison of the theoretical pressure coefficient for this direct transition 共45.4 meV/GPa兲 and the experimental one (40⫾3 meV/GPa). Table I compares the pressure coefficients and deformation potentials of the ⌫–⌫ direct transition in ZnO wurtzite and RS phases. The fact that both parameters are much larger in the RS phase is a consequence of role played by p – d interaction in each phase. P – d repulsion in the valence band has been proposed to be responsible for the so-called bandgap anomaly in wurtzite II-VI20 and in I-III-VI semiconductors.21 It has also been invoked as responsible for the low deformation potential of the band gap in wurtzite and TABLE I. Pressure coefficient and deformation potential of the ⌫–⌫ direct transition in ZnO crystalline phases.
a
ZnO phase
dE ⌫⌫ gd /d P 共meV/GPa兲
B0 共GPa兲
dE ⌫⌫ gd /d ln V 共eV兲
Wurtzite RS
24.5⫾2 a 40⫾3 a
142.6⫾2 b 202.5⫾2 b
⫺3.5⫾0.4 ⫺8.1⫾0.5
This work. Reference 19.
b
The authors thank R. Lauck for kindly providing the bulk single crystals. This work was supported through Spanish Government MCYT grants MAT2002-04539-C02-01共02兲 and BFM2001-3309-C02-01 共02兲. One of the authors 共M.J.H.C.兲 wish to thank the Spanish MCYT FPI fellowship program. 1
H. Ohta, K. Kawamura, M. Orita, N. Sarukura, M. Hirano, and H. Hosono, Electron. Lett. 36, 984 共2000兲. 2 C. H. Bates, W. B. White, and R. Roy, Science 137, 993 共1962兲. 3 F. J. Manjo´n, K. Syassen, and R. Lauck, High Press. Res. 22, 299 共2002兲. 4 H. Karzel, W. Potzel, M. Ko¨fferlein, W. Scchiessel, M. Steiner, U. Hiller, G. M. Kalvius, D. W. Mitchel, T. P. Das, P. Blaha, K. Schwarz, and M. P. Pasternak, Phys. Rev. B 53, 11425 共1996兲. 5 L. Gerward and J. Staun Olsen, J. Synchrotron Radiat. 2, 233 共1995兲. 6 ˜ a, R. Pandey, L. Gerward, and J. Staun J. M. Recio, M. A. Blanco, V. Luan Olsen, Phys. Rev. B 58, 8949 共1998兲. 7 F. Decremps, J. Pellicer-Porres, F. Datchi, J. P. Itie´, A. Polian, F. Baudelet, and J. Z. Jiang, Appl. Phys. Lett. 81, 4820 共2002兲, and references therein. 8 S. Choopun, R. D. Vispute, W. Yang, R. P. Sharma, T. Venkatesan, and H. Shen, Appl. Phys. Lett. 80, 1529 共2002兲. 9 W. Paul, High Pressure in Semiconductor Physics I, edited by T. Suski and W. Paul, Semiconductors and Semimetals Vol. 54 共Academic, San Diego, 1998兲, p. 1. 10 R. L. Knell and D. W. Langer, Phys. Lett. 21, 270 共1966兲. 11 D. R. Huffman, L. A. Schwalbe, and D. Schiferl, Solid State Commun. 44, 521 共1982兲. 12 A. Mang, K. Reimann, and St. Ru¨benache, Solid State Commun. 94, 251 共1995兲. 13 J. E. Jaffe, R. Pandey, and A. B. Kunz, Phys. Rev. B 43, 14030 共1991兲. 14 J. E. Jaffe, J. A. Snyder, Z. Lin, and A. C. Hess, Phys. Rev. B 62, 1660 共2000兲. 15 H. Q. Ni, Y. F. Lu, and Z. M. Ren, J. Appl. Phys. 91, 1339 共2002兲. 16 R. Helbig, J. Cryst. Growth 15, 25 共1972兲. 17 R. Le Toullec, J. P. Pinceaux, and P. Loubeyre, High Press. Res. 1, 77 共1988兲. 18 G. J. Piermarini, S. Block, J. D. Barnett, and R. A. Forman, J. Appl. Phys. 46, 2774 共1975兲. 19 S. Desgreniers, Phys. Rev. B 58, 14102 共1998兲. 20 S. H. Wei and A. Zunger, Phys. Rev. B 37, 8958 共1988兲. 21 J. E. Jaffe and A. Zunger, Phys. Rev. B 29, 1882 共1984兲. 22 S. H. Wei and A. Zunger, Phys. Rev. B 60, 5404 共1999兲. 23 S. Ves, U. Schwarz, N. E. Christensen, K. Syassen, and M. Cardona, Phys. Rev. B 42, 9113 共1990兲.
Downloaded 23 Jul 2003 to 158.42.129.75. Redistribution subject to AIP license or copyright, see http://ojps.aip.org/aplo/aplcr.jsp