Electronic structure and optical properties of thorium monopnictides. S KUMAR* and S AULUCKâ . Physics Department, Institute of Engineering and Technology, ...
Bull. Mater. Sci., Vol. 26, No. 1, January 2003, pp. 165–168. © Indian Academy of Sciences.
Electronic structure and optical properties of thorium monopnictides S KUMAR* and S AULUCK† Physics Department, Institute of Engineering and Technology, M.J.P. Rohilkhand University, Bareilly 243 006, India † Department of Physics, Indian Institute of Technology, Roorkee 247 667, India Abstract. We have calculated the electronic density of states (DOS) and dielectric function for the ThX (X = P, As and Sb) using the linear muffin tin orbital method within atomic sphere approximation (LMTO– ASA) including the combined correction terms. The calculated electronic DOS of ThSb has been compared with the available experimental data and we find a good agreement. The calculated optical conductivity for ThP and ThAs is increasing monotonically, while for ThSb a sharp peak has been found at 6⋅ 5 eV. Unfortunately there are no experimental data to compare with calculated optical properties, we hope our calculations will motivate some experimentalists. Keywords.
1.
Ab initio calculation; electronic structure; optical properties.
Introduction
The electronic structure of the actinide compounds have been of good interest to the researcher in the condensed matter theory because of the low α radioactivity of thorium as compared to other actinide elements and important technological applications. So far their basic electronic properties have been studied in a few articles. Therefore, investigation of thorium monopnictides in light of development of predicting the electronic and other properties using the ab initio calculation becomes important. The X-ray diffraction investigation had been carried out by Olsen et al (1989) of the B1 (NaCl structure) and B2 (CsCl structure) phases. Very recently, a band structure calculation has been carried out by using tight binding linear muffin tin orbital method within atomic sphere approximation (TBLMTO–ASA) for the different phases of B1 and B2 of all the three monopnictides by Trinadh (1997). Reihl et al (1982b) have studied f and d electrons in actinide compounds and concluded that the measured spectra are dominated by localized 5f states in all compounds. There have been reports in the literature regarding the high resolution (ÄE < 150 meV) photoemission with the synchrotron radiation of ThSb by Reihl et al (1982a). Davis et al (1994) had studied a band structure of ThAs at ambient pressure by using Kohn– Korringa–Rostokker (KKR) method. On the other hand, different investigators have conducted intense study of Th as a metal. Johansson et al (1995) studied anomalous behaviour of thorium crystal structure by using fullpotential linear muffin–tin orbital (FPLMTO) method. Skriver (1984) studied electronic properties of thorium at pressure up to 400 kbar by using LMTO–ASA. No report *Author for correspondence
about the optical properties of the above family of compounds is available. With this in mind we have performed calculation of the electronic density of states and dielectric function. Our calculations have been performed using LMTO–ASA, (Andersen 1975; Skriver 1984). The optical matrix elements are explicitly calculated as they are expected to play a significant role in the frequency dependence of the dielectric function. We also compare our calculated electronic density of state with available experimental data and theoretical investigations. 2. Method and details of calculation We have used LMTO–ASA method (Andersen 1975) including combined correction term which is the linearized version of the highly accurate KKR band structure method. A LMTO is defined as Hankel function of kinetic energy, κ2 times a spherical harmonic in the interstitial region, and linear combination of radial Schrödinger solutions inside the muffin tin (MT) sphere. In conventional LMTO method, the interstitial region and the higher partial waves can be dispensed with if one uses the simplifying atomic sphere approximation (ASA), which form a single-κ basis with κ2 = 0. In LMTO–ASA method, space is divided into overlapping atomic (Wigner–Seitz) sphere at various atomic sites, R, within which the potential and charge densities are spheridized. Matching at sphere boundary is continuous and once differentiable. The most attractive features of the LMTO formalism are the following: (i) metals, semiconductors and insulators involving any element of the periodic table are described on equal footing, (ii) LMTO basis set is minimal, with only 9 and 16 orbitals for spd and spdf elements, respectively and (iii) within ASA the secular 165
166
S Kumar and S Auluck
equation can be separated into the structure dependent and the potential dependent parts. A comparative study of the LMTO methods have been discussed by Das (2001). The calculation is performed for the measured lattice constant by Pearsons (1985) of a = 5⋅8329 Å, 5⋅9637 Å and 3⋅8380 Å for the ThP, ThAs and ThSb, respectively. The calculations are performed with equal sphere radii and a basis consisting of s, p, d and f LMTOs at each sites. The reliability of band structure methods based on the muffin tin approximation is best for closely packed structures. Since Th monopnictides are loosely packed crystals and hence they are not directly suitable for the conventional (LMTO–ASA) calculation. Therefore, two empty spheres have been introduced at appropriate chosen interstitial sites (Svane and Gunnarsson 1990; Kubler and Williams 1986). Scalar relativistic corrections are included but spin orbit coupling is neglected in the calculations. We have used the Barth-Hedin (1972) exchange correlation potential. Since f level in the Th is unoccupied therefore, the compound, ThX (X = P, As, Sb), is not magnetic. Although f orbital plays an important role as discussed by Gupta and Loucks (1971), the positions (0, 0, 0) for Th and (0⋅5, 0⋅5, 0⋅5) for X atom were used. In order to have close packing, two empty spheres (ES) were placed in the interstitial positions (0⋅25, 0⋅25, 0⋅25) and (0⋅75, 0⋅75, 0⋅75) along body diagonal of the unit cell. The one electron self-consistent potential rare obtained by performing iterations on a mesh of 252 k points in the irreducible Brillouin zone (IBZ). We have used a tetrahedron method proposed by Svane and Gunnarsson (1990) for the density of states (DOS) and optical properties.
bonding Th(6p)–P(3p, 3d, 3s) and Th(6p, sd, 5f )–P(3p, 3s) below the Fermi level and Th(6d, 5f )–P(3d, 3p) antibonding above the Fermi level. The calculated DOS is in agreement with the TBLMTO–ASA calculation by Trinadh (1997). Calculated total DOS for ThAs shows main structure are at –11⋅6, –9⋅6, –7⋅6 and –4⋅9 eV below the Fermi level and 2⋅9 and 4⋅4 eV above the Fermi level arises mainly from the bonding Th(6p, 5d))–As(4s, 3d) and Th(6p, 5d)–As(4p, 4s) below the Fermi level and Th(6d, 5f )–As(4s, 3d) antibonding above the Fermi level. In case of ThSb total density of states have main structures at –5⋅6, –4⋅9, –3⋅9 and –0⋅1 eV below the Fermi level and 1⋅6 and 2⋅7 eV above the Fermi level, which arises mainly from the bonding Th(6d, 7s)–Sb(4d, 6s, 5p) and Th(6d, 7s, 6p)–Sb(5s, 5p, 4d) below the Fermi level and Th(6d, 7s, 6p, 5f )–Sb(5s, 5p, 4d) antibonding above the Fermi level. The calculated DOS is compared with the
3. Density of states
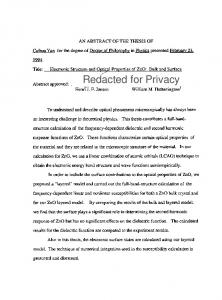
Figure 1. Calculated electronic density of states for ThP system. Full line, dashed line, dots and small circle for total, Th-p, Th-f and P-p parts, respectively.
The density of states are depicted in figures 1, 2 and 3 for the ThP, ThAs and ThSb, respectively. In all the figures Fermi level is shifted to 0 eV. We show here total DOS (sum of all basis which is considered in both atoms) and partial DOS of only those sub-orbital of each atoms that has considerable contribution towards total density of states. Calculated DOS are similar to the one obtained by Trinadh (1997), although he has not depicted the partial density of states for any system. The main structure in the DOS are dominated by –p, –d and –p sub orbital of the Th and –p, –d and –p sub orbital of P, Sb and As of the ThP, ThAs and ThSb systems, respectively. There is small contribution coming from f-sub orbital but it is quite important because this part is dominant near the Fermi level shown for the ThP in 1 which is in agreement with the earlier calculation performed by Gupta and Loucks (1971). Our calculations for the total DOS of ThP yield main structure at –11⋅7, –10⋅2, –8⋅2, and –5⋅3 eV below the Fermi level and 3⋅6 and 6⋅8 eV above the Fermi level. The above structure arises mainly from the
Figure 2. Calculated electronic density of states for ThAs system. Full line, dashed line and points for total, Th-p part and As-p part, respectively.
Electronic structure and optical properties of thorium monopnictides only available photoemission data by Reihl et al (1982a) which is in good agreement with our calculated total density of states. A broad peak has been seen at –3⋅8 eV in calculated and observed photoemission data. Shoulders at –0⋅1 eV are also observed in calculated and observed photoemission data. 4.
Optical properties
The calculation of the optical properties of the solids is beset with numerous problems. The dielectric function is the central importance quantity which has to be calculated. For cubic system there is only one component to be calculated i.e εxx. For hexagonal/tetragonal systems one has to calculate two components, ε|| and ε⊥ , corresponding to electric field parallel and perpendicular to the c-axis. Calculations of the dielectric function involve the energy eigenvalues and the electron wave functions. These are the natural output of the ab initio band structure calculation which are usually performed under local density approximation (LDA) (Koenig et al 1983; Alouani et al 1986). Empirical scaling of optical conduction was proposed by Janak et al (1975) but we are not aware of any similar detailed work. We have thus performed calculation of the dielectric function using the standard expression (Alouani et al 1986) ε(ω) =
8 3πω
2
∑∑ ∫ n
n′
BZ
| Pn n ′ (k ) | 2
dS k ∇ωnn ′ ( k )
167
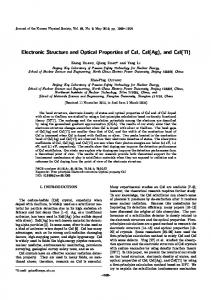
ωnn' (k ) = En' (k ) – En (k ) = ω, and the constant surface energy S k = { k ; ωnn' (k ) = ω}. In the LMTO–ASA, Pnn' (k ) , can be easily calculated (Koenig and Khan 1983; Alouani et al 1986). We have calculated the frequency dependent dielectric function, ε(ω) and optical conductivity, σ(ω), using LMTO–ASA method based on the theory discussed in the preceding section. Optical matrix elements are explicitly calculated within LMTO–ASA and then σ(ω) is calculated. Calculation for all the three systems ThP, ThAs and ThSb are done at 252 K points in the Brillouin zone (BZ) summation. The effects of using K points in the BZ has already been discussed in the earlier work by Khan et al (1993). The calculated results i.e. optical conductivity, σ(ω) and total imaginary dielectric function, ε(ω) are depicted in figures 4 and 5 of panels a, b and c for ThP, ThAs and ThSb systems, respectively. The calculated optical conductivity, σ(ω), increases monotonically for the ThP and ThAs, a broad structure at 6⋅5 eV has been observed in the case of ThSb. The calculated total imaginary dielec-
.
The above expression is written in atomic units with e2 = 1/m = 2 and = 1. Here ω is the photon energy (Ry) and Pnn′ (k ) the dipolar matrix element between initial |n (k )〉 and final |n′ (k )〉 states with their eigenvalues En ( k ) and En' (k ), respectively
Figure 3. Calculated electronic density of states for ThSb system. Circle, full line, dashed line and points for photoemission data, total density of states, Th-p part and Sb-d part, respectively.
Figure 4. Calculated frequency dependent optical conductivity, σ (ω), for ThP, ThAs and ThSb are shown in panels a, b and c, respectively.
168
S Kumar and S Auluck the electronic DOS. The calculated DOS for ThSb is in overall good agreement with the available photoemission data except that our calculated peaks shifted to lower energies by 0⋅5–1⋅0 eV. The calculated dielectric function and optical conductivity for ThSb shows a broad peak at ≈ 6⋅5 eV. In the absence of experimental data, it has not been compared. Acknowledgements One of the authors (SK) wishes to thank the Indian National Science Academy and the All India Council for Technical Education, New Delhi, for financial support. He is also thankful to Prof. Z H Zaidi and Prof. P N Ram for their constant interest and encouragement. Part of this calculation was done at Computer Centre, IIT, Roorkee. References
Figure 5. Calculated frequency dependent dielectric function, ε(ω), for ThP, ThAs and ThSb, are shown in panels a, b and c, respectively.
tric function, ε(ω), for ThSb that is depicted in figure 5 of panel c show a sharp structure at 6⋅8 eV. In order to identify the origin of structure in ε(ω) we have decided to take simple approach and i.e. that structure in ε(ω) usually arises from a set of parallel bands over a sufficient region in k space. Our band structure is very similar to the previously calculated band of Trinadh (1997). Thus looking at the band structure (Trinadh 1997) one could try to identify the origin of structure in ε(ω). The peak has been identified as arising from parallel set of bands along L Γ and around Γ. 5.
Conclusions
In this article we have presented the results of the electronic density of states and optical properties of thorium monopnictides using LMTO–ASA (Andersen 1975). The calculations demonstrate the importance of including correction terms which lead to a good improvement in
Alouani M, Koch J M and Khan M A 1986 J. Phys. F16 437 Andersen O K 1975 Phys. Rev. B12 3060 Das G P 2001 in Electronic structure of alloys, surfaces and clusters (eds) A Mookerjee and D D Sarma (London: Taylor and Francis) and references therein Davis H L 1994 Electronic structure and related properties (eds) A J Freeman and J Darby (New York: Academic Press) Vol. II, pp 1–49 Gupta R P and Loucks T L 1971 Phys. Rev. B3 1834 Janak J F, Williams A R and Moruzzi V L 1975 Phys. Rev. B11 1522 Johansson B, Ahuja R, Eriksson O and Wills J M 1995 Phys. Rev. Lett. 75 280 Khan M A, Kashyap A, Solanki A K, Nautiyal T and Auluck S 1993 Phys. Rev. B48 16947 Koenig C and Khan M A 1983 Phys. Rev. B17 6129 Kubler J and Williams A R 1986 J. Magn. Magn. Mater. 54–57 603 Lehmann G and Taut M 1972 Phys. Status Solidi B54 469 Olsen J S, Gerward L, Benedict V and Luo H 1989 J. Appl. Crystal. 22 63 Reihl B, Martension N, Eastman D E, Arko A J and Vogt O 1982a J. Appl. Phys. 53 2008 Reihl B, Martension N, Eastman D E and Vogt O 1982b Phys. Rev. B26 1842 Skriver H L 1980 Phys. Rev. B21 1489 Skriver H L 1984 The LMTO method (Berlin: Springer Verlag) Svane A and Gunnarsson O 1990 Phys. Rev. Lett. 65 1148 Trinadh 1997 Electronic structure and phase stability studies of some monopnictides and monochalcogenides under pressure, D Phil Thesis, Anna University, Madras Von Barth U and Hedin L 1972 J. Phys. C5 1629