Int. J. Electrochem. Sci., 9 (2014) 445 - 459 International Journal of
ELECTROCHEMICAL SCIENCE www.electrochemsci.org
Electronic Structure, Electronic Charge Density and Optical Properties of 3-methyl-1,4-dioxo-1, 4-dohydronaphthalen-2-ylsulfanyl (C13H10O4S) Sikander Azam1, Jiri Bila3, H. Kamarudin2, A. H. Reshak1,2,* 1
Institute of complex systems, FFPW, CENAKVA, University of South Bohemia in CB, Nove Hrady 37333, Czech Republic 2 Center of Excellence Geopolymer and Green Technology, School of Material Engineering, University Malaysia Perlis, 01007 Kangar, Perlis, Malaysia 3 Department of Instrumentation and Control Engineering, Faculty of Mechanical Engineering, CTU in Prague, Technicka 4, 166 07 Prague 6, Czech Republic * E-mail:
[email protected] Received: 24 August 2013 / Accepted: 28 October 2013 / Published: 15 November 2013
The atomic positions of 3-methyl-1,4-dioxo-1, 4-dohydronaphthalen-2-yl-sulfanyl (3MDS) single crystal taken from XRD data were optimized by minimizing the forces. We make use of the optimized geometry as a starting point of the comprehensive theoretical calculations by employing the allelectron full potential linearized augmented plane wave method to solve the Kohn Sham equations. The calculated electronic band structure and densities of states suggested that this single crystal possesses the energy band gap of about 1.575 eV using the local density approximation, 1.640 eV by generalized gradient approximation, 1.740 eV for the Engel-Vosko generalized gradient approximation and 2.223 eV using modified Becke-Johnson potential (mBJ). From our calculated electron charge density distribution, we obtain an image of the electron clouds that surround the molecules in the average unit cell of the crystal. The chemical bonding features were analyzed and the substantial covalent interactions were observed between O and C, C and S and as well as between C and H atoms. The optical response functions were calculated and discussed using the calculated energy band structures.
Keywords: Electronic structure, electronic charge density and optical properties: DFT
1. INTRODUCTION Among the acid-base crystalline output, the commonly active base building blocks are pyrazine, dipyridine, and their correspondents [1]. At the same time, aromatic carboxylic acids have
Int. J. Electrochem. Sci., Vol. 9, 2014
446
been in large amount preferred in supramolecular and solid sciences suitable to their vigorous ability to contribute in hydrogen bonds [2] and metal carboxylic coordination [3]. The chemistry of malleable carboxylic acids finds importance due to augmentations in number of conceivable proclivities [4–13] and assortments in coordination chemistry [14–26]. The organic motifs holding the supramolecular binding aptitudes have enamored superfluous consideration to apprehend their properties in restrained medium [27–33]. In this respect, quinones enclosing natural products are allied with anti-malarial, antibacterial, anti-tumor, and anti-fungal behavior [34]. Quinones endure electrons to produce radical anion or dianions which are beneficial in biological process [35–41]. Between the quinones, 1,4-naphthoquinone derivatives are deliberated in particulars [41]. Oxygen atom tethered dicarboxylic acids are general [24] in distinction to sulphur tethered carboxylic acid [6, 25]. In this paper we used the LDA, GGA, EVGGA and mBJ, as this is known that the discrepancy mainly arises from the LDA and GGA, which is known to underestimate the energy band gap, hence the optical properties [42]. Many theoretical tools have been adapted to modify the band gap of the material and compare to experimental one. For example, the optimized effective potential (OEP) method and many-body perturbation theory (MBPT) gives excellent band gap values compared to the experimental ones [42–44], but it is computationally expensive. One more possibility is the LDA+U [45] method which applied only for the correlated and localized 3d or 4f electrons in transition and rare-earth oxides. It is very successful but also very expensive method [42]. In order to over come the above problems we used the recently proposed modified Becke-Johnson (mBJ) exchange potential approximation [46]. This computationally technique is able to describe accurately the electronic structure of semi conductors and insulators. The predicted band gap value using this technique is significantly improved over the common LDA, GGA and also from EVGGA and are closer to the experimental findings [47,48]. In this work, the full-potential linearized augmented plane- wave (FPLAPW) method based on the first-principles density functional theory (DFT) with in the LDA, GGA, EVGGA and modified Becke-Johnson (mBJ) exchange potential approximation is used to calculate accurately the electronic structure, electronic charge density and optical properties of the 3methyl-1,4-dioxo-1, 4-dohydronaphthalen-2-yl-sulfanyl. The rest of the paper has been divided in three parts. In Section2, we briefly describe the computational method used in this study. The most relevant results obtained for the electronic, electronic charge density and optical properties of 3methyl-1,4-dioxo-1, 4-dohydronaphthalen-2-yl-sulfanyl are presented and discussed in Section3. Finally, we summarize the main conclusions in Section4.
2. CRYSTAL STRUCTURE AND COMPUTATIONAL DETAILS We make used of the crystallographic data (CCDC 743769) of 3-methyl-1,4-dioxo-1, 4dohydronaphthalen-2-yl-sulfanyl (3MDS), obtained from Cambridge Crystallographic database. The single crystal 3MDS crystallizes in triclinic having the space group number 2 (P-1) and the lattice parameters are a = 14.244378 bohr, b = 14.439964 bohr and c = 19.483265 bohr. The preferred product crystallized out as yellow needles and it was collected by filtration [49]. The crystal structure
Int. J. Electrochem. Sci., Vol. 9, 2014
447
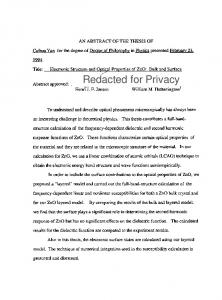
of 3-methyl-1,4-dioxo-1,4-dohydronaphthalen-2-yl-sulfanyl has been shown in Fig. 1. Fig. 1 (a) shows the unit cell (b) molecular crystal structure and (c) Hydrogen bond, which shows there exists two dimmer.
(a)
(b)
Int. J. Electrochem. Sci., Vol. 9, 2014
448
(c) Figure 1. Unit cell structure of 1,3-dicarbomethoxy4,6-benzenedicarboxylic acid.
A dimmer is a chemical unit which contains two structurally similar monomers joined by bonds that may be strong or weak, covalent or intermolecular. In solid state the carboxylic acid group of molecule is non planar with respect to quinine ring (Fig 1(b)) and the acid molecules is assembles through O1-H1….O2 collaboration to form a homo dimeric structures having hydrogen bond as shown in Fig. 1(c). A hydrogen bond is the electromagnetic attractive interaction between polar molecules in which hydrogen atom is bound to a highly electronegative atom, such as nitrogen, oxygen or fluorine. The hydrogen bond is much stronger than a van der Waals interaction, but weaker than covalent or ionic bonds. This type of bond can occur both in inorganic and organic molecules. We have performed first principle calculations based on the all-electron full-potential linearized augmented plane- wave (FPLAPW) method to solve the Kohn Sham DFT equations within the framework of the WIEN2K code [50]. This is an implementation of the DFT [51,52] with different possible approximation for the exchange correlation (XC) potentials. Exchange and correlation potential is described by the local density approximation (LDA) by Ceperley-Alder (CA) [53], and the gradient approximation (GGA) [54], which are based on exchange correlation energy optimization to calculate the total energy. In addition, the Engel-Vosko generalized gradient approximation (EV-GGA) [55] and modified Becke-Johnson potential (mBJ) were employed. The potential and charge density in the muffin-tin (MT) spheres are expanded in spherical harmonics with lmax = 8. In the interstitial region the potential and the charge density are represented by Fourier series. We have optimized the atomic positions taken from XRD data by minimization of the forces acting on the atoms. From the relaxed
Int. J. Electrochem. Sci., Vol. 9, 2014
449
geometry the electronic structure, electronic charge density and the optical properties can be determined. The optimized geometry along with the experimental once [49] were listed in Table 1.
Table 1. Optimized atomic positions along with the experimental atomic position [49] Atoms S1 O1 H1 O2 O3 O4 C1 C2 H2A H2B C3 C4 C5 C6 H6 C7 H7 C8 H8 C9 H9 C10 C11 C12 C13 H13A H13B H13C
X (ExP.) 0.53719(7) 1.04504(18) 1.0933 0.79532(18) 0.81065(16) 0.18922(19) 0.8698(3) 0.7728(3) 0.8307 0.7855 0.5200(2) 0.6704(2) 0.6431(2) 0.7822(3) 0.8934 0.7560(3) 0.8498 0.5916(3) 0.5739 0.4531(3) 0.3427 0.4776(2) 0.3306(2) 0.3586(2) 0.2022(2) 0.1569 0.1095 0.2399
X(opt.) 0.53741337 0.04810466 0.10791392 0.79420028 0.81441861 0.18548107 0.87157354 0.77453541 0.84284719 0.77838152 0.52107922 0.67291962 0.64448362 0.78564341 0.91520400 0.75979075 0.87059610 0.5923018 0.57139514 0.45220117 0.3206802 0.47743553 0.32823269 0.16007230 0.20245252 0.18882690 0.05190286 0.97568389
Y (Exp.) 0.14809(7) 0.26963(19) 0.3645 0.43067(18) 0.30801(19) 0.1565(2) 0.2912(3) 0.1236(3) 0.0624 0.0506 0.1888(2) 0.2679(2) 0.3026(2) 0.3700(2) 0.3891 0.4088(3) 0.4534 0.3819(3) 0.4105 0.3124(3) 0.2928 0.2717(2) 0.1948(2) 0.1590(2) 0.0900(3) 0.1790 0.0572 -0.0104
Y(opt.) 0.14679891 0.27100283 0.38954363 0.43192378 0.31148098 0.15338399 0.29266024 0.12303605 0.04713886 0.04303582 0.19034353 0.26935407 0.30212038 0.36881181 0.38753215 0.40867071 0.46179510 0.38180255 0.41545974 0.31157533 0.28969241 0.27054032 0.19349526 0.35682307 0.09003368 0.14885317 0.09306540 0.24528436
Z (Exp.) 0.14510(5) 0.03133(14) 0.0162 0.03037(12). 0.30214(12) 0.59946(14) 0.04698(17) 0.0818(2) 0.1467 0.0040 0.31373(16) 0.37065(17) 0.51344(17) 0.57053(19) 0.5196 0.7026(2) 0.7406 0.7788(2) 0.8675 0.72312(9) 0.7749 0.59080(17) 0.53142(18) 0.38883(18) 0.3329(2) 0.2802 0.4030 0.2794
Z (opt.) 0.14618809 0.03211422 0.00723630 0.02670397 0.30063573 0.60334205 0.04688205 0.08328411 0.15191358 0.99384314 0.31448916 0.37010103 0.51364997 0.57102919 0.50943225 0.70465930 0.74816499 0.7816489 0.88567083 0.72542243 0.78367473 0.5916819 0.5332411 0.3899066 0.33236948 0.26974282 0.40956924 0.26961299
3. RESULTS AND DISCUSSIONS 3.1. Electronic structural and electronic charge density For 3MDS single crystal we have performed comprehensive theoretical calculations. The optimized structure is used to calculate the electronic band structure, the atomic site-decomposed density of states, electron charge density and the optical properties. The deliberated electronic band structure suggests that the 3MDS is a direct band gap single crystal.
Int. J. Electrochem. Sci., Vol. 9, 2014
450
Figure 2. Calculated band structure. The valence band maxima (VBM) and the conduction band minima (CBM) are positioned at center of the Brillion zone.
Int. J. Electrochem. Sci., Vol. 9, 2014
451
(a)
(b)
(c)
Int. J. Electrochem. Sci., Vol. 9, 2014
452
(d) Figure 3. Calculated total and partial densities of states (States/eV unit cell)
The value of the direct gap is varying between 1.575 eV and 2.223 eV contingents on the type of the XC potential used. The LDA and GGA give a gap of 1.575 and 1.640 eV. Compounds with direct band gap are optically active and can be efficiently used in the photonic and optoelectronic devices [18–20].To oppress the well-known LDA and GGA underestimation the EVGGA was used. This forces the CBM toward higher energies subsequent a bigger gap (1.750 eV). To get a better value of the energy band gap we used mBJ, this XC potential gave a band gap of about 2.223 eV. The electronic band structures for these different XC potentials were illustrated in Fig. 2. The mBJ yields an improved band splitting compared to LDA, GGA and EVGGA [61-65]. Thus, for this motive we will discuss the results obtained by mBJ only. The total density and partial densities of states are plotted in Fig. 3. A strong hybridization can be seen with the help of the angular momentum decomposition of the atoms projected density of states. One can note that between -12.0 eV and -8.0 eV, the C-s state hybridizes with C-p state, also at the same region S-s state hybridized with S-p and O-s with O-p state. From -8.0 eV up to Fermi level (EF), C-s hybridizes with C-p also O-s with O-p. At the conduction bands S-s hybridizes with S-p state. Following the angular momentum decomposition of the atoms projected density of states we have identify the angular momentum characters of various structures; The S/H-s and O-p orbital are situated in the energy range of −12.0 and −8.0 eV. H-s, C/O-s/p and S-p orbital are extended from −8.0 eV up to -4.0 eV, while the S/O-p, C-s/p and H-s orbital are from −4.0 eV up to EF. Finally the C-p, S-s/p and H-s orbital are located in the conduction band. We found that the S-p character is more concentrated in the CBM and VBM and it has an important influence on the energy band gap. Now let us turn our concern to analyze and express the electronic charge density, to obtain a deeper insight into the electronic structure, we displayed the electronic charge density contour in the (101) crystallographic plane as shown in Fig. 4. The contour plot shows partial ionic and strong
Int. J. Electrochem. Sci., Vol. 9, 2014
453
covalent bonding between C-O, C-C and C-S atoms depending on Pauling electro-negativity difference of C (2.550), H (2.200) S (2.580), and O (3.44) atoms. From these contour plots one can see that the majority of C, H, and S electronic charge is transferred to O atom. This can be seen easily by the color charge density scale where blue color (+1.0000) corresponds to the maximum charge accumulating site. The charge density along C-O, C-C and C-S bonds is pronounced. This is due to the strong hybridization of covalent C-O, C-C and C-S bonds. We should emphasize that the charge density distribution is essentially spherical around all the atoms. The O atom is more electronegative than C, H and S atoms, as one can clearly see that the charge accumulates more near O along the bonds and the charge around O uniformly distributed.
Figure 4. Electronic charge density contour.
Int. J. Electrochem. Sci., Vol. 9, 2014
454
We also plotted the electron charge density distribution in the (110) crystallographic plane so that to understand the anisotropy between the two planes in the crystal. Following these two contour plots in the (101) and (110) planes one can see that this crystal possesses a strong anisotropy which favors to enhance the optical susceptibilities. As is clear from the Fig. 4 that the charge density of the hydrogen is greater in (110) plane than (110) plane. And also in plane (110) O atom making the covalent bonding with the carbon atom, whereas in the (110) plane the O atom makes an ionic bonding.
3.2 Optical Properties Now, we emphasis our attention on the optical properties of 3-methyl-1,4-dioxo-1, 4dohydronaphthalen-2-yl-sulfanyl single crystal. The complex dielectric function is directly related to the energy band structure of solids. The optical spectroscopy analysis of is a powerful tool to determine of the overall band behavior of a solid [42-44]. Therefore precise FPLAPW calculations are desirable to figure out the optical spectra. The optical properties of matter can be expressed by the dielectric function q, where q is the momentum and ω is the frequency. In this consideration we have used the dipole approximation for the calculations, i.e., q = 0, the momentum shift from the initial state to the final state is ignored. Usually, there are two contributions to namely intraband and interband transition: the contribution of intraband transitions is actually vital only for metals and also the interband transitions can be direct and indirect transitions. The indirect interband transitions contain scattering of phonons, but the indirect transitions gives only small contribution to compared to direct transitions, considerably we have ignored them in our calculations. The direct interband contribution to the absorptive or imaginary part on the dielectric function in a random phase approximation without local effects is established through summing all the probably transitions from the occupied with and unoccupied states with regard to a list of k-vectors over the first Brillion zone.
Figure 5. Calculated average value of imaginary of dielectric function 2av .
Int. J. Electrochem. Sci., Vol. 9, 2014
455
Our deliberated result of average imaginary parts is exhibited in Fig.5 using LDA, GGA, EVGGA and mBJ. We should highlight that mBJ gives rise to a better band splitting, ensuing better optical transition between the occupied and unoccupied states. Thus, for this intention we confer the result of mBJ. Following Fig. 5, it is clear that all the structure is shifted towards higher energies by around 0.5 eV with higher magnitude in particular for the spectral structure at lower energies. We adverts the optical spectra for the energy range 0.0–14.0 eV. Subsequent the spectra of 2 , the highest spectral peak for the three schemes LDA, GGA, EVGGA and mBJ are situated at energies 7.09, 7.03, 7.02 and 6.08 eV respectively.
(a)
(b)
Figure 6. Calculated imaginary 2 and real part 1 of dielectric tensor Also the real and imaginary parts of the dielectric function as a function of photon energy along three crystallographic xx , yy and zz , directions have been calculated within LDA, GGA, EVGGA and mBJ (see figure 6). The threshold points of 2xx and 2yy components are located at 1.144 eV and for 2zz component is located at 2.0 eV. This corresponds to the transitions at the high symmetry point (Γv - Γc) between the highest valence and the lowest conduction bands (i.e., S/O-p to C-p), and it is known as the fundamental absorption edge. The imaginary part exhibits a sharp increase at 3.07 eV for 2xx , at 12.65 eV for 2yy and at 4.44 eV for 2zz crystallographic directions. The real part 1 of the dielectric function is evaluated from the calculated imaginary part 2 by using Kramer’s-Kronig relations [56] (see figure 6). The static value of the real part of dielectric function, 1 0 along three crystallographic directions are found to be 3.0 for 1xx 0 , 1.677 for 1xx 0 , and 2.907 for 1zz 0 . Further, using 1 and 2 , we evaluated the related optical properties, namely the refractive index n(ω), the reflectivity R(ω), and the energy-loss spectrum L(ω) (see Figure 7). The peaks in each of these spectra correspond to the peaks observed in the imaginary part 2 of dielectric function.
Int. J. Electrochem. Sci., Vol. 9, 2014
(a)
(c)
456
(b)
(d)
Figure 7. Calculated energy-loss spectrum L(ω), reflectivity R(ω) and the refractive index n(ω)
The refractive index (Fig.7b) of a crystal is closely related to the electronic polarizability of ions and the local field inside the crystal. The values of n0 along three crystal directions are found to be 1.29 for n xx 0 , 1.74 for n yy 0 , and 1.70 for n zz 0 . The average value of n0 is equal to 1.5751. Following Fig. 7b, a maximum can be observed in the spectrum between 2.0 and 4.5 eV. At intermediate energies many small peaks appear and then the curves vanish at higher energies. The reason for these vanishing curves at higher energy is due to the fact that beyond certain energy the material can no longer act as transparent material and it absorbs high energy photons. It is also clear from Fig. 7b that the refractive index falls below unity at number of frequencies. Refractive index lesser than unity shows that the phase velocity of light is greater than the light celerity c, which might seems to be imply a contradiction to relativity. However, this over looks the fact that a signal must be transmitted as a wave packet rather than mono chromatic wave. In a dispersive medium, a wave packet will propagate at the group velocity v g given by vg d rather dk than at phase velocity v C the relation between v g and v is given by k n
Int. J. Electrochem. Sci., Vol. 9, 2014
457
kdn vg v1 ndk So this equation shows that vg is always less than v. If we were to try to transmit a signal in a spectral region, where v is greater than c, we would always find that vg is less than c [57]. A relationship between calculated extinction coefficient K and energy is shown in Fig. 7d. The response of K for the studied material is closely matched to the response of 2 . A small
variation of K from 2 is due to the fact that this generalization is not valid for the medium with some absorption coefficient [57]. The reflectivity spectrum R(ω) of 3-methyl-1,4-dioxo-1, 4-dohydronaphthalen-2-yl-sulfanyl, along three crystal directions is calculated as shown in Fig. 7a. The values of R0 are 0.071 for R xx 0 , 0.0155 for R yy 0 , and 0.067 for R zz . There is isotropy between R xx and R zz up to 3.0 eV and weak anisotropy between these two along the spectral region. Both of the R xx and R zz have considerable anisotropy with R yy up to 12.0 eV. The most prominent peaks are observed at 3.0, 5.5, and 8.0 eV along the three crystal directions R xx , R yy and R zz respectively. Peaks in the figure show that there is a maximum value of reflectivity. The maximum lies in the energy range 2.2–14 eV and arises from the inter band transition. These materials possess reflectivity in a wide energy (frequency) range; the variation of reflectivity with energy is suitable for Bragg’s reflector. The energy-loss function is calculated and shown in Figure 7c. It is an important optical parameter, indicating the energy loss of a fast electron traversing in the material. The peaks represent the characteristic behaviors associated with the plasma oscillations and the corresponding frequencies are the so-called plasma frequencies. The peaks of L(ω) correspond to the trailing edges in the reflection spectra and are observed at around 6.0 eV for Lxx , 8.0 eV for Lyy , and 6.0 eV for Lzz .
4. CONCLUSION In conclusion, using FPLAPW method, we presented the band structure and the optical properties of 3MDS. We obtained the direct band gap 1.575, 1.640, 1.740 and 2.223 eV for LDA, GGA, EVGGA and mBJ. Corresponding densities of states are presented and the major structures in them are identified. We studied the electronic charge density in the ( 1 1 0) and in (1 1 0) crystallographic planes in order to explain the bonding properties. Using the projected DOS and band structure we have analyzed the interband contribution to the optical properties of 3-methyl-1,4-dioxo1, 4-dohydronaphthalen-2-yl-sulfanyl. The real and imaginary parts of dielectric function and hence the optical constants such as energy loss, reflectivity, refractive index and extinction coefficient are calculated.
AKNOWLEDEGMENT This work was supported from the project CENAKVA (No. CZ.1.05/2.1.00/01.0024), the grant No. 134/2013/Z/104020 of the Grant Agency of the University of South Bohemia. School of Material
Int. J. Electrochem. Sci., Vol. 9, 2014
458
Engineering, Malaysia University of Perlis, P.O Box 77, d/a Pejabat Pos Besar, 01007 Kangar, Perlis, Malaysia
References 1. (a) V. R Pedireddi, S. Chatterjee, A. Ranganathan, C. N. R Rao, J. Am. Chem. Soc., 119 (1997) 10867. (b) A. j. Lough, P. S Wheatley, G. Ferguson, C. Glidewell, Acta Crystallogr., B56 (2000) 261. (c) M. Tomura, Y. Yamashita, Chem. Lett., (2001) 532. (d) N. Shan, A. D. Bond, W. Jones, Cryst. Eng., 5 (2000) 9. (e) N. Shan, E. Batchelor, W. Jones, Tetrahedron Lett., 43 (2002) 8721. (f) C. Ruiz-Perez, P. A. Lorenzo-Luis, M. Hernandez-Molina, M. M Laz, P. Gili, M. Julve, Cryst. Growth Des., 4 (2004) 57. 2. (a) V. Videnova-Adrabinska, J. Mol. Struct., 374 (1996) 199. (b) C. V. K Sharma, M. Zaworotko, J. Chem. Commun., (1996) 2655. (c) K. Biradha, D. Dennis, V. A MacKinnan, C. V. K. Sharma, M. J. Zaworotko, J. Am. Chem. Soc., 120(1998) 11894. (d) B. Q. Ma, P. Coppens, Chem. Commun., (2003) 2290. (e) J. R. Bowers, G. W. Hopkins, G.P.A Yap, K. Wheeler, A. Cryst. Growth Des., 5 (2005) 727. 3. (a) D. Cheng, M. A. Khan, R. P Houser, Inorg. Chem., 40 (2001) 6858. (b) M. P. Suh, J. W. Ko, H. J. Chiol, J. Am. Chem. Soc., 124 (2002) 10976. (c) O. M. Yaghi, M. O’Keeffe, N. W. Ockwig, H. K. Chae, M. Eddaoudi, Kim, J. Nature, 423 (2003) 705. 4. M. Du, Z. H. Zhang, X. J. Zhao, H. Cai, Cryst Growth Des. 6 (2006)114 5. A. M. Beatty, C. M. Schneider, A. E. Simpson, J. L. Zaher, Cryst Eng Comm. 4 (2002) 282 6. M. Du, Z-H Zhang, X-J Zhao, Cryst Growth Des. 6 (2006) 335 7. V. R. Pedireddi, S. Chaterjee, A. Ranganthan, C. N. R. Rao. Tetrahedron., 54 (1998) 9457 8. J. Xiao, M. Yang, J. W. Lauher, F. W. Fowler. Angew Chem Int Ed., (2000) 2132 9. C. B. Aakero¨y, A. M. Beatty, B. A. Helfrich, M. Niuwenhuyzen Cryst Growth Des.,3 (2003) 159 10. P. Vishweshwar, A. Nangia, V. M. Lynch Cryst Growth Des. 2003 3 (2003) 783 11. D. Braga, L. Maini, G. Sanctis, K. Rubini, F. Grepioni, MR. Chierotti, R Gobetto. Chem Eur J., 9 (2003) 5538 12. D. Singh, P. Bhattacharyya, J.B. Baruah. Crystal Growth Des, 10 (2010) 348 13. N. Barooah, R.J. Sarma, J.B. Baruah. Cryst Eng Comm., 8 (2008) 608 14. A. Erxleben. Coord Chem Rev., 246 (2003) 203 15. A.J. Fletchera, K.M. Thomasa, M.J. Rosseinsky. J Solid State Chem., 178 (2005) 2491 16. K. Uemura, R. Matsuda, S. Kitagawa. J Solid State Chem.,178 (2005) 2420 17. F.S. Delgado, J. Sanchiz, C. Ruiz-Perez, F. Lloret, M. Julve. Crys Eng Comm.6 (2004) 73 18. F. S. Delgado, M. Hernandez-Molina, J. Sanchiz, C. Ruiz-Perez, Y. Rodriguez-Martin,T. Lopez, F. Lloret, M. Julve. Cryst Eng Comm., 6 (2004) 929 19. I. GildeMuro, L. Lezama, M. Insausti, T. Rojo. Polyhedron., 23 (2004) 859 20. F. S. Delgado, C. Ruiz-Perez, J. Sanchiz, F. Lloret, M. Julve. Cryst Eng Comm.,8 (2006)530 21. J Pasan, J Sanchiz, C Ruiz-Perez, F Lloret, M Julve. Inorg Chem., 44 (2005) 7794 22. P Lightfoot, A Snedden. JCS Dalton Trans. (1999) 3549 23. Y Rodriquez-Martin, J Sanchiz, C Ruiz-Perez, F Lloret, M Julve. Cryst Eng Comm., 4 (2002) 631 24. P. Mondal, A. Karmakar, W. M. Singh, J. B. Baruah. Cryst Eng Comm., 10 (2008) 1550 25. A. Karmakar, J. B. Baruah, R. B. Shankar. Cryst Eng Comm., 11 (2009) 832 26. O. M. Yaghi, M. O’keefe, N. W. Ockwig, H. K. Chae, M. Eddaoudi, J. Kim. Nature. 423(2003) 705 27. A. Heller, B. Feldman. Chem Rev.,108 (2008) 2482 28. K. M. Aubart, C. H. Heathcock. J Org Chem., 64 (1999)16 29. Y. Huang, J. Zhang, T. R. R. Pettus. Org Lett., 7 (2005) 26 30. J. K. Liu. Chem Rev., 106 (2006) 2209
Int. J. Electrochem. Sci., Vol. 9, 2014
459
31. V. K. Tandon, H. K. Maurya, D. B. Yadav, A. Tripathi, M. Kumar, P. K. Shukla. Bioorg Med Chem Lett., 16 (2006) 5883 32. J. Benites, L. Rojo, J. A. Valderrama, H. Taper, P. B. Calderon. Eur J Med Chem., 43 (2008) 1813 33. K. O. Eyong, P. S. Kumar, V. Kuete, G. N. Folefoc, E. A. Nkengfack, S. Baskaran. Bioorg Med Chem Lett., 18 (2008) 5387 34. P. J. O’Brien. Chem Biol Interact., 80 (1991)1 35. J. H. R Tucker, S. R. Collinson. Chem Soc Rev., 31(2003)147 36. J. M. Lehn. Supramolecular chemistry, concepts and perspectives. VCH, Weinheim.(1995). 37. E Katz, R Baron, I Willner. J Am Chem Soc., 127 (2005) 4060 38. C. F. Hogan, J. A. Hutchison, K. P. Ghiggino, S. J. Langford, J. M. Latter, V. L. Lau, V Murali. Supramol Chem., 17 (2005) 513 39. Y. J. Lee, S. M. Park. J Phys Chem B., 102 (1998) 9940 40. G. Cooke, V. Sindelar, V. M. Rotello. Chem Commun. (2003) 752 41. W.M. Singh, J.B. Baruah. J Mol Struct., 931 (2009) 82 42. D. Koller, F. Tran, P. Blaha. Phys. Rev. B. 83 (2011) 195134. 43. E. Engel. Phys. Rev. B., 80 (2009) 161205. 44. S. Jiang, T. Lu, Y. Long, J. Chen. J. Appl. Phys., 111 (2012) 043516. 45. V.I. Anisimov, J. Zaanen, O.K. Andersen. Phys. Rev. B., 44 (1991) 943–954. 46. F. Tran, P. Blaha. Rev. Lett., 102 (2009) 226401. 47. A.D. Becke, E.R. Johnson. J. Chem. Phys., 124 (2006) 221101–221105. 48. F. Tran, P. Blaha, K. Schwarz. J. Phys. Condens. Matter., 19 (2007) 196208. 49. W. Marjit Singh • Jubaraj B. Baruah J Chem Crystallogr. 41(2011) 952–958 50. P.Blaha, K. Schwarz, J. Luitz WIEN97, A full potential linearized augmented plane wave package for calculating crystal properties, Karlheinz Schwarz. Techn. Universit at Wien, Austria, (1991) ISBN:3-9501031-0-4. 51. P. Hohenberg, W. Kohn. Phys. Rev., 136 (1996) B864. 52. W. Kohn, L. J. Shom. Phys. Rev., 140 (1965) A1133. 53. J. P. Perdew, A. Zunger. Phys. Rev. B. 1981. 23 (1981) 5048. 54. J. P. Perdew, K. Burke, M. Ernzerhof. Phys. Rev. Lett. 77 (1996) 3865. 55. E. Engel, S. H. Vosko. Phys. Rev. B., 50 (1994) 10498. 56. W.T Ching, P. Rulis. Phy. Rev. B., 73 (2006) 045202. 57. M. Fox. Optical Properties of Solids, Oxford University Press, (2001) 58. B. Amin, R. Khenata, A. Bouhemadou, I. Ahmad, M. Maqbool. Physica B. 407, (2012) 2588–2592 59. B. Amin, I. Ahmad, M. Maqbool, S. Goumri-Said, R. Ahmad. J. Appl Phys. 109 (2011) 023109 60. M. Maqbool, B. Amin, I. Ahmad. J. Opt. Soc. Am. B. 26(11) (2009) 2181-2184 61. A. H. Reshak, H. Kamarudin, I. V. Kityk, S.Auluck. journal of material science, 48 (2013) 51575162 62. Sikander Azam, A. H. Reshak. Int. J. Electrochem. Sci., 8 (2013) 10359 – 10375. 63. A.H. Reshak, S.A. Khan. Computational Materials Science 78 (2013) 91–97. 64. Saleem Ayaz Khan, A. H. Reshak. Int. J. Electrochem. Sci., 8 (2013) 9459 – 9473. 65. Ali H. Reshak, S. Auluck, I.V. Kityk. Current Opinion in Solid State and Materials Science 12 (2008) 14–18. © 2014 by ESG (www.electrochemsci.org)