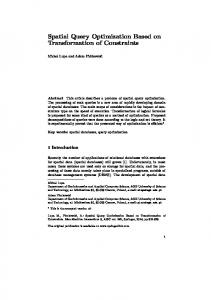
17 th Interntional Symposium on ElectroMagnetic Compatibility (CEM 2014)
EMC FILTER OPTIMIZATION BASED ON INTER-COMPONENT COUPLING P. Fernandez-Lopez, F. Ajebbar, F. Lafon, A. Ramanujan VALEO VEEM - GEEDS, 2 rue André Boulle, 94046 Créteil,
[email protected]
Abstract. In power electronics, the performance of filters is a very tricky subject. Very often, the respect of the EMC requirements depends on its correct design. The response of an EMC filter can be improved if the intercomponent coupling is taken into account. An analytical method is suggested here to obtain the relative position between the filter’s inductor and capacitor which produces the optimal attenuation. This method is valid for a single-LC filter. It is quite simple and it can be implemented using a commercial tool like PSpice. Its steps are presented; then, it is applied on an EMC filter integrated into a wiper motor to verify that conducted emissions are reduced. I.
II. STATE OF THE ART ON EMC FILTER OPTIMISATION Previous work in Valeo [6] dealt with the study of a LC filter in Γ configuration. It was found that the filter response can strongly vary depending on the coupling between the inductor and the capacitor. To understand this phenomenon, the high frequency impedance model of the LC filter is considered (Figure 1).
INTRODUCTION
Nowadays, power electronic systems development is taking an important place in automotive domain because of electric vehicle progress. Typical applications are DCDC and DC-AC converters and switched-mode power supplies. They can introduce disturbance sources so Electromagnetic Compatibility (EMC) problems come out. In order to increase the victim immunity, EMC filters are usually integrated in systems. They consist of some inductors and capacitors. Due to parasitic elements, the real response of a filter in high frequency is not the same as that of the theoretical one. The filter design is a key step as it can help to guarantee the respect of EMC specifications of an equipment. In [1], a method to dimension the EMC filter elements is presented. Another method to optimize a filter layout so as to improve its response is explained in [2]. In addition, filter’s elements positioning in board is usually subjected to mechanical constraints. This brings that for a given filter (i.e. inductors and capacitors values), its performance can be modified (improvement or degradation) depending on the relative placement of elements. The reason is the inter-component coupling which is, in general, not taken into account during filter design phase. This topic is broached in [3]-[5]. In this paper, we introduce an analytical method very simple and easy to be implemented based on that aspect.
Figure 1: High frequency model of a LC filter The coupling between the inductor and the capacitor is actually the mutual inductance M existing between the inductance of the inductor model and the parasitic inductance (ESL) of the capacitor model. Depending on the M value, the response of a given filter can be totally different. Figure 2 shows the filter response without considering the inter-component coupling (M=0) and for other M values. We can see that the best response is the one in pink as it has the best attenuation in a greater frequency band. This curve is obtained for an M value equal to ESL.
Figure 2: Different filter responses depending on M value ([6])
The coupling between the inductor and the capacitor is closely related to their relative position. So, the key point is to be able to get the optimal distance between filter components in order to get a mutual inductance value equal to ESL. 3D modelling was performed in [6] in order to get the right distance to improve a filter response. Unfortunately, 3D models of capacitors are not enough reliable because it is quite difficult to reproduce its internal architecture and its physical behaviour. In addition, this technique is complex and it requires good knowledge of 3D simulation tools so it is not really suitable for industrial purposes. A simpler method to optimize an EMC filter is presented in next section. It is based on analytical equations and it can be implemented using PSpice. Figure 3: Capacitor's characterization board III. OPTIMIZATION METHOD This new method entails simplicity and a reduction of time with respect to 3D simulations. The first step is to model the inductor and the capacitor at high frequency. Then, an analytical equation implemented under PSpice is used to estimate the optimal distance between filter components. The steps of this method are presented in this section. III.1. Passive components modelling
As mentioned before, S21 measurements are then treated to extract the values of the equivalent serial RLC circuit that models a capacitor ([8]). b - Inductor model extraction In the case of an inductor, we are interested in S21 parameter in serial configuration (less uncertainty in measurements for inductors). A generic board (Figure 4) was developed to facilitate measurement.
In order to extract the impedance models of the inductor and the capacitor, we use S-parameters. These data are measured using a Vector Network Analyser (VNA). Then, they are treated under IMEx (Impedance Model Extractor), a Valeo internal tool, to convert them in equivalent circuits based on R, L, C elements. These models reproduce the impedance behaviour of the inductor and the capacitor at high frequency taking into account the parasitic elements which appear from some megahertz. Hereafter, we explain how to extract impedance models for capacitors and inductors. a - Capacitor model extraction The impedance model of a capacitor is obtained from S21 parameter measurements in parallel configuration. As discussed in [7], this is the configuration with less uncertainty for capacitors. To make measurements easily, a generic board was designed and manufactured (Figure 3). It is adapted to all capacitor sizes and geometries thanks to the large ground area. Tracks are dimensioned to have a characteristic impedance of 50Ω. The board is associated to a calibration kit which is also available.
Figure 4: Inductor's characterization board This board is adapted to different inductor lengths (from 1cm to 10cm) as it contains several connection points. Depending on the inductor length, user must look for the best adapted combination of ports. Tracks are dimensioned to have a characteristic impedance of 50Ω. The calibration kit is the same as that for capacitors. S21 measurements are finally used to extract the values of the equivalent circuit that models an inductor ([7]). III.2. Optimization process The analytical method that is presented in this paper is based on the magnetic flux that is created on the capacitor parasitic inductance (ESL) by the inductor (Figure 5).
• •
Figure 5: Interaction between the inductor and the capacitor The magnetic flux ΦESL created by the magnetic field BL from the inductor through the effective coupling surface SESL of the capacitor (placed at a distance d) can be calculated as:
Φ ESL =
∫∫
S ESL
r r BL ⋅ dS ESL = BL (d ) ⋅ S ESL (d )
(1)
Here, it is assumed that BL is uniform on the surface SESL and SESL is normal to the inductor axis. From equation (1), it is possible to derive another expression of magnetic flux by introducing the vector potential AL:
r r r r BL ⋅ dS ESL = AL ⋅ dl ESL S ESL C ESL r r µ dl L ⋅ dl ESL = iL 0 = iL ⋅ M C C d 4π ESL L
Φ ESL =
∫∫
∫
∫ ∫
a - Estimation of magnetic field BL radiated by an inductor at a distance d In order to calculate the magnetic field BL radiated by an inductor at a distance d, equation (4) is used. It must be noted that it is valid for a point on the center axis of the inductor at d. It implies that, in our application, the capacitor will be placed face to the inductor at its center axis.
1 R2 1+ (d + l )2
−
1 R2 1+ 2 d
N µ0 µr l 2
where: • iL is the current through the inductor,
µr =
Z L (with ferrite ) Z L (without ferrite )
(5)
Figure 6 shows a comparison of magnetic field radiated by the inductor at 1cm obtained by measurement and by using equation (4). Good concordance is obtained up to 100MHz. Differences at higher frequencies are due to vagueness of high frequency impedance model of the inductor.
(2)
where iL is the current through the inductor and M is the mutual inductance between the inductor and the capacitor parasitic inductance (ESL). From (1) and (2), we can establish: BL (d ) ⋅ S ESL (d ) = M ⋅ iL (3) where: • mutual inductance M = ESL to have an optimal filter response, • current iL is determined by simulation and • magnetic field BL(d) and effective coupling surface SESL(d) must be estimated. From equation (3), it will be possible to obtain the optimal distance d between the inductor and the capacitor in order to have the best filter response.
BL (d ) = iL
R is the radius of the inductor, d is the distance between the inductor (the near end) and the point where magnetic field is calculated, • l is the length of the inductor, • N is the number of turns, • µ0 is the vacuum permeability and • µr is the relative permeability of the inductor ferrite core. The main difficulty of this expression is to get the µr value as it is not published on datasheets. To do so, we suggest to extract the impedance model of the inductor with and without ferrite and to use equation (5).
(4)
Figure 6: Validation of magnetic field estimation
b - Estimation of the effective coupling surface SESL of the capacitor From equation (3), the effective coupling surface SESL can be expressed as:
S ESL (d ) =
M ⋅ iL BL (d )
(6)
Using a magnetic probe, the magnetic field BL radiated by an inductor alone was measured at different distances d and SESL was computed from (6). Then, a table SESL versus d was obtained. From this experience, it was found that the effective coupling surface SESL linearly depends on distance d. Equation (6) was then established:
S ESL (d ) = where:
SC d + π ⋅ RC2 4R
(7)
• • •
SC=a·b is the area limited by capacitor’s pins (Figure 7 (a)), R is the radius of the inductor, RC depends on inductor and capacitor relative geometry (Figure 7 (b)). If inductor diameter 2R is smaller than the distance a between capacitor pins, then RC = R. If inductor diameter 2R is greater than a, then RC = a/2.
Figure 9: PSpice simulation to estimate distance d Figure 7: Parameters to estimate surface S Equation (7) has been validated on different inductors and capacitors geometries by comparison with measurements. Figure 8 shows an example.
The calculation of both products is shown in Figure 10. Several curves are obtained for the parametric simulation, one for each value of distance d. The filter designer must choose the BL·SESL curve that fits better with the M·iL curve in order to obtain the optimal distance d. If necessary, a refinement on d values for parametric simulation may be done in order to get a more precise value.
Figure 10: BL(d)·SESL(d) and M·iL curves
Figure 8: Validation of the estimation of the effective coupling surface
c - Estimation of the optimal distance d between the inductor and the capacitor Equations (4) and (7) are implemented under PSpice as it is shown in Figure 9. It must be noted that the calculation of BL(d)·SESL(d) is done using a parametric sweep on d value.
IV. APPLICATION OF THE METHOD The method to optimize an EMC filter is now applied to an industrial demonstrator: a wiper motor. The optimal distance between the inductor and the capacitor is obtained. Then, the optimized filter is built and installed on wiper motor. Finally, the conducted emissions are measured for both the original and the optimized filter and they are compared. IV.1. Presentation of the demonstrator A car wiper motor (Figure 11, top side) is used to validate the method. This wiper motor contains two arms, one for low speed mode and another for high speed mode. Each arm has a LC filter (Figure 11, low side); both are exactly the same: L=5µH and C=1µF.
Figure 13: Optimized filter
Figure 11: Wiper motor and its embedded EMC filter The frequency response of both these two filters is shown in Figure 12. We can observe a difference in attenuation level from 1MHz as the relative positions of inductors and capacitors are not the same for both filters. This confirms the fact that it is important to consider the intercomponent coupling to improve their behavior.
The frequency response of the optimized filter was measured and it is compared to the original filter response in Figure 14. We can notice that a huge improvement is achieved particularly at 10MHz where extra 50dB attenuation is attained.
Figure 14: Comparison of original and optimized filters responses IV.3. Conducted emission measurement
Figure 12: Filters responses
The optimized filter was integrated into the wiper motor (in high speed mode) as shown in Figure 15.
IV.2. Optimization of the filter The method to optimize a filter was applied to the demonstrator as follows: 1. Model extraction for 5µH inductor and 1µF capacitor using characterization boards. 2. BL(d)·SESL(d) estimation under PSpice using a parametric simulation. 3. M·iL estimation under PSpice. 4. Extraction of the distance d by comparison of curves BESL(d)·SESL(d) and M·iL. After this process, the optimal distance was found to be 7.5mm. The optimized filter was then built from the original one. The inductor is placed at 7.5mm in front of the capacitor as shown in Figure 13.
Figure 15: Optimized filter integrated into the wiper motor One of the EMC tests in automotive domain concerns conducted emission measurement of an equipment. This test is based on CISPR25 standard [9]. It consists in measuring the voltage on the LISN connected to Power Supply wire.
Figure 16 shows the conducted emission measurements of original and optimized filters.
from the inductor which is quite hard and it makes the inductor be deformed. This deformation implies less precision on impedance model of inductor without ferrite core. REFERENCES
Figure 16: Conducted emission from original and optimized filters We can see that the emission level is lower for optimized filter in the whole band. The improvement up to 2MHz was not expected from attenuation curves (Figure 14). This could be explained by a capacitance effect in lower band. The reason of this deviation can be due to the difference between S-parameter’s and conducted emission set-up. For the first one, only the filter is measured, for the second one, the filter is loaded with the motor. In addition, both filter topologies (original and optimized) are distinct and also the non-tested-arm filter is mounted next to the tested-arm filter (Figure 11 and Figure 13). A deeper modeling of emission conducted test should be carried on to investigate on this subject. V.
CONCLUSION
In this article, a method to improve the frequency response of a LC filter is presented. This method takes into account the inter-component coupling that is created between the inductor and the parasitic inductance (ESL) of the capacitor. The optimal response is obtained for a particular relative position of the inductor and the capacitor at which the mutual inductance M value is equal to ESL. This method helps the filter designer to estimate the optimal distance through PSpice simulations based on analytical equations. The process is applied on the EMC filter of a wiper motor. The comparison of the measurements of the frequency responses of the original and the optimized filters show a great improvement. Then, conducted emissions on equipment are measured and it is shown that the level is reduced on wiper motor which integrates the optimized filter. The method has been validated for film capacitors. Next step is to validate it on electrolytic capacitors. Another perspective is to obtain the relative permeability of the ferrite core. Currently, the core must be taken out
[1] B. Revol, “Modélisation et optimization des performances CEM d’une association variateur de vitesse – Machine asynchrone”, Doctoral Thesis, Université Joseph Fourier, Grenoble (France), November 2003. [2] T. De Oliveira, “Optimisation du routage d’un filtre CEM”, Doctoral Thesis, Université de Grenoble (France), Août 2006. [3] S. Wang, F.C. Lee, W.G. Odendaal, J.D. van Wyk, “Improvement of EMI filter performance with parasitic coupling cancellation”, IEEE Trans. on Power Electronics, vol. 20, no. 5, September 2005. [4] S. Wang, R. Chen, J.D. van Wyk, F.C. Lee, W.G. Odendaal, “Developing parasitic cancellation technologies to improve EMI filter performance for switching-mode power supplies”, IEEE Trans. on EMC, vol. 47, no. 4, November 2005. [5] T.C. Neugebauer, D.J. Perreault, “Filters with inductance cancellation using printed circuit board transformers”, IEEE Trans. on Power Electronics, vol. 19, no. 3, May 2004. [6] A. Zhou, “Modèles de composants passifs et couplage électromagnétique pour filtres HF de puissance – Optimisation du placement”, Doctoral Thesis, Université Claude Bernard Lyon 1 (France), April 2013. [7] F. Lafon, “Techniques and methodologies development to take into account EMC constraints in automotive equipment design. Immunity analysis from component until the equipment”, Doctoral Thesis, INSA de Rennes (France), January 2011. [8] P. Fernandez-Lopez, M. Bensetti, F. Duval, G. Vincent, D. Baudry, “Low-impedance passive component modelling using S-parameter measurements”, CEM2012, Rouen (France), April 2012. [9] CISPR25 International Standard, International Special Committee on Radio Interference, (International Electrotechnical Commission IEC), March 2008.