Journal of
Sensor and Actuator Networks Article
Energy-Aware Forwarding Strategies for Delay Tolerant Network Routing Protocols Mahzad Kaviani 1,2, *, Branislav Kusy 1,3 , Raja Jurdak 1,3 , Neil Bergmann 1,3 and Vicky Liu 2 1 2 3
*
Commonwealth Scientific and Industrial Research Organisation (CSIRO), 4069 Brisbane, Australia;
[email protected] (B.K.);
[email protected] (R.J.);
[email protected] (N.B.) School of Electrical Engineering and Computer Science, Queensland University of Technology, 4000 Brisbane, Australia;
[email protected] School of Information Technology and Electrical Engineering, The University of Queensland, 4072 Brisbane, Australia Correspondence:
[email protected]; Tel.: +61-401-441-028
Academic Editor: Dharma P. Agrawal Received: 13 September 2016; Accepted: 22 November 2016; Published: 6 December 2016
Abstract: Delay Tolerant Networking (DTN) is well suited to challenging environments, defined by the lack of reliable end-to-end communication paths to the destination. However, the available energy is not considered in the majority of existing DTN routing protocols when they make forwarding decisions. This limits both delivery probabilities and the network lifetimes in energy-constrained applications. This paper investigates energy-aware routing protocols for wildlife tracking application to transmit data from attached sensors on the animal’s back to data collection base stations. We propose three new network protocol strategies to extend common DTN routing protocols, and consider the available energy to achieve efficient utilization of the node’s energy in transmission and sensing. These strategies enhance packet delivery rates up to 13% by carefully using the limited energy resources. We simulate two different animal tracking scenarios and show that the new strategies provide significant performance improvement under different scenarios. Keywords: delay tolerant network; routing protocols; energy-aware routing protocol; forwarding algorithm; the ONE simulator; wireless sensor networks; animal tracking
1. Introduction Wireless Sensor Networks (WSNs) are an active area of research that has gained significant attention in the past decade. WSNs are commonly used for monitoring indoor or outdoor environments and relaying sensed data to a database via a gateway. An important and challenging application of WSNs is monitoring wildlife where attached sensors on the animals can track movement with high temporal and spatial resolution [1]. A WSN node has three components, viz., sensing for measuring properties of the environment, processing for storing-processing the data and wireless communication for transmitting the sensed data to a Base Station (BS) or data sink [2]. WSN nodes can track the location and activity of those animals to investigate their behaviour. However, for small animals, these sensors must be lightweight and necessarily have limited energy available. Therefore, new approaches are needed to design WSN system architectures and protocols to maximize the data delivery, while considering available energy. WSN nodes are typically powered with batteries. Power sources such as solar panels can be added to the nodes to replenish its energy. A key issue is how to use limited energy resources within the WSN node in an effective and efficient way. Since externally recharging or replacing the battery is infeasible in some applications, efficient utilization of energy resources and optimization techniques are required to prolong the network lifetime. J. Sens. Actuator Netw. 2016, 5, 18; doi:10.3390/jsan5040018
www.mdpi.com/journal/jsan
J. Sens. Actuator Netw. 2016, 5, 18
2 of 21
WSN nodes spend a large proportion of their energy on communicating data back to a BS. While extensive related work exists for WSN protocols, the most relevant background is in the area of an Intermittently Connected Network (ICN), in which there is no end-to-end connection between the source and the destination. Specifically, a networking paradigm called Delay Tolerant Networking (DTN) has been proposed to address challenges such as communication disruptions and delays in ICNs [3]. The main challenge of DTNs is limited energy resources that constrain nodes to local area communications, which means the data cannot be continuously streamed to a remote base station. DTN is an intermittently connected (wireless) mobile ad hoc network (MANET), which provides no guarantees of end-to-end connectivity between the source and the destination. For successful data transmission over the network in the presence of delay and interruption, cooperation between nodes is required [4]. Routing protocols for conventional networks and MANETs are inadequate to provide successful data transmission in DTNs owing to a lack of persistent end-to-end connectivity. To overcome intermittent connectivity, DTNs use a common method called the store-carry-forward approach for data delivery [5]. In this approach, messages can be transferred between the source and the destination in several hops. When the message is generated, it will be stored in the buffer of the source node then forwarded to other encountered nodes. When the next node is not immediately available, then the message would be stored in a buffer and carried until an appropriate communication opportunity arises. This is repeated until the message reaches its destination. The main challenges under investigation are limited available energy resources and limited node connectivity in long-term animal tracking applications. While previous researchers investigated energy consumption of DTN protocols, they have not addressed the performance of the algorithms in terms of available energy and have not considered energy harvesting. With energy harvesting, the energy budget available for DTN protocols is dynamic, which requires adaptive protocols. How to reconfigure forwarding protocols in DTNs as the energy budget changes is challenging. To the best of the authors’ knowledge, there is no previous work on energy-aware protocols for DTNs. To address this challenge, three new generalized strategies are examined to augment existing routing protocols with the consideration of energy awareness, in terms of energy harvesting and energy storage. An energy conservation state is defined in which the nodes stop participating in routing and stop collecting data to conserve energy for transmitting existing packets to the data sink later. The Threshold strategy enters the conservation state based on a user-defined energy threshold. The Remaining Required Energy (RRE) strategy determines the optimal threshold based on the amount of energy required to transmit data to a sink. The Optimized Remaining Required Energy (ORRE) strategy determines a threshold based on the expected amount of data to be collected before data can be offloaded to a BS. This work is motivated by a specific application of tracking the location of small, highly mobile animals, such as flying foxes [6], with WSN nodes. In this application, network gateways are located at some roosting camps of the flying foxes. During feeding times, all the flying foxes are far from the roosting camps, and there is no connectivity to the gateways. Additionally, some flying foxes do not roost at gateway-equipped camps, and so their data must be relayed by other animals through a DTN network. The nodes have a constrained energy budget including stored energy, as well as energy that is periodically harvested from small solar cells. The Opportunistic Networking Environment (ONE) simulator [7] is used to evaluate performance of Threshold, RRE and ORRE strategies through different scenarios. We simulate two scenarios of animal tracking including flying foxes (active at night) and pigeons (active during the day) to explore different interplay of daily activity patterns and energy-harvesting periods. Our results indicate that performance of energy-aware versions of DTN routing protocols can improve the packet delivery rate by up to 13%. Results also show that ORRE can outperform RRE with up to 4% higher packet delivery rate.
J. Sens. Actuator Netw. 2016, 5, 18
3 of 21
This paper is an extension of our previously published conference paper [8]. Our previous work considered the Threshold and RRE strategies in the context of a flying fox strategy. This new paper extends this work by describing an improved algorithm, ORRE, and also by considering a second “pigeon” scenario where energy harvesting and animal activity happen at the same time. Additionally, this paper provides details of how the ONE simulator has been extended to support energy-aware forwarding decisions. 2. Related Work 2.1. Delay Tolerant Networking (DTN) Routing Protocols DTN routing protocols can be classified in relation to the type of information collected by nodes to make routing decisions. Finding the destination requires two different properties: replication and knowledge [9]. Replication uses multiple copies of each message to increase the chance of delivery probability and reduce delivery latency. Knowledge makes forwarding decisions based on information about the network. The DTN routing protocols are classified into two categories based on these properties [9,10]:
• •
Flooding routing protocols; Forwarding routing protocols.
In the flooding protocols, each node spreads a number of copies of each message to other nodes without any information about the structure of the network. The nodes keep and store the copies of the messages in their buffer until they encounter the next node or the destination. Message replication helps to increase the probability of message delivery because more nodes are responsible for delivering the message to the base station. The flooding routing protocols include Epidemic Routing, Two-Hop Relaying, Tree-Based Flooding and Prioritized Epidemic Routing [10–12]. Forwarding routing is a knowledge-based approach without replication. In this strategy, knowledge about the network is required by the routing protocol and the nodes collect information about other nodes in the network to select the best path to forward the message to the destination [9]. Location-Based Routing, Source Routing, Per-Hop Routing and Per-Contact Routing belong to the forwarding family [10,12]. The next paragraphs provide more details about popular existing DTN routing protocols, which are used in this study, specifically, Direct Delivery, Spray and Wait (SAW), Epidemic, and Probabilistic Routing Protocol using History of Encounters and Transitivity (PROPHET). The purpose of presenting these protocols is to use them as baselines for adding our proposed energy awareness, and to compare their performance with and without energy awareness. 2.1.1. Direct Delivery The Direct Delivery routing is a single-copy routing protocol [13] where nodes only carry one copy of the message for transmitting directly to the final destination without any relaying to additional nodes [6]. This strategy does not require any information about the network and permits the messages to be transmitted through one hop only when the source nodes are in contact with the destination. This simple protocol has minimum overhead ratio, but has low delivery ratio. It is typically used as a baseline for other protocols [9]. 2.1.2. Epidemic Vahdat and Becker [14] proposed the opportunistic routing protocol called Epidemic, which is a flooding-based forwarding protocol. The objectives of this routing are to maximize the delivery of the messages, and minimize the delivery latency in message delivery. In the Epidemic protocol, nodes send copies of messages to all nodes that they encounter with no knowledge of the network. The encountered nodes save the messages in their buffer using the
J. Sens. Actuator Netw. 2016, 5, 18
4 of 21
store-carry-forward method until meeting another node or destination. The list of messages, which is stored in the node’s buffer, is called the summary vector. Whenever two nodes encounter each other they exchange their summary vectors and compare them to identify new messages that should be downloaded from the encountered node. The Epidemic algorithm guarantees high delivery rates and the destination can receive all messages from nodes if the buffer capacity of nodes is sufficiently large [9]. A common approach in Epidemic is to set a Time-To-Live (TTL) on the expiry time for each message, so nodes only keep message copies until the TTL has expired [4]. In fact, all routing algorithms can benefit from dropping very old packets by using a TTL timer. Although Epidemic has high delivery rates, flooding is likely to cause a high overhead due to the number of copied messages in the network, which can congest the network. Also, by spreading large numbers of messages over the network, this type of algorithm will consume a significant amount of resources such as power, bandwidth and buffer space. 2.1.3. Spray and Wait (SAW) With the intention of reducing the resource consumption for the Epidemic protocol, Spyropoulos et al. [15] proposed the Spray and Wait routing protocol to control the replication of messages in the network. Spray and Wait (SAW) routing is a combination of the distribution speed of Epidemic and the simplicity of Direct Delivery protocols [16]. Similar to the Epidemic protocol, the SAW protocol copies messages without any knowledge of the network topology but it limits the number of copies of the message. This routing protocol consists of two phases: Spray phase: The source node after generating a new message, sprays L message copies to L intermediate nodes it encounters. When the copies are received by intermediate nodes these go into the second phase. Wait phase: The intermediate nodes carry all the received messages in their buffer and wait until hopefully one of the nodes will encounter the final destination and deliver the data to it directly. There are two types of Spray and Wait [17]:
•
•
Source Spray and Wait: In this method, the source node spreads all L-1 copies to the first L-1 encountered distinct nodes (each encountered node gets a copy; and the source itself retains a copy), and all nodes with a copy are in the Wait phase until they meet the destination and release the copy. Binary Spray and Wait: In Binary type, the source node generates L copies of the original message and whenever it meets a node with no copies, it transfers half of the copies (L/2) to the node and keeps the remaining copies (L/2). The source and relay node with (L > 1) copies continue this process until a single copy remains, which is delivered to the destination directly.
2.1.4. Prophet To improve the delivery probability and reducing the consumption of network resources, another DTN routing was introduced called Probabilistic Routing Protocol using History of Encounters and Transitivity (PROPHET) [18]. PROPHET, unlike Epidemic, uses information which is derived from the past node encounters such as number of packet copies, mobility pattern, location, contact time and social behavior of nodes to optimize the packet delivery [19]. In PROPHET, each node uses a probabilistic metric named delivery predictability, P(a,b) ∈ [0, 1] which is established at every node, a, for each known destination b, indicating the probability of the relay node for delivering packets to the final destination [18]. By using this metric, reliable node choices for the next message hop can be estimated. In PROPHET, when two nodes encounter each other, they exchange their summary vectors including the delivery predictabilities for all destinations known by every node and update the interval
J. Sens. Actuator Netw. 2016, 5, 18
5 of 21
delivery predictability. After updating the information, nodes decide which messages should be exchanged based on the forwarding strategy. If node a communicates with node c, a carried message with destination b is forwarded from node a to c if P(a,b) < P(c,b). PROPHET relies on the calculation of probabilistic metrics to estimate the probability of a node delivering the message to the destination which is calculated in three parts [20].
•
When two nodes meet each other, they exchange and update their delivery predictability, so the node, which is encountered frequently, has a higher delivery predictability than other encounters. This probabilistic metric is calculated as: P(a,b) = P(a,b)old + (1 − P(a,b)old ) × Pencounter
•
(1)
where Pencounter is an initialization constant. When two nodes do not encounter each other, their delivery predictability should be low. Equation (2) is the aging equation for a node where γ(gama) ∈ [0, 1] is the aging constant and k is the elapsed time since the last aging time update. P(a,b) = P(a,b)old × γk
(2)
Another part of the calculation of delivery probability is the transitive property. If node a frequently meets node b and node b frequently meets node c then node c is a good candidate for forwarding messages intended for node a. Equation (3) indicates the effect of transitivity on the delivery predictability where β ∈ [0, 1] is a scaling constant of the effect which the transitivity should have on the delivery predictability. P(a,c) = P(a,c)old + (1 − P(a,c)old ) × P(a,b) × P(b,c) × β
(3)
2.2. Challenges of Routing Protocols There are many technical challenges in designing DTN routing protocols such as long delay, high latency, limited resources, frequent disconnection and opportunistic or predictable connections. In several research projects, the performance of some of these DTN routing protocols has been analyzed and compared in terms of data delivery rates and latency. Mehto and Chawla [17] compared some of the popular routing protocols namely Epidemic, MaxProp, PROPHET and Spray and Wait (SAW). They studied the impact of varying buffer sizes and varying “L” copy parameter in SAW on the performance of three metrics, namely Delivery Ratio, Overhead Ratio, and Average Delay by using the Opportunistic Networking Environment (ONE) simulator. Desai, et al. [21] investigated and compared three different DTN routing protocols: Direct Delivery, Epidemic Routing and Spray and Wait (SAW) by focusing on the average packet delivery probability and average latency. They asserted that Direct Delivery has the lowest packet delivery probability and this routing is not appropriate for real-time applications. These studies investigated and analyzed the performance of DTN routing protocols in terms of various buffer sizes and number of nodes. The mainstream DTN routing protocols assumed to be unconstrained in energy resources, hence they do not adjust their behaviour based on the available energy. The main purpose of our study is to address the issues of energy-aware and energy-efficient DTN routing protocols, which have not been widely investigated. Our study addresses the fact that energy considerations are critically important in energy-constrained deployments and can substantially improve data delivery rates.
J. Sens. Actuator Netw. 2016, 5, 18
6 of 21
2.3. Energy Efficiency of DTN Routing Protocols Different routing protocols with their own diverse characteristics and features have been proposed for DTNs. The existing DTN routing protocols do not consider the available energy resources when making routing decisions. Only a few researchers have investigated energy-aware protocols. Cabacas et al. [22] investigated the performance of four existing DTN routing protocols in terms of energy consumption by varying the number of nodes, message sizes, message generation intervals and the nodes’ speeds. They only measured energy consumption and did not consider energy information in DTN routing decisions. The authors in [11,23] proposed energy-efficient add-ons to existing routing protocols such as the Epidemic routing protocol and Two-Hop routing protocol (2HR), which uses a forwarding strategy based on the message lifetime and delivery probability requirements. They analyzed the performance of these two protocols using analytical models such as an Ordinary Differential Equations (ODE) model in a heterogeneous DTN. In [11], an ODE model was used to model the performance of these routing protocols with individual node selfishness. The energy-efficiency improvement of their work is revealed by comparing the performance of both Epidemic and 2HR protocols. The applicability of these protocols in realistic scenarios representing practical applications needs further investigation. Another body of literature focuses on maximizing network lifetime. Sghaier et al. [24] proposed EXLIOSE (EXtending network LIfetime in Opportunistic SEnsor Networks), a routing protocol in mobile WSNs based on a new metric called Energy Shortage Cost (ESC). The aim of this approach is maximizing network lifetime by choosing the next hop based on ESC, which considers the energy consumption and residual energy of each sensor node. A decision for transferring the message to other nodes is based on a calculation of the ESC in each node, and messages are forwarded to the neighbour with a lower ESC. Cabacas and Ra [25] proposed a novel context-metric queuing method for Delay Tolerant Networks to achieve high delivery probabilities with higher-priority messages and utilize the node’s energy efficiently in transmission. A new metric is introduced to sort and queue a message in the buffer by using a node’s remaining energy, speed and estimated distance to the destination. To achieve effective utilization of a node’s energy in transmission, an energy-aware transmission scheme is implemented to assign priority levels of messages for forwarding the messages to nodes. Both EXLIOSE and CEAMS (Context-metric queuing and Energy-Aware Message priority Scheme) methods provide higher message delivery rates and performance over protocols that do not take energy into consideration. However, the energy consumption and residual energy of nodes are calculated based on radio scanning and transmitting energy without considering energy consumption when generating messages and without considering energy harvesting. Energy-Aware Epidemic Routing (EAER) [26] is an extension of the n-Epidemic routing, which aims to improve packet delivery ratio and energy consumption. The n-parameter strategy is proposed to optimize the possibility of transferring packets from a node to its neighbors when they are within the transmission range. By using this technique, a node will transmit its packet to the next node only when it is within the range of at least n neighbors. They proposed an energy-aware heuristic algorithm called the Prevalence Strategy (PS), which manages the value of n based on the Current Energy Level (CEL) and Current Neighbour Node (CNN). When the residual energy of a node is low, the n-parameter value will be increased so the probability of being within the range of many nodes is low, allowing the node to conserve energy. Previous work on DTN routing protocols mostly focused on the energy consumption. Namely, forwarding decisions are designed to be energy efficient, but these forwarding decisions are not reflected by the energy available on each node. In our work, forwarding decisions consider available energy. There has also been little research done in energy-aware DTN routing protocols for mobile nodes that include the capability of energy harvesting and energy storage. Past work has assumed energy is a monotonically decreasing resource. The aim of this study is to propose a novel approach to enhance existing DTN routing protocols with the expectation for high packet delivery rates through
J. Sens. Actuator Netw. 2016, 5, 18
7 of 21
energy-aware forwarding decisions based on instantaneous energy reserves. From the literature review mentioned above, there is a research gap in the area of energy-efficient DTN routing. We believe that DTN routing protocols can be modified to improve their performance when both available energy and future energy harvesting are considered. 2.4. The Opportunistic Networking Environment (ONE) Simulator The Opportunistic Networking Environment (The ONE) simulator is a Java program which makes complex DTN simulations more realistic [7]. The ONE has been widely used for evaluating DTN routing and application protocols. This simulator is able to use various movement models from synthetic models to real movement traces to create a motion model of nodes, forwarding messages between nodes through different DTN routing protocols and visualizing the mobility motion of nodes and message transfer in its graphical user interface. movement model J. Sens.The Actuator Netw. 2016, 5, 18 of nodes, inter-node contacts, routing and message handling are the 7main of 20 functions of the ONE simulator. Visualization, reports and post-processing tools are used for analyzing and the results [27]. Figure 1 shows anrouting, overview of the ONE simulator, which has four has collecting four modules, namely, movement models, event generator and visualization, and results. namely, movement models, routing, event generator and visualization, and results. modules, visualization and results module. module. ONE is capable of visualizing The output is produced by the visualization simulation in two ways: via an interactive Graphical User Interface (GUI) and by generating results of simulation images or or graphs graphsfrom fromthe thereports, reports,which whichare arecreated created the simulation [27]. The ONE simulator images inin the simulation [27]. The ONE simulator cancan be be run through two methods: GUI method and method. a batch method. The GUIis method used for run through two methods: a GUIamethod and a batch The GUI method used for is visualizing, visualizing, testing andwhereas debugging whereas theisbatch is used for running multiple simulation testing and debugging the batch mode used mode for running multiple simulation scenarios with scenariosparameters. with different parameters. different
Figure 1. Overview of the ONE simulator [6].
As each node has an energy budget, which is consumed for node activities such as forwarding, As each node has an energy budget, which is consumed for node activities such as forwarding, receiving, radio scanning and generating message, the energy mechanism [28] is implemented in the receiving, radio scanning and generating message, the energy mechanism [28] is implemented in the ONE simulator to analyze the impact of energy consumption on the DTN routing protocols. This ONE simulator to analyze the impact of energy consumption on the DTN routing protocols. This energy module is added within the routing module in the ONE framework as shown in Figure 2. energy module is added within the routing module in the ONE framework as shown in Figure 2. This work extends the open-source ONE simulator by allowing existing DTN protocols to make forwarding decisions based on the available energy resources. It also extends the energy modelling to include energy-harvesting features, where the energy is replenished from solar power.
Figure 1. Overview of the ONE simulator [6].
As each node has an energy budget, which is consumed for node activities such as forwarding, receiving, radio scanning and generating message, the energy mechanism [28] is implemented in the simulator analyze J.ONE Sens. Actuator Netw.to2016, 5, 18 the impact of energy consumption on the DTN routing protocols.8 This of 21 energy module is added within the routing module in the ONE framework as shown in Figure 2.
Figure 2. 2. Energy module implementation implementation in in the the ONE ONE simulator. simulator. Energy module J. Sens. Actuator Netw. 2016,Figure 5, 18
8 of 20
This work extendsRouting the open-source ONE simulator by allowing existing DTN protocols to make 3. New Energy-Aware Protocols forwarding decisions based on the available energy resources. It also extends the energy modelling In thisenergy-harvesting section, we first features, describewhere the general WSN framework that our wildlife to include the energy is replenished fromunderpins solar power. monitoring system. system.We Wethen then propose three energy-aware strategies for routing DTN routing protocols, monitoring propose three energy-aware strategies for DTN protocols, namely namely Threshold, andstrategies. ORRE strategies. These approaches extend common DTN protocols to Threshold, RRE andRRE ORRE These approaches extend common DTN protocols to consider consider energy and they aim to achieve effective utilization of residual energy. These new energy and they aim to achieve effective utilization of residual energy. These new techniques use the techniqueswell-known use the standard, as PROPHET, Epidemic, standard, routingwell-known algorithms routing such as algorithms PROPHET, such Epidemic, and Spray and Wait,and andSpray then and Wait, and then add anbelow energywith threshold below withforwarded packets that areto forwarded to gateways. add an energy threshold packets that are only gateways.only Specifically, we Specifically, we focus on a family of applications that track mobile objects with regular daily motion focus on a family of applications that track mobile objects with regular daily motion patterns that rely patterns thatreplenishing rely on periodic replenishing of energy resources. on periodic of energy resources. 3.1. Wireless Sensor Networks (WSN) Framework Our WSN monitoring system is organized as a network with a multi-tier architecture [6] with low-tier animal tag devices operating on a tight energy-harvesting budget, the middle-tier gateways acting as a data aggregation layer, layer, and and high-tier high-tier cloud cloud services services offering offering seamless seamless delay-tolerant delay-tolerant presentation of data to end users users (see (see Figure Figure 3). 3).
Figure the wildlife wildlife tracking tracking framework. framework. Figure 3. 3. Network Network architecture architecture of of the
This architecture allows the end devices to focus on sampling the data in an energy-efficient way and be agnostic when the users access the data. The data aggregation layer supports intermittent connectivity of the mobile devices. Gateway nodes in the aggregation layer act as data sinks and they share a network-wide state of the downloaded data for each individual end device. Consequently, the data from the end devices does not need to be re-downloaded when they connect through another
J. Sens. Actuator Netw. 2016, 5, 18
9 of 21
This architecture allows the end devices to focus on sampling the data in an energy-efficient way and be agnostic when the users access the data. The data aggregation layer supports intermittent connectivity of the mobile devices. Gateway nodes in the aggregation layer act as data sinks and they share a network-wide state of the downloaded data for each individual end device. Consequently, the data from the end devices does not need to be re-downloaded when they connect through another gateway. The top tier in our system consists of several web services running on a server. This layer presents real-time updated information about the download status for each individual node, node configuration information, and finally the time series of the collected data, such as GPS locations or animal activity. The main criteria in our system design are energy efficiency at the end device layer and delay tolerance of the data collection process to support a case where animals are not in contact for an extended time period. Energy efficiency of data communications is achieved through an asymmetric low-power listening protocol [29], where gateways keep their radios on at all times and end devices beacon short packets when they have data to be transmitted. The delay tolerance is achieved through buffering the data in the on-board flash memory on the end devices, until the time when the node connects to a gateway node. Our buffer was designed to hold data over a two-week period, after which old data will be overwritten. 3.2. Threshold Algorithm The Threshold algorithm incorporates a user-defined energy threshold below which the node will conserve its energy. Such a threshold is designed to prevent the node from running out of energy causing shutdown of its processor. The threshold can have a significant impact on the performance of routing protocols. For example, nodes may save energy for later, so they can transmit packets directly to the base station when they come within the transmission range. The energy threshold Eth is defined as a fixed percentage (thpercentage ) of the harvested energy (Eh ) in the system. Given the harvested energy Eh , we define the energy threshold as follows: Eth = thpercentage × Eh
(4)
Specifically, the Threshold algorithm will not forward packets to other nodes or accept forwarding packets when the stored energy falls below Eth . Effectively, the node changes to the Direct Delivery mode to only transmit packets to a base station. The node will also stop collecting data from the sensor (such as GPS), if the energy falls below a fixed threshold [30,31], as the energy requirements for sensing can also be significant. A threshold of 0% corresponds to no energy awareness, and a threshold of 100% is equivalent to the Direct Delivery algorithm. 3.3. Remaining Required Energy (RRE) Algorithm The Threshold algorithm allows users to control the performance of the routing protocol by defining the energy threshold parameter. However, it can be a tedious task to find the optimal value of the energy threshold as it depends on the operating conditions, such as changes in the energy harvested per day, or changes in the motion patterns of the tracked objects. The RRE algorithm derives the best value of the threshold denoted by ETh RRE Fwd automatically. The underlying principle is to conserve sufficient energy required to allow a node to transmit packets currently stored in its buffer to a base station at the time of their next encounter. Effectively, the strategy is to prioritize transmission of direct packets to the base station over multi-hop data packets and over sensing additional data. The RRE forwarding threshold (ETh RRE Fwd ) depends on two factors: (1) the energy required to transmit the packets collected since the last encounter with a base station (Etx_packetToday ); and (2) the energy required for the node to run its basic functions (such as scanning for a base station)
J. Sens. Actuator Netw. 2016, 5, 18
10 of 21
until its energy is recharged (Escan ). The energy threshold for entering the energy conservation state is therefore: ETh RRE Fwd = Etx_packetToday + Escan (5) where Etx_packetToday estimates the energy needed to deliver packets to a base station based on the number of packets currently buffered at the node and Escan estimates the energy baseline required until the next energy-harvesting event. The following equations define the energy required for forwarding packets and radio scanning: Etx_packetToday = NpacketToday × Etx_per_packet × Ctx_loss
(6)
NpacketToday = NcurrentPackets - NPreviousDayPackets
(7)
Escan = (tremaining_time ÷ tscaninterval ) × Erx_scan
(8)
where NpacketToday is the number of packets that the node received and/or generated today. Etx_per_packet is the amount of energy needed to transmit one packet. As some packets may be lost due to collisions, we use a multiplication factor Ctx_loss to reserve enough energy for packet retransmissions. Finally, tremaining_time is the time until the node starts harvesting energy next time, tscaninterval is the time interval that the node scans for the presence of another node, and Erx_scan is the amount of energy required for channel scanning. Similar to the Threshold algorithm, once the energy falls below a predetermined threshold, the node stops GPS location tracking to reserve its energy for transmitting stored packets directly to the base station. 3.4. Optimized Remaining Required Energy (ORRE) Algorithm The RRE algorithm automatically determines the optimal threshold for individual nodes based on the energy required to transmit stored packets back to the base station. However, this constraint does not take into account scenarios where the nodes collect data in a non-uniform manner. Specifically to the wildlife-tracking scenario, if animals are active during the middle of the day, the RRE strategy will overestimate its available energy resources during the first half of the day when the tracking nodes are collecting a small number of data points. We propose the Optimized Remaining Required Energy (ORRE) strategy to address the non-uniform data collection scenarios using a user-provided parameter to define the minimal number of packets that the application is expected to collect between energy-harvesting events. The forwarding threshold of ORRE (ETh oRRE Fwd ) is based on three factors: (1) the energy required for transmitting the current packets in the buffer (Etx_packetToday ); (2) the energy required for scanning the base station during the remainder of the day until the next recharge time (Escan ); and (3) the energy required for forwarding the minimum number of collected packets to the base station (EReserved ). The forwarding energy threshold (ETh oRRE Fwd ) for reserving energy in ORRE is calculated as follows: ETh oRRE Fwd = Etx_packetToday + Escan + Eexpected
(9)
Etx_packetToday = NpacketToday × Etx_per_packet
(10)
Escan = (tremaining_time ÷ tscaninterval ) × Erx_scan
(11)
Eexpected = EReserved × Delta
(12)
EReserved = NReserved × (Etx_per_packet + EGPS )
(13)
Delta = (tremaining_time ÷ tPerDay )
(14)
where EReserved is the expected energy required to forward collected packets to the base station, Etx_per_packet is the amount of energy required to transmit one packet and EGPS is the amount of energy
J. Sens. Actuator Netw. 2016, 5, 18
11 of 21
required for sampling one packet. Delta is a parameter that is proportional to the time remaining in the day. Unlike the constant thresholds for data sampling used in Threshold and RRE strategies, the sampling threshold in ORRE also depends on the number of packets stored in the buffer: ETh oRRE Samp = NpacketToday × Etx_per_packet
(15)
The nodes stop sampling once their remaining energy drops below the sampling threshold oRRE Samp ). Both RRE and ORRE algorithms require the nodes to be able to accurately estimate the time when they recharge their energy and the time of the next contact with a base station. We note that these assumptions are true in our motivating application, or more generally, in solar energy-based deployments of sensor networks that collect data regularly. We implemented the three strategies in the ONE simulator. Specifically, the algorithms are implemented in the lower layers of the network stack, thus they are reusable across existing DTN routing protocols. Most implementations of DTN routing protocols in ONE rely on shared functions that are used by all routing protocols. For example, the “ActiveRouter” Java class implements the functionality associated with dropping packets when the time-to-live expires in transit or a buffer is full. By extending the shared function components, energy-aware functionality can be enabled across all routing protocols. We can then utilize existing protocols to study mobile networks with periodic motion, specifically with animal tracking scenarios. (ETh
3.5. Discussion We have presented three different strategies to support energy awareness for DTN routing protocols. The Threshold strategy is straightforward and efficient; however, it requires the user to provide a predetermined threshold for the node to enter a power-saving mode. Since the threshold is fixed, the Threshold strategy does not perform optimally under different operating conditions such as different energy harvesting, packet generation rates and changed motion patterns. The RRE strategy addresses the inflexibility of the Threshold strategy by determining the optimal threshold automatically. A drawback of RRE is that nodes can consume too much energy to forward or sample data in scenarios where they encounter other animals non-uniformly during the day. The ORRE strategy aims to improve the packet delivery rates of RRE by introducing a reserved energy budget for a certain minimum number of data samples collected during the day. This approach is capable of achieving an appropriate balance between forwarding and sampling data, while conserving sufficient energy for direct delivery to the base station at later stages. In all of these algorithms, the nodes that have never met the base station, are not informed about the packets that are delivered to the base station. Consequently, the energy they expend on packets that were already delivered to the base station through other nodes are wasted. This reduces the chance of delivering packets to the base station. To account for this effect, we consider a global buffer, in which the nodes track the packets that were delivered to the base station. 4. Evaluation and Analysis This study uses the ONE simulator [7] to evaluate the proposed Threshold, RRE and ORRE algorithms for the mainstream DTN routing protocols with a focus on tracking wild animals. The simulation scenario and extension of the ONE simulator to support empirically based simulations are described, followed by the discussion of the evaluation metrics and results. 4.1. Scenarios While the results from this work may be more generally applicable to mobile DTN applications, we focus our evaluation on scenarios inspired by the flying fox tracking project. We perform
J. Sens. Actuator Netw. 2016, 5, 18
12 of 21
simulations for two animal species that have different daily activity patterns, to explore the performance of our proposed algorithms under different scenarios. Specifically, we assume the tracked animals periodically visit foraging areas where they look for food and rest at roosting camps between the feeding periods. Some of the rest areas are equipped with base stations that download data from animals and forward it to a server. In addition to the suite of sensors that track animal locations and activities, each node has a solar panel for energy replenishment. There are five resting areas and five foraging areas on the simulated map. Two rest areas are equipped with base stations. We simulate twenty animal nodes with GPS tracking sensors, and one-half of the animals periodically come back within the transmission range of a base station each day. Each scenario runs for one week (7 days and 7 nights). The flying and foraging time is 3 h, and during this time GPS position is recorded every 4–6 min. Each GPS reading generates a 100-byte packet, and each node generates approximately 3.5 KB per day. If a node runs out of energy, it will stop taking any more GPS readings or participating in communication with other nodes. 4.2. Activity Patterns The primary animal species simulated in this paper are flying foxes (a species of fruit bat). The animals take approximately twice as long to travel between foraging and resting areas as they spend foraging, based on statistics derived from the empirical data [6]. Energy harvesting happens in the rest area, as the animals sleep during the day in direct sunlight and look for food during the night. The animals offload the data they collected during the day to a base station when they are at the resting area, but subject to the energy constraints. We also simulate an animal species with daytime feeding patterns and call this the pigeon-tracking scenario (without loss of generality). Pigeons are assumed to follow similar mobility patterns to flying foxes, except their commute and forage periods overlap with energy harvesting, while flying foxes are resting when the energy is harvested during the day. Although in our simulations, the animals randomly change their motion patterns, their foraging areas, and the resting areas they visit, they maintain temporal regularity of their daily patterns. For example, they start and stop foraging at approximately the same time. We use this regularity pattern to design our proposed routing protocols aiming to improve packet delivery rates. 4.3. Simulation Parameters Our selection of simulation parameters was motivated by an existing system deployment for the flying fox monitoring program [29]. All nodes include batteries with 300 mAh capacity corresponding to 4000 J of stored energy. Each GPS reading consumes energy of 0.75 J. We use a low-power listening scheme set with 1% radio duty cycle [32] that uses 0.052 J to transmit a packet and 0.002 J to receive a packet or channel scanning for presence of another node. The radio range is 500 m, transmission speed is 250 kbps, and each node has 5 MB packet buffer space. The packet buffers are sufficient to store all messages generated during simulation. Sensor nodes can harvest energy up to the maximum battery capacity. The summary of the simulation parameters is listed in Table 1. Table 1. Simulation parameters for both flying fox and pigeon scenarios. Number
Simulation Parameter
Value
1 2 3 4 5 6 7 8
Simulation time Movement model Message size Buffer size Update interval Battery capacity Transmit energy Scan energy
7 days (3 h per day) External Movement 100 b 5 Mb 0.01 300 mAh–4000 J 0.052 J 0.001 J
J. Sens. Actuator Netw. 2016, 5, 18
13 of 21
Table 1. Cont. Number
Simulation Parameter
Value
9 10 11 12 13 14 15
Receive energy Sensing energy Message generation interval Recharge energy Number of base station Number of nodes Transmit range
0.002 J 0.75 J 4–6 min 30 J 2 20 100 m
4.4. Extension of the Opportunistic Networking Environment (ONE) Simulator Configuring a simulation scenario in the ONE simulator involves defining motion traces, packet generation events, and hardware-related simulation parameters. The ONE simulator also supports external motion traces for the simulated nodes and accepts time series of node locations (t, id, x, y) as an input, where t is the time of the location, id is the node identifier, and (x, y) are the node coordinates. Our flying fox dataset is relatively sparse in recorded contacts between animals. We therefore model the behaviour and motion patterns of the animals based on empirical traces. Specifically, we classify the animal behaviours into one of three states: resting, foraging, and travelling between foraging sites. The animals are stationary in the resting state, follow random movement within the foraging area in the foraging state and follow a randomized shortest path to travel between foraging areas. Parameters of the random motion were obtained empirically from existing flying fox movement traces. The behaviour and motion model generates a single motion trajectory for one day in the life of a flying fox, which is used in the simulator. The energy consumption model in the ONE simulator by Silva et al. [28] was insufficient for our purposes, as it does not support energy harvesting. We have therefore extended the model to allow for periodic harvesting of energy at predefined time intervals (such as daylight periods for solar harvesting) and introduced a parameter that defines the capacity of the energy storage. 4.5. Performance Metrics We consider three metrics in our evaluation. The first metric was adapted for the purposes of our simulation scenario, while the remaining two metrics are commonly used in literature.
•
•
Packets Delivered (per day): This is the main performance metric. The number of packets delivered to the base station is used rather than the more standard delivery rate metric (i.e., percentage of packets that are delivered to the destination). The reason is that the number of generated packets can vary for different nodes and routing protocols, as nodes do not generate packets when they run out of energy or their energy is below a fixed threshold. We normalize the metric per simulation day, so it is independent of the duration of the simulation. Overhead Ratio: This is defined as the ratio of total number of packets transmitted in the network and the number of packets delivered to the base station successfully. Overhead Ratio =
•
(R − D) D
(16)
where R is the number of messages relayed during the simulation and D is number of messages delivered to the base station. Average Latency: This is calculated as the average time required for a packet to be delivered to a base station. Nr (Tr − Tc) Average Latency = ∑ (17) Nr k=1
J. Sens. Actuator Netw. 2016, 5, 18
14 of 21
where Tr is the time when the packet is received, Tc is the time when the packet is created and Nr is the number of received packets. Other possible metrics of interest which can be derived from the above metrics include:
•
• •
Number of initiated messages: This is just the same as the number of messages transmitted, since messages are only sent when a link is established, and in this simulation they are always successfully received. Average Hop Count: For successfully received messages this is the same as (1 + overhead ratio). Number of Dropped Packets: This is the number of packets out of the 720 generated per day that are not delivered, i.e., (720 – packets delivered), since undelivered packets are dropped once the time-to-live expires. Buffers are sufficient large that all packets are retained until their TTL is reached.
4.6. Results and Analyses
Packets Delivered (per day)
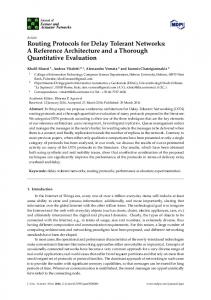
The performance of our proposed strategies, viz., Threshold, RRE and ORRE are evaluated with four DTN routing protocols: Epidemic, Prophet, Spray and Wait, and Direct Delivery. The statistics based on three randomized trials are calculated and we show the average results for both flying foxes and pigeon scenarios. Figure 4 shows the daily packet delivery rates of DTN routing protocols using Threshold, RRE and ORRE strategies for the flying fox scenario. In this figure, a threshold of zero corresponds to the original DTN algorithms and a threshold of one corresponds to direct packet deliveries to the base station similar to the Direct Delivery protocol. Figure 4 shows that the performance of energy-unaware algorithms (zero threshold) can be improved for the four DTN routing protocols at the optimal threshold. Similarly, all protocols perform the same as Direct Delivery when the threshold reaches one. The optimal threshold for all protocols is 0.5 and improves the original Epidemic, Prophet, Spray and Wait protocols by 12%, 10%, 10%, respectively. J. Sens.Prophet Actuator protocol Netw. 2016,performs 5, 18 20 the best in Threshold strategy as Prophet is able to best make use14ofofthe regular daily patterns and periodic contacts between nodes. The results of RRE strategy are slightly worse than the optimal threshold in the Threshold The results of RRE strategy are slightly worse than the optimal threshold in the Threshold algorithm. However, the ORRE strategy improves the RRE performance up to 4% and closes the gap algorithm. However, the ORRE strategy improves the RRE performance up to 4% and closes the gap to the optimal Threshold strategy. to the optimal Threshold strategy.
700 600 500 400
Epidemic
300
Prophet
200
SprayAndWait
100
DirectDelivery
0 0
0.2
0.4
0.6
0.8
1
1.2 1.4 1.6 RRE ORRE
Threshold Figure 4. Packets delivered per day for Threshold, RRE and ORRE strategies for flying foxes. Figure 4. Packets delivered per day for Threshold, RRE and ORRE strategies for flying foxes.
day)
Figure 55 shows shows the the packet packet delivery delivery rates rates of of DTN DTN algorithms algorithms for for three three strategies strategies with with the the pigeon pigeon Figure scenario. ItItisisclear clearthat that once enable energy awareness, Threshold strategy improve scenario. once wewe enable energy awareness, the the Threshold strategy can can improve the energy-unaware version of all algorithms except Direct Delivery by up to 13%. In this scenario, the optimal threshold is 0.7 and the four DTN protocols perform similarly to each other.
700 600
Threshold Figure 4. Packets delivered per day for Threshold, RRE and ORRE strategies for flying foxes. J. Sens. Actuator 2016, 18 Figure 5 Netw. shows the5, packet
Packets Delivered (per day)
15 of 21 delivery rates of DTN algorithms for three strategies with the pigeon scenario. It is clear that once we enable energy awareness, the Threshold strategy can improve the energy-unaware version of allofalgorithms except Direct Delivery by up In this the the energy-unaware version all algorithms except Direct Delivery bytoup13%. to 13%. In scenario, this scenario, optimal threshold is 0.7 and the four DTN protocols perform similarly to each other. the optimal threshold is 0.7 and the four DTN protocols perform similarly to each other.
700 600 500 400
Epidemic
300
Prophet
200
SprayAndWait
100
DirectDelivery
0 0
0.2
0.4
0.6
0.8
1
1.2 RRE
1.4 1.6 ORRE
Threshold Figure5. 5.Packets Packetsdelivered deliveredper perday dayfor for Threshold, Threshold, RRE RRE and and ORRE ORRE strategies strategies in in pigeon pigeon scenario. scenario. Figure
We We note note that that all all protocols protocols perform perform better better than than the the Direct Direct Delivery Delivery protocol protocol for for aa threshold threshold close close to one. This is because the battery capacity of the node is greater than the daily harvested energy. to one. This is because the battery capacity of the node is greater than the daily harvested energy. Consequently, perEquation Equation(1) (1)ofofthe the Threshold strategy, nodes forward packets if they Consequently, per Threshold strategy, nodes cancan forward packets if they store store more more energy thandaily the daily harvested energy. In scenario, this scenario, nodes harvest energy during the day energy than the harvested energy. In this nodes harvest energy during the day and and forward packets to other nodes while they meet and commute within foraging areas. Similar to forward packets to other nodes while they meet and commute within foraging areas. Similar to the the flying scenario, ORRE improves strategy by to up4%. to 4%. flying fox fox scenario, ORRE improves the the RRERRE strategy by up We now evaluate latency and routing overheads of the Threshold strategy to provide more We now evaluate latency and routing overheads of the Threshold strategy to provide more details J. Sens. Actuator Netw. 2016, 5, 18 15 of 20 details on the performance of the algorithms in different scenarios. on the performance of the algorithms in different scenarios. Figure 66 shows the for Threshold in and fox Figurethe shows the Average Average latency for the the Threshold strategy inPigeon Pigeon and Flying foxscenarios. scenarios. increasing threshold past thelatency optimum leads a fall in strategy the average latency as Flying the nodes generated In pigeon scenario (a), the average latency increases as the nodes limit their participation In pigeon scenario (a), the average latency increases the nodes their participation in in data data many packets and consume all allocated energy beforeasentering the limit foraging area. forwarding, due to reserving more energy for communication with the base station. Therefore, larger forwarding, due to reserving more energy for communication with the base station. Therefore, larger We also present the overhead ratio of algorithms as shown in Figure 7. The figure indicates that thresholds lead that have hops base station. in thresholds lead to to routes routes thatthreshold have fewer fewer hopsto tothe the base station.However, However, inthe theflying flying fox scenario, in both scenarios, when increases, the overhead ratio decreases. Thisfox isscenario, because increasing the of threshold the optimum leads fall in the average as communication the nodes generated participation nodes past in data forwarding is alimited which leadslatency to less and many packets and consume all allocated energy before entering the foraging area. forwarding few packets to other nodes.
Average Latency (sec)
1200 1000 800 600 400 200 0 0
0.2
0.4
0.6
0.8
1
Threshold
1.2
1.4
1.6
RRE ORRE
(a) Figure 6. Cont.
rage Latency (sec)
1200 1000 800
Epidemic
600
Prophet
400
SprayAndWait
Aver Average Latency (sec)
400 1000 200 800 0 0
600
0.2
0.4
0.6
0.8
1
1.2
J. Sens. Actuator Netw. 2016, 5, 18 400
1.4
1.6
RRE ORRE
Threshold
16 of 21
(a)
200 0 0
0.2
0.4
0.6
Average Latency (sec) Average Latency (sec)
1200
0.8
1
1.2
1.4
1.6
RRE ORRE
Threshold
1000
(a)
800
Epidemic Prophet
600
SprayAndWait
400 1200
DirectDelivery
200 1000 0 800
0
0.2 0.4 0.6 0.8
600
1
Threshold
Epidemic
1.2 1.4 1.6
RRE ORRE
Prophet SprayAndWait
400
DirectDelivery
200
(b)
0
Figure 6. 6. Average Average latency latency for Threshold, Threshold, RRE, for 0 0.2 0.4 0.6 0.8 1 ORRE 1.2 1.4 1.6pigeon Figure for RRE, ORRE for (a) (a) pigeon and and (b) (b) flying flying fox fox scenarios. scenarios. Threshold
RRE ORRE
Overhead Ratio
Overhead Ratio
We also present the overhead ratio of algorithms as shown in Figure 7. The figure indicates that in both scenarios, when threshold increases, the overhead ratio decreases. This is because participation (b) 7.00 of nodes in data forwarding is limited which leads to less communication and forwarding few packets 6.00 to otherFigure nodes. 6. Average latency for Threshold, RRE, ORRE for (a) pigeon and (b) flying fox scenarios. 5.00 4.00 3.00 2.00 7.00 1.00 6.00 0.00 5.00 0 4.00
0.2
0.4
0.6
0.8
1
Threshold
1.2 RRE
ORRE ORRE
1.4
1.6
1.2 RRE
ORRE ORRE
1.4
1.6
3.00
(a)
2.00 1.00 0.00 0
0.2
0.4
0.6
0.8
1
Threshold J. Sens. Actuator Netw. 2016, 5, 18
16 of 20
(a)
7.00 Overhead Ratio
6.00 5.00 4.00
Epidemic
3.00
Prophet
2.00
SprayAndWait
1.00
DirectDelivery
0.00 0
0.2 0.4 0.6 0.8
1
Threshold
1.2 1.4 1.6 RRE ORRE
(b) Figure RRE, ORRE ORRE for for (a) (a) pigeon pigeon and and (b) (b) flying flying fox fox scenarios. scenarios. Figure 7. 7. Overhead Overhead ratio ratio for for Threshold, Threshold, RRE,
4.7. Parameter Variation The use of the pigeon (feeding during energy harvesting) and flying fox (feeding at night, harvesting during the day) models shows the resilience and applicability of the method for two different scenarios. Some other variations of the system parameters were also tested to demonstrate that the method works for different scenarios. In Figure 8, the number of mobile nodes is changed from 20 to 10, and it is seen that the
0.00 0
0.2 0.4 0.6 0.8
1
Threshold
1.2 1.4 1.6 RRE ORRE
(b)
J. Sens. Actuator Netw. 2016, 5, 18
17 of 21
Figure 7. Overhead ratio for Threshold, RRE, ORRE for (a) pigeon and (b) flying fox scenarios.
4.7. Parameter Parameter Variation Variation 4.7.
Packets Delivered (per day)
The use during energy energy harvesting) harvesting) and and flying flying fox fox (feeding (feeding at at night, night, The use of of the the pigeon pigeon (feeding (feeding during harvesting during the day) models shows the resilience and applicability of the method for harvesting during the day) models shows the resilience and applicability of the method for two two different scenarios. Some other variations of the system parameters were also tested to demonstrate different scenarios. Some other variations of the system parameters were also tested to demonstrate that the that the method method works works for for different different scenarios. scenarios. In Figure 8, the number of mobile mobile nodes nodes is is changed changed from from 20 20 to to 10, 10, and and it it is is seen In Figure 8, the number of seen that that the the performance is largely the same as in Figures 5 and 6 (except only half as many total packets). performance is largely the same as in Figures 5 and 6 (except only half as many total packets).
700 600 500 400 300 200 100 0
Epidemic Prophet SprayAndWait DirectDelivery 0
0.2 0.4 0.6 0.8 1 RRE 1.2 1.4 1.6 ORRE Threshold
Packets Delivered (per day)
(a)
700 600 500 400
Epidemic
300
Prophet
200
SprayAndWait
100
DirectDelivery
0 0
0.2 0.4 0.6 0.8 1 Threshold
1.2 1.6 RRE 1.4ORRE
(b) Figure (b) flying flying fox fox scenarios. scenarios. Figure 8. 8. Packets Packets delivered delivered for for ten ten nodes nodes for for (a) (a) pigeon pigeon and and (b)
Similarly, the fraction of roosting camps with base stations is changed from two to three (out of five), with the original 20 nodes. Figure 9 shows these results, and the new algorithms still work well for both (a) pigeon and (b) flying fox scenarios.
J. Sens. Actuator Netw. 2016, 5, 18
17 of 20
Similarly, the fraction of roosting camps with base stations is changed from two to three (out of J. Sens.five), Actuator Netw. 5, 1820 nodes. Figure 9 shows these results, and the new algorithms still work well 18 of 21 with the 2016, original
Packets Delivered (per day)
for both (a) pigeon and (b) flying fox scenarios.
700 600 500 400 300 200 100 0
Epidemic Prophet SprayAndWait DirectDelivery 0
0.2 0.4 0.6 0.8 1 RRE 1.2 1.4 1.6 ORRE Threshold
Packets Delivered (per day)
(a)
700 600 500 400
Epidemic
300
Prophet
200
SprayAndWait
100
DirectDelivery
0 0 0.2 0.4 0.6 0.8 1 1.2 1.4 1.6 RRE ORRE Threshold (b)
Figure 9. Packets delivered for 20 nodes and 3 base stations for (a) pigeon and (b) flying fox scenarios.
Figure 9. Packets delivered for 20 nodes and 3 base stations for (a) pigeon and (b) flying fox scenarios.
4.8. Error Analysis
4.8. Error Analysis
To ensure that the results are not unduly affected by random events in each trial, the simulations
To ensure that the results areresults not unduly affected random events in eachover trial,three the simulations were run three times, and the in Figures 4 to by 9 show the average results runs of daystimes, each. Figure 10 results shows the average 4–9 and show error bars of ±1 standard for runs the trials. were seven run three and the in Figures the average resultsdeviation over three of seven This shows there is only a small variation from trial to trial, and so error bars are not shown in the This days each. Figure 10 shows the average and error bars of ±1 standard deviation for the trials. earlier results for clarity. shows there is only a small variation from trial to trial, and so error bars are not shown in the earlier complex random motions and interactions of the mobile nodes mean that it is not possible results forThe clarity. 20 results, except in a few cases. For the Direct Delivery method, there18isofno node-to-node forwarding so the delivery rate is just the percentage of animals that return to camps with a base station. 700For Figures 5 and 6, Direct Delivery correctly delivers 50% (360/720) of packets 600 per day. During testing, some degenerate scenarios were tried (very large energy, all flying foxes in the same feeding500 area, epidemic routing) and these achieved close to 100% delivery. These two extreme analytical400 comparisons provide confidence in the correctness of the simulation results. 300 RRE 200 ORRE 100
Packets Delivered (per day
J.toSens. Actuator Netw. 2016, 5, 18 analytically calculate the
0
Best Threshold
Packets Delivered (per day
(a)
700 600 500 400 300 200 100 0
Figure 10. Cont.
RRE ORRE Best threshold
Packets D
ORRE
100 0
Best Threshold
J. Sens. Actuator Netw. 2016, 5, 18
19 of 21
Packets Delivered (per day
(a)
700 600 500 400 300 200 100 0
RRE ORRE Best threshold
(b) Figure 10. Variability of results across different simulation runs for (a) pigeon and (b) flying fox
Figure 10. Variability of results across different simulation runs for (a) pigeon and (b) flying scenarios. fox scenarios.
4.9. Comparison with Other Approaches
The complex random interactions of the mobile nodes mean that it is not to Section 2.3 above motions presents and a number of other approaches for energy efficiency in possible DTN analytically calculateThe thepapers results, except in a few cases. For the only Direct method,ofthere communications. describing these algorithms present theDelivery general principles their is no node-to-node theable delivery ratesufficient is just the percentage of animals return to camps operation, forwarding and we weresonot to obtain details of the algorithms to that perform a direct comparison. However, make the following qualitative comparison. with quantitative a base station. For Figures 5 andwe 6, can Direct Delivery correctly delivers 50% (360/720) of packets The other approaches all seek to reduce the were overall energy byall making per day. During testing, some degenerate scenarios tried (veryconsumption large energy, flying choices foxes in the about the cost of forwarding, and only choose energy-efficient message transfers. same feeding area, epidemic routing) and these achieved close to 100% delivery. TheseHowever, two extreme forwarding decisions are not based on the instantaneous amount of available energy in scenarios analytical comparisons provide confidence in the correctness of the simulation results. where energy is depleted and then replaced, so they cannot change their behaviour depending on whether energy scarceApproaches or abundant. They cannot adjust their behaviour in the presence of energy 4.9. Comparison withisOther harvesting, which replenishes energy reserves. The work above shows that such decisions can Section 2.3 above presents improve performance metrics. a number of other approaches for energy efficiency in DTN The technique here does not replace these otherpresent methods; it isthe a general approach to communications. Theproposed papers describing these algorithms only general principles of forwarding which message (except of to the a gateway) whento energy is low. their any operation, andmethod we were not stops able to obtainforwarding sufficient details algorithms perform a direct Indeed, this new method could be we usefully combined with many qualitative of the other methods in Section 2.3. quantitative comparison. However, can make the following comparison.
The other approaches all seek to reduce the overall energy consumption by making choices about 5. Conclusions the cost of forwarding, and only choose energy-efficient message transfers. However, forwarding investigated the Delay Tolerant Networking (DTN)energy routinginprotocols forwhere wildlife decisionsOur are study not based on the instantaneous amount of available scenarios energy tracking applications within two different scenarios (flying fox and pigeon scenarios). Animal motion is depleted and then replaced, so they cannot change their behaviour depending on whether energy traces from the flying foxes tracking application are used for both scenarios with different activity is scarce or abundant. They cannot adjust their behaviour in the presence of energy harvesting, patterns. Three energy-aware strategies are proposed based on the available energy resources to which replenishes energy reserves. The work above shows that such decisions can improve make forwarding decisions. The three proposed strategies have been evaluated against the performance metrics. performance of DTN routing protocols in terms of appropriate utilization of residual energy. The technique proposed here does not replace these other methods; it is a general approach to any forwarding method which stops message forwarding (except to a gateway) when energy is low. Indeed, this new method could be usefully combined with many of the other methods in Section 2.3. 5. Conclusions Our study investigated the Delay Tolerant Networking (DTN) routing protocols for wildlife tracking applications within two different scenarios (flying fox and pigeon scenarios). Animal motion traces from the flying foxes tracking application are used for both scenarios with different activity patterns. Three energy-aware strategies are proposed based on the available energy resources to make forwarding decisions. The three proposed strategies have been evaluated against the performance of DTN routing protocols in terms of appropriate utilization of residual energy. Our results show that the proposed energy-aware strategies can improve data yields of the Spray and Wait, Epidemic and Prophet routing protocols by up to 13% in both scenarios. Furthermore, the Optimized Remaining Required Energy (ORRE) strategy can automatically set the best threshold for current conditions, while offering similar performance as the predetermined Threshold strategy.
J. Sens. Actuator Netw. 2016, 5, 18
20 of 21
A limitation of our work is that it has tested one particular mobility pattern for evaluating the protocols. An interesting direction for future work is to test our approach on different mobility patterns to observe the effect of the mobility patterns on the protocol performance. Acknowledgments: Many thanks go to Kun Zhao for his valuable input to the flying foxes monitoring system. The authors also thank Ahmad El Shoghri and our other colleagues and staff members at CSIRO for their support. Author Contributions: M.K. conceived, designed, and executed the experiments and analyzed the data, and wrote the first draft of the paper; R.J., B.K., N.B. and V.L. provided supervision, advice and critical review of the experimental design and analysis, and undertook significant review and editing of the paper. Conflicts of Interest: The authors declare no conflict of interest.
References 1. 2. 3. 4. 5.
6.
7. 8.
9.
10.
11.
12.
13.
14. 15.
Corke, P.; Wark, T.; Jurdak, R.; Hu, W.; Valencia, P.; Moore, D. Environmental wireless sensor networks. Proc. IEEE 2010, 98, 1903–1917. [CrossRef] Anastasi, G.; Conti, M.; Di Francesco, M.; Passarella, A. Energy conservation in wireless sensor networks: A survey. Ad Hoc Netw. 2009, 7, 537–568. [CrossRef] Khabbaz, M.J.; Assi, C.M.; Fawaz, W.F. Disruption-tolerant networking: A comprehensive survey on recent developments and persisting challenges. IEEE Commun. Surv. Tutor. 2012, 14, 607–640. [CrossRef] Namita Mehta, N.M.; Mehul Shah, M.S. Performance of Efficient Routing Protocol in Delay Tolerant Network: A Comparative Survey. Int. J. Future Gener. Commun. Netw. 2014, 7, 151–158. [CrossRef] Cerf, V.; Burleigh, S.; Hooke, A.; Torgerson, L.; Durst, R.; Scott, K.; Fall, K.; Weiss, H. Delay-Tolerant Networking Architecture. RFC 4838. April 2007. Available online: https://tools.ietf.org/html/rfc4838 (accessed on 30 November 2016). Sommer, P.; Kusy, B.; Valencia, P.; Dungavell, R.; Jurdak, R. Delay-Tolerant Networking for Long-Term Animal Tracking. accepted for IEEE Internet Computing. arXiv preprint. Available online: https://arxiv.org/ abs/1506.01792 (accessed on 30 November 2016). Keranen, A. Opportunistic Network Environment Simulator; Special Assignment report; Helsinki University of Technology, Department of Communications and Networking: Helsinki, Finland, 2008. Kaviani, M.; Kusy, B.; Jurdak, R.; Bergmann, N.; Zhao, K.; Liu, V. Delay Tolerant Routing Protocols for Energy-Neutral Animal Tracking. In Proceedings of the 3rd International Workshop on Energy Harvesting & Energy Neutral Sensing Systems, Seoul, Korea, 1 November 2015; pp. 9–14. Jones, E.P.; Ward, P.A. Routing Strategies for Delay-Tolerant Networks. 2006. Available online: http://citeseerx.ist.psu.edu/viewdoc/download?doi=10.1.1.119.6510&rep=rep1&type=pdf (accessed on 30 November 2016). Shen, J.; Moh, S.; Chung, I. Routing protocols in delay tolerant networks: A comparative survey. In Proceedings of the 23rd International Technical Conference on Circuits/Systems, Computers and Communications (ITC-CSCC 2008), Shimonoseki City, Japan, 6–9 July 2008. Manam, V.; Gurav, G.; Murthy, C. Performance modeling of message-driven based energy-efficient routing in delay-tolerant networks with individual node selfishness. In Proceedings of the Fifth International Conference on Communication Systems and Networks (COMSNETS), Bangalore, India, 7–10 January 2013; pp. 1–6. Liu, M.; Yang, Y.; Qin, Z. A survey of routing protocols and simulations in delay-tolerant networks. In Proceedings of the International Conference on Wireless Algorithms, Systems, and Applications, Chengdu, China, 11–13 August 2011; pp. 243–253. Spyropoulos, T.; Psounis, K.; Raghavendra, C.S. Single-copy routing in intermittently connected mobile networks. In Proceedings of the Conference on Sensor and Ad Hoc Communications and Networks (SECON 2004), Santa Clara, CA, USA, 4–7 October 2004; pp. 235–244. Vahdat, A.; Becker, D. Epidemic Routing for Partially Connected Ad Hoc Networks; Technical Report CS-200006; Duke University: Durham, NC, USA, 2000. Spyropoulos, T.; Psounis, K.; Raghavendra, C.S. Spray and wait: An efficient routing scheme for intermittently connected mobile networks. In Proceedings of the 2005 ACM SIGCOMM Workshop on Delay-Tolerant Networking, Philadelphia, PA, USA, 22–26 August 2005; pp. 252–259.
J. Sens. Actuator Netw. 2016, 5, 18
16. 17.
18. 19.
20.
21. 22. 23.
24.
25.
26.
27. 28. 29.
30.
31.
32.
21 of 21
Cao, Y.; Sun, Z. Routing in delay/disruption tolerant networks: A taxonomy, survey and challenges. IEEE Commun. Surv. Tutor. 2013, 15, 654–677. [CrossRef] Mehto, A.; Chawla, M. Comparing Delay Tolerant Network Routing Protocols for Optimizing L-Copies in Spray and Wait Routing for Minimum Delay. In Proceedings of the Conference on Advances in Communication and Control Systems, Gwalior, India, 6–8 April 2013. Lindgren, A.; Doria, A.; Schelén, O. Probabilistic routing in intermittently connected networks. ACM SIGMOBILE Mob. Comput. Commun. Rev. 2003, 7, 19–20. [CrossRef] Socievole, A.; Marano, S. Evaluating the impact of energy consumption on routing performance in delay tolerant networks. In Proceedings of the Wireless Communications and Mobile Computing Conference (IWCMC), Limassol, Cyprus, 27–31 August 2012; pp. 481–486. Lindgren, A.; Doria, A.; Davies, E.; Grasic, S. Probabilistic Routing Protocol for Intermittently Connected Networks. RFC 6693. August 2012. Available online: https://tools.ietf.org/html/rfc6693 (accessed on 30 November 2016). Desai, C.B.; Pandya, M.V.N.; Dolia, P.M. Comparative analysis of different routing protocols in delay tolerant networks. Int. J. Comput. Sci. Eng. 2013, 4, 249–253. Cabacas, R.A.; Nakamura, H.; Ra, I.-H. Energy Consumption Analysis of Delay Tolerant Network Routing Protocols. Int. J. Softw. Eng. Its Appl. 2014, 8, 1–10. Chaithanya Manam, V.; Mahendran, V.; Siva Ram Murthy, C. Message-driven based energy-efficient routing in heterogeneous delay-tolerant networks. In Proceedings of the 1st ACM Workshop on High Performance Mobile Opportunistic Systems, Paphos, Cyprus, 21–25 October 2012; pp. 39–46. Sghaier, N.; Augustin, B.; Mellouk, A. On enhancing network-lifetime in opportunistic Wireless Sensor Networks. In Proceedings of the Wireless Communications and Networking Conference (WCNC), Istanbul, Turkey, 6–9 April 2014; pp. 2617–2622. Cabacas, R.; Ra, I.-H. A novel energy-aware priority transmission scheme based on context-metric queuing for delay tolerant networks. In Proceedings of the International Conference on Information Science, Electronics and Electrical Engineering (ISEEE), Sapporo, Japan, 26–28 April 2014; pp. 1095–1099. De Rango, F.; Amelio, S.; Fazio, P. Enhancements of epidemic routing in delay tolerant networks from an energy perspective. In Proceedings of the 9th International Wireless Communications and Mobile Computing Conference (IWCMC), Sardinia, Italy, 1–5 July 2013; pp. 731–735. Keränen, A.; Ott, J.; Kärkkäinen, T. The ONE simulator for DTN protocol evaluation. In Proceedings of the 2nd International Conference on Simulation Tools and Techniques, Rome, Italy, 2–6 March 2009; p. 55. Silva, D.R.; Costa, A.; Macedo, J. Energy impact analysis on DTN routing protocols. In Proceedings of the ExtremeCom, Zurich, Switzerland, 10–14 March 2012; pp. 1–6. Jurdak, R.; Kusy, B.; Sommer, P.; Kottege, N.; Crossman, C.; McKeown, A.; Westcott, D. Camazotz: Multimodal Activity-based GPS Sampling. In Proceedings of the 12th International Conference on Information Processing in Sensor Networks (IPSN), Philadelphia, PA, USA, 8–11 April 2013. Sommer, P.; Kusy, B.; Jurdak, R.; Kottege, N.; Liu, J.; Zhao, K.; McKeown, A.; Westcott, D. From the lab into the wild: Design and deployment methods for multi-modal tracking platforms. Pervasive Mob. Comput. 2016, 30, 1–17. [CrossRef] Sommer, P.; Liu, J.; Zhao, K.; Kusy, B.; Jurdak, R.; McKeown, A.; Westcott, D. Information Bang for the Energy Buck: Towards Energy-and Mobility-Aware Tracking. In Proceedings of the 2016 International Conference on Embedded Wireless Systems and Networks, Graz, Austria, 15–17 February 2016; pp. 193–204. Gnawali, O.; Fonseca, R.; Jamieson, K.; Moss, D.; Levis, P. Collection tree protocol. In Proceedings of the 7th ACM Conference on Embedded Networked Sensor Systems, Berkeley, CA, USA, 4–6 November 2009; pp. 1–14. © 2016 by the authors; licensee MDPI, Basel, Switzerland. This article is an open access article distributed under the terms and conditions of the Creative Commons Attribution (CC-BY) license (http://creativecommons.org/licenses/by/4.0/).