Sep 19, 2011 - tion performance of ICA via clustering evaluation, and applied the method ... paper proposed a novel approach for source separation of mixed.
RESEARCH ARTICLE Copyright © 2011 American Scientific Publishers All rights reserved Printed in the United States of America
Advanced Science Letters
Vol. 4, 1951–1956, 2011
Enhance the Separation Performance of ICA via Clustering Evaluation and Its Applications Wei Cheng∗ , Zhousuo Zhang, and Zhengjia He State Key Laboratory for Manufacturing Systems Engineering, Xi’an Jiaotong University, Xi’an 710049, P. R. China Traditional independent component analysis may produce different results in the repeated calculations for their statistical characteristics, and thus they are unreliable and unstable. This paper introduces a novel ICA algorithm which enhances the separation performance by clustering evaluation. Firstly, the improved Deliveredand bystability Ingenta to: ICA algorithm runs a single ICA algorithm for several times with the different initial parameters; secondly, the Xi?an Jiaotong University separated components produced are clustered according to their relevance; lastly, the best separated comIP : 121.52.160.18 ponents are selected as the optimal results by clustering evaluation. The effectiveness of the improved ICA Mon, 19 Sep 2011 signals. 10:12:46 algorithm is validated in the simulation by typical mechanical The proposed method is also applied to extract the effective information of observed signals on the bulkhead of a ship, and the results show that most of the important information is well extracted. This research provides a novel approach for vibration reduction and control of ships.
Keywords: Independent Component Analysis, Clustering Evaluation, Improved ICA Algorithm, Source Separation, Vibration Reduction and Control.
1. INTRODUCTION Independent component analysis (ICA) is a statistical and computational technique for revealing hidden factors that underlies sets of random variables, measurements, or signals. Now ICA is widely used in the analysis of multidimensional data, such as feature extraction of brain imaging,1–3 image feature extraction and recognition,4� 5 biological signal analysis,6� 7 fault feature extraction,8 astronomical data analysis,9 and data compression.10 However, because it is a stochastic signal processing method and the measured signals always have finite sample size, an important problem of most ICA algorithms is that the results may be different in repeated calculation, and thus the results cannot be trusted. This paper introduced a novel method that enhance the separation performance of ICA via clustering evaluation, and applied the method to analyze the mechanical vibration signals of a ship. For any statistical method, it is necessary to analyze the statistical reliability of the results. It has been proved that finite sample size will induce statistical errors in the estimation,11 and this problem was solved using bootstrapping strategy.12 Typical ICA methods such as Fast ICA13 and natural gradient algorithms separate the multidimensional data by minimizing or maximizing of an objective function, such as likelihood,14� 15 mutual information,16 or negentropy.17 However, all these algorithms have the problem of uncertainty results. To enhance the separation performance and the stability of ICA ∗
Author to whom correspondence should be addressed.
Adv. Sci. Lett. Vol. 4, No. 6/7, 2011
algorithms, many works have been devoted to the theoretical model and computing method. One of the promising methods for enhancing the stability is to run a single ICA algorithm for many times, and produce each independent component for a certain number, and then evaluate these components by clustering evaluation method. This paper detailed analyzes a clustering evaluation method based on multidimensional scaling (MDS) to measure the dissimilarities between different signals, and at last visualize the clustering results with the nonlinear 2-D projection. Vibration and noise control is very important to large-scale equipments especially for warships and submarines. Due to the transmission influences of ship hulls and nonlinear mixing of source signals, it is a very challenging work to extract the effective information of sources from the vibration signals on the bulkhead. Many works has been devoted to transmission characteristics of structures, such as beams,18 girders,19 casings20 and shells.21 And some works dedicated to the signal processing method to extract the features. However, all these methods did not extract the complete effective information of vibration sources. Aiming at extracting complete effective information, this paper proposed a novel approach for source separation of mixed signals on the bulkhead, and thus the effective information can be extracted and the sources can be online identified and actively controlled. This paper mainly focuses on vibration reduction and control based on source separation. Firstly, the basic theory of ICA and an improved ICA algorithm is introduced; secondly, the sepa-
1936-6612/2011/4/1951/006
doi:10.1166/asl.2011.1376
1951
RESEARCH ARTICLE
Adv. Sci. Lett. 4, 1951–1956, 2011
ration performance is validated by typical mechanical signals; lastly, the improved ICA algorithm is applied to source separation of vibration signals of a ship, and the separated components are further analyzed by correlation analysis and mark tracking method.
START
Input mixed signals X
X = Meaning (X)
2. INDEPENDENT COMPONENT ANALYSIS 2.1. Basic Theory of ICA Assume that n sources S = �s1 � s2 � � � � � sn � exist at the same time, and m mixed signals X = �x1 � x2 � � � � � xm � which are composed of these sources are obtained in different places. Thus each mixed signal can be described as: xi =
n �
aij sj + ni
i = 1� 2� � � � � n� j = 1� � � � � m
Z = Whitening (X)
Set the number m of ICs extracted
(1)
Choose initialization vector ωp randomly
(2)
Updating ωp = E{zg(ωpz)} – E{g′(ωpz)}
i=1
yi =
n �
�ij xj =
i=1
n �
�ij aij sj
T
T
i=1
where yi is the independent component, and � is the separating matrix. Delivered by 2.2. Separation Criterion H �s� = −
p−1
� p�s� lg p�s� ds
Ng�s� = H �sGauss � − H �s�
(4)
Ng�s� ∝ E�G�s�� − E�G�sgauss ��
2
(5)
If p ≤ m Extract the IC, then:p = p + 1
where H �•� is an entropy function; Ng�•� is a negentropy function; E�•� is a mean function; and G�•� is a nonlinear function. Generally, 1 lg cosh�au� a
(6)
G�u� = − exp�−u2 /2�
(7)
G�u� =
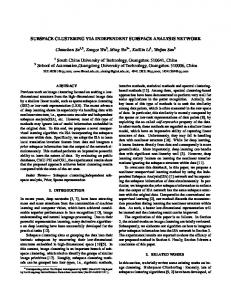
2.3. Enhance the Separation Performance via Clustering In essential, most ICA algorithms such as Fast ICA are statistical. The framework of Fast ICA is shown in Figure 1. Therefore, their results may be different in repeated executing of the algorithm, and thus the outputs of a single run of an ICA algorithm cannot be trusted.22 In this paper, the stability and effectiveness of the ICA are improved via clustering evaluation. dij = 1 − �ij
Sin l = Sex l = min � l �=l
(8)
L �
1 Sin l L l=1 Sex l
(9)
� 1 d 2 �CLl � i� j∈CLl ij
(10)
IR =
� � 1 d �CLl ��CL�l � i∈CLl i∈CL� ij
(11)
l
where �ij is correlation coefficient between signal i and signal j; dij is a dissimilarity coefficient between signal i and signal j; IR is a cluster validity index; CL is a set of all the components; and l is the serial number of the components. 1952
T
∑ (ωpωj)ωj Ingenta to:Orthogonalization ωp = ωp − j=1 Xi?an Jiaotong University If ωp does not converge IP : 121.52.160.18 ω Normalization ω = ω / Mon, 19 Sep p p p (3) 2011 10:12:46
End Fig. 1.
Framework of fast ICA algorithm.
2.4. Waveform Correlation Coefficient �sy �n s�k�y�k� �sy = � �n k=1 �n 2 �k� 2 s k=1 k=1 y �k�
(12)
where k is the data sequence.
3. SIMULATION EXPERIMENT In the simulation experiment, there are four source signals. Three of them are typical modulated signals, and the other one is the white noise. The generation functions of these sources are as Eq. (13), and the mixing matrix A is obtained randomly. The data length of source signals is 1000, and the step is 1.0.
S�t� =
⎧ s1 �t� = N�t� ⎪ ⎪ ⎪ ⎪ ⎪ ⎪ ⎪ ⎨s �t� = sin�0�2t� cos�15t� + sin�2t� 2
⎪ ⎪ s3 �t� = sin�0�3t� sin�5t + sin t� ⎪ ⎪ ⎪ ⎪ ⎪ ⎩ s4 �t� = sin�0�3t sin�0�5t�� ⎡ ⎤ 0�65 0�75 0�65 0�60 ⎢ ⎥ ⎢ 0�95 0�70 0�75 0�85 ⎥ ⎥ A=⎢ ⎢ ⎥ ⎣ 0�28 0�40 0�80 0�32 ⎦ 0�90
0�60
0�52
0�95
(13)
RESEARCH ARTICLE
Adv. Sci. Lett. 4, 1951–1956, 2011
5
5
0
0 –5
–5 0.5
1.0
1.5
2.0
5
0
0
–2 0
0.5
1.0
1.5
2.0
1
Amplitude
Amplitude
0 2
–5 5
0
0.5
1.0
1.5
–5
2.0
0.5
1.0
1.5
2.0
0
0.5
1.0
1.5
2.0
0
0.5
1.0
1.5
2.0
0
0.5
1.0
1.5
2.0
0
0 –1
0
5
1
0
0 –1 0
0.5
1.0
1.5
–5
2.0
Time/s Fig. 2.
Time/s
Waveforms of the source signals.
Fig. 4.
Waveforms separated by fast ICA.
Amplitude
5 The waveforms of source signals are shown in Figure 2; the mixed signals are generated by the mixing matrix A and the 0 to: source signals S�t�, and their waveforms are shownDelivered in Figure 3. by Ingenta –5 Jiaotong University 0 0.5 1.0 1.5 2.0 The mixed signals are respectively separated by Xi?an Fast ICA and 5 : 121.52.160.18 the proposed ICA algorithm, and the waveforms of the IP separated 0 Sep 2011 10:12:46 components are respectively shown in Figures 4 Mon, and 5. It19 should be mentioned that Figure 4 is one of the inaccurate results of –5 0 0.5 1.0 1.5 2.0 Fast ICA. 5 From Table I, Figures 4 and 5, it can be clearly seen that 0 the waveforms separated by Fast ICA are complex, and the –5 effective information is not well extracted. This is because Fast 0 0.5 1.0 1.5 2.0 2 ICA is a statistical signal processing method, and the contrast function of Fast ICA does not always converge to the same 0 point. While the correlation coefficients between components –2 separated by the improved ICA algorithm and respective sources 0 0.5 1.0 1.5 2.0 are all more than 0.98, which means that the effective inforTime/s mation is well extracted. The 2D CCA projection of clustering Fig. 5. Waveforms separated by the proposed ICA. in Figure 6 clearly shows that all the components in the same cluster have very high relevance, and the components in the selected by clustering evaluation method, and it is proven in different clusters have low relevance, which means the sources Figure 5 that all the optimal components are credible. are independent; some components of clusters 2, 3 and 4 have high relevance for a single run, which means these components are unreliable. However, the optimal components can be well 4. APPLICATIONS 5 0 –5
Amplitude
5
0
0.5
1.0
1.5
2.0
0
0.5
1.0
1.5
2.0
0
0.5
1.0
1.5
2.0
0
0.5
1.0
1.5
2.0
0 –5 2 0 –2 5
Warships and submarines attacked by underwater weapons are mainly identified and locked by radiated noise, therefore, it is essential to identify the vibration sources so as to actively control over the vibration and radiated noise. In this paper, the improved ICA algorithm is applied to extract the source information from the mixed signals of a ship’s bulkhead, and the ship has two diesel engines which are generally seen as the main vibration sources. The sample frequency is 16384 Hz, and data length is 16384. The test diagram of the ship is shown in Figure 7. The waveforms of the observed signals are shown in Figure 8. It can be clearly seen that there are many shocks in the waveforms, and that the waveforms of the observed signals are
0 Table I.
Waveform correlation coefficients.
–5
Time/s Fig. 3.
Waveforms of the mixed signals.
Components by fast ICA Components by the improved ICA
s1 �t�
s2 �t�
s3 �t�
s4 �t�
0.71 0.98
0.26 1.00
0.25 1.00
0.50 0.99
1953
RESEARCH ARTICLE
Adv. Sci. Lett. 4, 1951–1956, 2011
1
2
0.6 0.4 0.2 0
0.9 Single-run-component Best component 0.50