as a service, the monitoring and performance analysis of dis- ... monitoring distributed applications at runtime [2]. Network traffic analysis is one option to ...
ICSEA 2012 : The Seventh International Conference on Software Engineering Advances
Evaluating Performance of Distributed Systems With MapReduce and Network Traffic Analysis Thiago Vieira, Paulo Soares, Marco Machado Rodrigo Assad, Vinicius Garcia Federal University of Pernambuco (UFPE) – Recife, Pernambuco, Brazil {tpbv,pfas,masm,rea,vcg}@cin.ufpe.br
Abstract—Testing, monitoring and evaluation of distributed systems at runtime is a difficult effort, due the dynamicity of the environment, the large amount of data exchanged between the nodes and the difficulty of reproduce an error for debugging. Application traffic analysis is a method to evaluate distributed systems, but the ability to analyze large amount of data is a challenge. This paper proposes and evaluates the use of MapReduce programming model to deep packet inspection the application traffic of distributed systems, evaluating the effectiveness and the processing capacity of the MapReduce programming model for deep packet inspection of a JXTA distributed storage application, in order to measure performance indicators. Keywords-Measurement of Distributed Systems; MapReduce; Network Traffic Analysis; Deep Packet Inspection.
I. I NTRODUCTION With the growing of cloud computing usage and the use of distributed systems to provide infrastructure and platform as a service, the monitoring and performance analysis of distributed systems became more necessary [1]. In distributed systems development, the maintenance and administration, the detection of error causes and the analysis and the reproduction of an error are challenges and motivates efforts to the development of less intrusive mechanisms for debugging and monitoring distributed applications at runtime [2]. Network traffic analysis is one option to evaluate distributed systems performance [3], although there are limitations on capacity to process large amount of network packet in short time [3][4] and on scalability to be able to process network traffic over variations of throughput and resource demand. Simulators [5], emulators or testbeds [4][6] are also used for evaluate distributed systems, but these presents lacks for reproduce the real behaviour of a distributed system and its relation within a complex environment, such as a cloud computing environment [4][6]. An approach to process large amount of network traffic was proposed by [7]. The proposal consists in the use of MapReduce [8] programming model to parse network packets to a binary format, that can be used as input for Map and Reduce functions to process network packet flow. This proposal shows that MapReduce improves the computation time and provides fault tolerance to packet flow analysis,
Copyright (c) IARIA, 2012.
ISBN: 978-1-61208-230-1
but the use of MapReduce for deep packet inspection (DPI) and for evaluate distributed applications was not analyzed. Because of the need to evaluate the real behaviour of distributed systems at runtime, in a less intrusive way, and the need of a scalable and fault tolerant approach to process large amount of data, using commodity hardware, we propose the use of MapReduce programming model to implement a passive DPI for distributed applications. In this paper we evaluate the effectiveness of MapReduce to a DPI algorithm and its processing capacity to measure a JXTAbased application in order to extract performance indicators at runtime. The remainder of this paper is organized as follows. Section 2 describes the related works. Section 3 presents the proposed solution. Section 4 describes the experiments performed, Section 5 presents the results and the Section 6 concludes the paper and describes future works. II. R ELATED W ORKS To provide infrastructure and platform as a service in a cloud computing model, it is necessary to have available a scalable and fault-tolerant infrastructure. Thus, the use of distributed systems to obtain this requirements has been widely used [9][10][11]. The Google Inc. developed a distributed storage system [10][11] to use on its applications, which processes large amount of data and needs high availability, scalability and feseability. Amazon has its services based on Dynamo [9], which is a peer-to-peer storage system to provide high availability and eventual consistency to data storage. Other distributed technology widely used by cloud computing providers is Hadoop [12], which is an implementation of MapReduce to process data intensive tasks over a cluster. The evaluation of distributed applications is a challenge, due the cost of monitoring distributed systems and the lacks on performance measurement at runtime of large scale distributed applications. To reproduce the behaviour of a complex system in a test environment it is necessary to know each relevant parameter of the system, and recreate them in the test environment [6]. These needs are more evident in cases where faults occur only when the system is over a
705
ICSEA 2012 : The Seventh International Conference on Software Engineering Advances
high load [4], which difficult the environment reproduction and debugging. Gupta et al [6] presents a methodology and framework for large scale tests, able to obtain resources configurations and scale near of a large scale system, through the use of emulated scalable network, multiplexed virtual machines and resource dilatation. Gupta et al also shows accuracy and capacity of increase the scale and the realism on network tests, although it do not obtain the same precision of an evaluation of a real system at runtime. Large scale tests can be executed in environments near to real, using testbeds such as PlanetLab [13], which is a widely used distributed environment composed by real or virtual machines, geographically distributed over the world, through real network resources. Although a testbed uses real resources, to achieve precision on real time and data intensive simulations, it is need to know and reproduce each relevant parameter of the system, and recreate them in the simulation environment, including impacts caused by external systems. Loiseau et al [4] argues the necessity of network traffic evaluation with more granularity to complement simulations and measurements, and to better understanding the network traffic evolution and behaviour of each kind of network traffic. To apply this kind of evaluation, it is necessary devices and approaches to capture and process large amount of data, such as Metroflux [4] and DPI solutions [14], but it is still necessary scalable solutions to handle large amount of network traffic over different demands and throughput. MapReduce [8] is a programming model and a framework for processing large data sets trough data-intensive distributed computing, providing fault tolerance and high scalability to big data processing. MapReduce became an important programming model for large scale parallel systems, with applications on indexing, data mining, machine learning, and scientific simulation [15]. Although many tasks are expressible in MapReduce [8], it is necessary to know if DPI problems can be expressed in MapReduce programming model. Lee et al [16] proposes a flow analysis method using MapReduce programming model, where the network traffic is captured, converted to text, and used as input to Map functions. This work shows the improvement achieved in computation time in comparison with flow-tools, which is a flow analyses tool widely used to capture, filter and report flow traffic. The conversion time from network traffic to text may represent a relevant additional time, but it is not clear if Lee et al (2010) considered this conversion time on its evaluation and comparison with flow-tools. Lee et al [7] presents a Hadoop-based packet trace processing tool to process large amount of binary network traffic. A new input type to Hadoop was developed, the PcapInputFormat, which encapsulates the complexity of processing a captured pcap trace and to extract the packets
Copyright (c) IARIA, 2012.
ISBN: 978-1-61208-230-1
using the libpcap [17] packet capture library. Lee et al (2011) compares its proposal with CoralReef, which is a network traffic analysis tool that also relies of libpcap, and shows speedup on completion time to processing packet traces with more than 100GB. The evaluation was limited to process packet flow and extract indicators from IP, TCP and UDP, not considering deep packet inspection, which needs reassembly two or more packets to extract information. Additionally, the PcapInputFormat rely on a timestamp based heuristic for finding the first record from each block, using sliding-window, which can be a limitation on accuracy, if compared with the accuracy obtained by Tcpdump [18]. JXTA provides support to the development of peer-topeer applications, through the specification of protocols, services and communications layers. Halepovic and Deters [19] proposed a performance model, describing important indicators to evaluate throughput, scalability, services and the JXTA behaviour in different versions. Also, Halepovic and Deters highlights the performance and scalability limitations of JXTA, which can be improved by configurations, source code modifications or by new JXTA’s versions. Halepovic and Deters [20] analizes the JXTA performance in order to show the increasing cost or latency with higher workload and with concurrent requests, and they suggests more evaluations about scalability of large group of peers in direct communication. Halepovic et al [21] cites network traffic analysis as an approach to performance evaluation of JXTAbased applications, but do not adopt it, due the lack on JXTA traffic characterization. Although there is a performance models and evaluations of JXTA, there are not evaluations for the current versions and neither mechanisms to evaluate JXTA applications at runtime, being necessary a solution to measure the performance of JXTA-based applications and provides information to evaluate its behaviour over different circumstances. III. T HE S OLUTION To evaluate JXTA distributed applications through network traffic analysis it is necessary to capture and analyse the content of JXTA messages split into network packets, and be able to process large amount of network traffic in acceptable time. To achieve this, we propose the use of MapReduce, implemented by Apache Hadoop, to process JXTA network traffic, extract performance indicators over different scenarios, and provide an efficient and scalable solution for DPI using commodity hardware. The architecture of our solution is composed by four main component: the Sniffer, that captures, splits and stores network packets into Hadoop Distributed File System (HDFS); the Manager, that orchestrates the collected data, the job executions and stores the results generated; the jnetpcap-jxta [22], that converts network packets into JXTA messages; and the JXTAAnalyzer, that implements Map and Reduce functions to extract performance indicators.
706
ICSEA 2012 : The Seventh International Conference on Software Engineering Advances
Figure 1 shows the overview of the proposed architecture to capture the network traffic, through the Sniffer, split them into files, and store this files into HDFS. The Sniffer must be connected to the network where the target nodes are connected, and be able to stablish communication with the others nodes that composes the HDFS cluster. Figure 2 shows the architecture proposed to process network traffic through MapReduce functions, which are implemented by JXTAAnalyzer and deployed at each node of the Hadoop cluster, and managed by the Manager.
protocols that has its content divided into many packets to be transferred over TCP.
Figure 2.
Figure 1. Shows the overview of the architecture proposed to capture and store the network traffic
Initially, the network traffic must be captured, split and stored into HDFS. The packets are captured using Tcpdump, a widely used libpcap network traffic capture tool, and are split into files with 64 MB of size, which is the default block size of the HDFS, although this block size may be configured to different values. Files that are greater than the HDFS block size are split into blocks with size equal or smaller than the block size, and are spread among machines in the cluster. As the libpcap, used by Tcpdump, stores the network packets in binary files known as pcap files, it is necessary to avoid split this files or to provide to Hadoop an algorithm to split pcap files. Due the file split demands additional computing time and increases the complexity of the system, we adopted the split of pcap files into default HDFS block size, using the split functionality provided by Tcpdump. Thus, the network traffic is captured by Tcpdump, split and stored into local file system of the Sniffer, and periodically transferred to HDFS, which is responsible to replicate the files into the machines of the cluster. In the MapReduce programming model, the input data is split into blocks and into records, which are used as input for Map tasks. We adopt the use of whole files, with size defined by the HDFS block size, as input for each Map tasks, in order to extract information of more than one packet, differently of Lee et al [7] approach, where each Map task receives only one packet as input. With our approach it is possible reassembly TCP packets, JXTA messages and other
Copyright (c) IARIA, 2012.
ISBN: 978-1-61208-230-1
Shows the architecture proposed to process the network traffic
Once the pcap files has been stored into HDFS, an agent called Manager is responsible for selecting the files to be processed, to schedule the Map and Reduce tasks, and store the generated results into a database. Each Map function receives as input a path of a pcap file stored into HDFS, the path received for each Map task is defined by the data locality control of the Hadoop, which delegates each task to nodes that have a local replica of the data, or to nodes placed in the same rack of a replica. Then, the file is opened and each network packet is processed to extract the performance indicators and to generate as output a SortedMapWritable object, with a sorted collection of values for each performance indicator evaluated, which will be summarized by Reduce functions. One TCP packet can transport one or more JXTA message, due to window size of the buffer used by JXTA Socket to send and receive messages. Because of this, it is necessary to evaluate the full content of each TCP segment to identify all messages, instead of evaluate only the message header or signature, as is commonly done in DPI techniques and by widely used traffic analysis tools, such as Wireshark [23], which is unable to recognize all JXTA messages, because its approach do not identify when two or more messages are transported into a TCP packet. Moreover, if a message is greater than the size of the PDU in the TCP, the message is split into some TCP segments. To handle these problems, we developed a reassembly algorithm to recognize, sort and reassembly TCP segments into JXTA messages, which is described at Algorithm 1. For all TCP packet of a pcap file, is verified if it is a JXTA message or if it is part of a JXTA message that was
707
ICSEA 2012 : The Seventh International Conference on Software Engineering Advances
Algorithm 1 JxtaPerfMapper for all tcpP acket do if isJxta OR isW aitingF orP endings then parseP acket(tcpP acket) end if end for function PARSE PACKET(tcpP acket) parseM essage if isM essageP arsed then upddateSavedF lows if hasRemain then parseP acket(remainP acket) end if else saveP endingM essage lookF orM oreM essages end if end function
not fully parsed and is waiting for its complement, then a parse attempt is made, using Jnetpcap-jxta. As a TCP packet may to contain one or more JXTA message, if a message is fully parsed, then it is done another parse attempt with the content not used by the previous parse. If the content is a JXTA message and the parse is not successful, then its TCP content is stored, with its TCP flow identification as a key, and all next TCP packets that match with the flow identification will be sorted and used to try to mount a new JXTA message, until the parser is entirely successful. With these characteristics, to inspect JXTA messages it is required more effort than others cases of deep packet inspection, where the analysis is based on inspection of message header or protocol signature. To evaluate JXTA messages captured as binary network packet, we developed a parser called jnetpcap-jxta, which converts libpcap network packet into Java JXTA messages. Jnetpcap-jxta is written in Java and provides methods to convert byte arrays into JXTA messages, using an extension of JXTA default library for Java, known as JXSE. With this, we are able to parse all kind of messages defined by JXTA specification. Jnetpcap-jxta relies on JNetPcap library to support the instantiation and inspection of libpcap packets, JNetPcap was adopted due the performance to iterate over packets, the large quantity of functionalities provided to handle packet traces and due the recent update activities for this library. As showed by Figure 2, the JXTAAnalyzer is composed by Map and Reduce methods, JxtaPerfMapper and JxtaPerfReducer, to extract performance indicators from JXTA Socket communication layer, which is a communication mechanism that implements a reliable message exchange and obtains the better throughput between the communication layers
Copyright (c) IARIA, 2012.
ISBN: 978-1-61208-230-1
provided by the JXTA. Each message of a JXTA Socket is part of a Pipe that represents a connection established between the sender and receiver. In a JXTA Socket communication, two Pipes are established, one from sender to receiver and other from receiver to sender, which transports content messages and acknowledges messages, respectively. To evaluate and extract performance indicators from JXTA Socket, the messages must be sorted, grouped and linked with its respectives Pipes of content and acknowledge. The content transmitted into a JXTA Socket is split into byte array blocks and stored into a reliability message, that is sent to the destination and expects to receive an acknowledge message of its arrival. Each block that was sent or that was delivered, is queued by JXTA until the system is ready to process them. The time between the message delivery and the acknowledge be sent back is called round-trip time (RTT), this may vary according to the system load and may be used to evaluate if the system overloaded. The JxtaPerfMapper and JxtaPerfReducer evaluates the RTT of each content block transmitted over a JXTA Socket, and extracts information about the number of connection requests and message arrivals. Each Map function evaluates the packet trace to mount JXTA messages, Pipes and Sockets. The parsed JXTA messages are sorted by its sequence number and grouped by its Pipe identification, to compose the Pipes of a JXTA Socket. As soon as the messages are sorted and grouped, then the RTT is obtained, its value is associated with the respective key and written as an output of the Map function. Each Reduce function receives as input a key and a collection of values, which are respectively the indicator and its values, then generates individual files for each indicator. The implemented Map and Reduce methods can be extended to address others performance indicators, such as throughput or number of retransmissions, for this each indicator must be represented by a unique key and the collected values must be associated with its respective key. Moreover, others Map and Reduce methods can be developed to analyse others protocols and application traffics. IV. E XPERIMENTS As the two main goals of this work are to evaluate the effectiveness and the processing capacity of MapReduce to DPI in order to measure distributed applications, we performed two set of experiments for different size of data input and number of nodes in a Hadoop cluster, in order to evaluate the MapReduce scalability and completion time to DPI. We used as input a network traffic data captured from a JXTA Socket communication between a server and some clients from a distributed backup system. Two data set was captured, with size of 16 GB and 34 GB, split into 35 and 79 files, respectively. The first experiment set processes 16 GB of data and varies the number of Hadoop slave nodes between 3 and 10, the second experiment set processes 34
708
ICSEA 2012 : The Seventh International Conference on Software Engineering Advances
Nodes Time Std. Deviation MB/s (MB/s)/node
3 322.50 4.91 50.80 16.93
4 245.92 4.63 66.62 16.66
6 172.83 2.76 94.80 15.80
8 151.45 6.60 108.18 13.52
10 126.87 9.97 129.14 12.91
Nodes Time Std. Deviation MB/s (MB/s)/node
4 464.46 4.18 74.96 18.74
8 260.48 5.52 133.66 16.71
12 188.93 6.23 184.28 15.36
16 166.99 3.81 208.49 13.03
19 134.22 5.77 259.40 13.65
Table I C OMPLETION TIME TO PROCESS 16 GB SPLIT INTO 35 FILES
Table II C OMPLETION TIME TO PROCESS 34 GB SPLIT INTO 79 FILES
GB of data and varies the number of Hadoop slave nodes between 4 and 19. For each experiment set, we measure the completion time and the capacity to process pcap files, in a Hadoop cluster with different number of nodes. The experiments were executed 30 times for each number of nodes, then was measured the mean completion time and the standard deviation of the value measured. All experiments were performed at Amazon EC2, with a environment composed by slave nodes with Ubuntu Server 11.10, kernel 3.0.0-16, with 2 virtual cores composed by 2.5 EC2 Compute Units, 1.7 GB of RAM memory and 350 GB of hard disks, and one master node with Ubuntu Server 11.10, with 1 virtual core composed by 1 EC2 Compute Unit, 1.7 GB of RAM memory and 160 GB of hard disks. The Hadoop cluster was composed by one master node and many slave nodes running Hadoop library version 0.20.203 with default configuration, using 64MB as block size and with the data replicated 3 times over the HDFS. The network traffic used as input data was captured from a JXTA Socket Server receiving Socket requisitions and transferring data from 5 concurrent clients, which sends data to be stored at the server, with JXTA message content size between 64KB and 256KB. The network traffic was captured and processed, as described previously, in order to extract round-trip time, number of requisitions and the number of data sent to the server per time.
with merging and sorting of the data processed by each Map task. In small clusters, the probability of a node to have a replica of the data received as input, is greater than in large clusters. In large clusters there are more options of nodes to delegate a task, but the number of data replication limits these options to the number of nodes with a replica of the data, this limitation increases the cost to schedule tasks and distribute tasks in the cluster. In our experiment, was achieved a mean processing capacity of 259.40 MB per second, in a cluster with 19 slave nodes, processing 34 GB. For a cluster with 4 nodes was achieved a mean processing capacity of 66.62 MB/s and 74.96 MB/s to process respectively 16 GB and 34 GB of network traffic data, which indicates that the processing capacity may vary as a function of the amount of data processed and the number of files used as input data.
V. R ESULTS The results show the completion time to deep packet inspection of JXTA network traffic using MapReduce, with different input size and number of nodes in a Hadoop cluster. The Tables 1 and 2 present respectively the results of the experiment to process 16 GB and 34 GB of network traffic, showing the number of Hadoop nodes used for each experiment, the mean completion time in seconds, its standard deviation, the processing capacity achieved and the relative processing capacity per node in the cluster. The completion time decreases with the increment of number of nodes in the cluster, but not in a linear function. This conclusion is clearer when observed that the relative processing capacity per node decreases with the addition of nodes in the cluster. With the growing of the number of nodes in the cluster, increases the cost to manage the cluster, the data replication, the allocation of tasks to available nodes and the management of failures, also is increased the cost
Copyright (c) IARIA, 2012.
ISBN: 978-1-61208-230-1
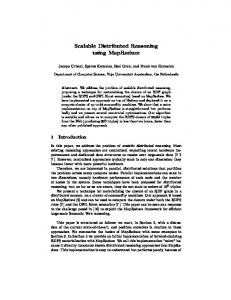
Figure 3.
Scalability to process 16 GB
Figures 3 and 4 illustrate how the addition of nodes to the Hadoop cluster reduces the mean completion time and how is the scalability of processing capacity achieved to processing 16 GB and 34 GB of network traffic data. In both graphics, the behaviour of the scalability is similar, with more significant scalability gains, through addition of nodes, in small clusters, and less significant gains with the growing of the number of nodes in the cluster, which indicates the importance of evaluating the relation between costs and benefits to addition of nodes.
709
ICSEA 2012 : The Seventh International Conference on Software Engineering Advances
VI. C ONCLUSION AND F UTURE W ORKS
Figure 4.
Scalability to process 34 GB
In the JXTA network traffic analized, was possible to use the MapReduce programming model to extract indicators of the number of connection request, number of data receiving and the round-trip time. With these data is possible to evaluate the behaviour of the system, extract information about its performance and provide a better understanding of the network traffic behaviour of a JXTA-based application. Figure 5 shows the network traffic behaviour of a JXTA Socket server receiving connection request and data from 5 concurrent clients. In this figure it is possible to observe the behaviour of the Java just-in-time compiler [24] optimizing the bytecode through its convertion into an equivalent sequence of the native code of the underlying machine, in the time when the rount-trip time increases and is normalized after the optimization of the bytecode.
To evaluate the network behaviour of distributed systems at runtime, in a less intrusive way, with high processing capacity, scalability and fault tolerance, it is necessary approaches and tools to support the development, management and monitoring of distributed applications. To address this, we proposed the use of MapReduce programming model to deep packet inspection of distributed application network traffic, and we performed experiments in order to show the effectiveness and efficiency of our proposal. We showed that MapReduce programming model can express algorithms for DPI, as the Algorithm 1, implemented to extract indicators from a JXTA network traffic, with indicators shown in Figure 5. We applied the MapReduce to DPI, using a network trace split into files with 64 MB, to avoid the cost of split the network trace into packets and also to be able to reassembly two or more packets to mount JXTA messages from packets. We analized the processing capacity and scalability achieved for different number of nodes in a Hadoop cluster, with different size of network traffic data, showing the processing capacity and scalability achieved, and the influence of the number of nodes and the data input size in the capacity processing of network traffic. We showed that using Hadoop as a MapReduce implementation, it is possible to use commodity hardware, or cloud computing services, to deep packet inspection of large amount of network traffic. With our proposal, also it is possible to measure and evaluate, at runtime and in a less intrusive way, the network traffic behaviour of distributed applications with intensive network traffic generation, making possible the use of this captured information to reproduce the behaviour of the system in a simulation environment. In future work, we will evaluate and characterize the behaviour followed by the scalability of MapReduce to DPI, evaluating the optimal size of input data for large and small clusters. Optimizations in the Hadoop environment, HDFS and JNetPcap library can be investigated to improve the approach to load pcap files, making the JNetPcap able to read files from HDFS and avoiding another copy of the data. Other future work is to investigate improvements or propose a Hadoop scheduler to cases where the input data can not be split and a full file is required as input to Map tasks. We will also perform evaluations of MapReduce to deep packet inspection of others protocols and distributed applications. VII. ACKNOWLEDGEMENTS
Figure 5.
Copyright (c) IARIA, 2012.
JXTA Socket trace analysis
ISBN: 978-1-61208-230-1
This research was supported by the National Institute of Science and Technology for Software Engineering (INES - www.ines.org.br), funded by CNPq and FACEPE, grants 573964/2008-4 and APQ-1037-1.03/08.
710
ICSEA 2012 : The Seventh International Conference on Software Engineering Advances
R EFERENCES [1] M. Armbrust, A. Fox, R. Griffith, A. D. Joseph, R. H. Katz, A. Konwinski, G. Lee, D. A. Patterson, A. Rabkin, and M. Zaharia, “Above the clouds: A berkeley view of cloud computing,” Tech. Rep., 2009. [2] M. Armbrust, A. Fox, R. Griffith, A. D. Joseph, R. Katz, A. Konwinski, G. Lee, D. Patterson, A. Rabkin, I. Stoica, and M. Zaharia, “A view of cloud computing,” Commun. ACM, vol. 53, pp. 50–58, Apr. 2010. [3] A. Callado, C. Kamienski, G. Szabo, B. Gero, J. Kelner, S. Fernandes, and D. Sadok, “A survey on internet traffic identification,” Communications Surveys Tutorials, IEEE, vol. 11, no. 3, pp. 37 –52, quarter 2009. [4] P. Loiseau, P. Goncalves, R. Guillier, M. Imbert, Y. Kodama, and P.-B. Primet, “Metroflux: A high performance system for analysing flow at very fine-grain,” in Testbeds and Research Infrastructures for the Development of Networks Communities and Workshops, 2009. TridentCom 2009. 5th International Conference on, april 2009, pp. 1 –9.
[13] B. Chun, D. Culler, T. Roscoe, A. Bavier, L. Peterson, M. Wawrzoniak, and M. Bowman, “Planetlab: an overlay testbed for broad-coverage services,” SIGCOMM Comput. Commun. Rev., vol. 33, pp. 3–12, July 2003. [14] S. Fernandes, R. Antonello, T. Lacerda, A. Santos, D. Sadok, and T. Westholm, “Slimming down deep packet inspection systems,” in INFOCOM Workshops 2009, IEEE, april 2009, pp. 1 –6. [15] M. Zaharia, A. Konwinski, A. D. Joseph, R. Katz, and I. Stoica, “Improving mapreduce performance in heterogeneous environments,” in Proceedings of the 8th USENIX conference on Operating systems design and implementation, ser. OSDI’08. Berkeley, CA, USA: USENIX Association, 2008, pp. 29–42. [Online]. Available: http://dl.acm.org/citation.cfm?id=1855741.1855744 [16] Y. Lee, W. Kang, and H. Son, “An internet traffic analysis method with mapreduce,” in Network Operations and Management Symposium Workshops (NOMS Wksps), 2010 IEEE/IFIP, april 2010, pp. 357 –361.
[5] D. Paul, “Jxta-sim2: A simulator for the core jxta protocols,” Master’s thesis, University of Dublin, Ireland, 2010.
[17] V. Jacobson, C. Leres, and S. McCanne, “libpcap,” http://www.tcpdump.org/, 1994.
[6] D. Gupta, K. V. Vishwanath, M. McNett, A. Vahdat, K. Yocum, A. Snoeren, and G. M. Voelker, “Diecast: Testing distributed systems with an accurate scale model,” ACM Trans. Comput. Syst., vol. 29, pp. 4:1–4:48, May 2011.
[18] “Tcpdump,” http://www.tcpdump.org/, [retrieved: september, 2012].
[7] Y. Lee, W. Kang, and Y. Lee, “A hadoop-based packet trace processing tool,” in Proceedings of the Third international conference on Traffic monitoring and analysis, ser. TMA’11. Berlin, Heidelberg: Springer-Verlag, 2011, pp. 51–63. [8] J. Dean and S. Ghemawat, “Mapreduce: simplified data processing on large clusters,” Commun. ACM, vol. 51, pp. 107–113, Jan. 2008. [9] G. DeCandia, D. Hastorun, M. Jampani, G. Kakulapati, A. Lakshman, A. Pilchin, S. Sivasubramanian, P. Vosshall, and W. Vogels, “Dynamo: amazon’s highly available keyvalue store,” SIGOPS Oper. Syst. Rev., vol. 41, pp. 205–220, Oct. 2007.
[19] E. Halepovic and R. Deters, “The jxta performance model and evaluation,” Future Gener. Comput. Syst., vol. 21, pp. 377–390, March 2005. [20] E. Halepovic, R. Deters, and B. Traversat, “Jxta messaging: Analysis of feature-performance tradeoffs and implications for system design,” in On the Move to Meaningful Internet Systems 2005: CoopIS, DOA, and ODBASE, R. Meersman and Z. Tari, Eds. Springer Berlin / Heidelberg, 2005, vol. 3761, pp. 1097–1114. [21] E. Halepovic, “Performance evaluation and benchmarking of the jxta peer-to-peer platform,” 2004. [22] T. Vieira, “jnetpcap-jxta,” http://github.com/tpbvieira/jnetpcapjxta, [retrieved: september, 2012].
[10] S. Ghemawat, H. Gobioff, and S.-T. Leung, “The google file system,” SIGOPS Oper. Syst. Rev., vol. 37, pp. 29–43, Oct. 2003.
[23] “Wireshark,” http://www.wireshark.org/, [retrieved: september, 2012].
[11] F. Chang, J. Dean, S. Ghemawat, W. C. Hsieh, D. A. Wallach, M. Burrows, T. Chandra, A. Fikes, and R. E. Gruber, “Bigtable: A distributed storage system for structured data,” ACM Trans. Comput. Syst., vol. 26, pp. 4:1–4:26, June 2008.
[24] T. Suganuma, T. Ogasawara, M. Takeuchi, T. Yasue, M. Kawahito, K. Ishizaki, H. Komatsu, and T. Nakatani, “Overview of the ibm java just-in-time compiler,” IBM Systems Journal, vol. 39, no. 1, pp. 175 –193, 2000.
[12] “Hadoop,” http://hadoop.apache.org/, [retrieved: september, 2012].
Copyright (c) IARIA, 2012.
ISBN: 978-1-61208-230-1
711