Users performed significantly better using the fisheye list for drag & drop tasks, whereas no ... dimensional visual fisheye distortion for drop-down menus.
EVALUATING THE USABILITY OF 1D FISHEYE LISTS Christoph Wimmer, Martin Tomitsch, Thomas Grechenig Research Group for Industrial Software (INSO), Vienna University of Technology Wiedner Hauptstr. 76 / 2 / 2, A- 1040 Vienna, Austria
ABSTRACT Fisheye views represent a promising solution to the problem of visualizing and interacting with large amounts of data. Such lists often require tedious scrolling, which can be cumbersome for users. In a controlled experiment we compared performance and user preferences of a fisheye list and a traditional list with a scrollbar for selection and drag & drop tasks. Users performed significantly better using the fisheye list for drag & drop tasks, whereas no significant differences were found with regard to selection tasks. In terms of satisfaction, users generally preferred the fisheye list to the standard list. A folder view with alphabetically grouped items served as a baseline condition and performed best overall. KEYWORDS Fisheye views, fisheye lists, drag and drop, interaction techniques
1. INTRODUCTION Fisheye views provide a balance between the global overview of large structures and local detail within these structures. Local areas of interest are shown in great detail to make interaction with them feasible, while other areas are shown in less detail to always give an overview of the global context. Since the introduction of fisheye views in user interfaces by Furnas (1982) for providing a balance between focus and context, their applicability to various user interface design problems has been intensely examined yielding mixed results. Bederson’s (2000) fisheye menus introduced the application of a onedimensional visual fisheye distortion for drop-down menus. A preliminary study showed that users preferred fisheye menus for browsing tasks (Bederson, 2000). Hornbæk and Hertzum (2007) further explored the concept of fisheye menus and presented a user study on variations of fisheye menus. Their empirical results suggested that the hierarchical menu was superior to the fisheye menus in respect to accuracy and selection time for finding known items. However, for browsing tasks all menu types performed the same. This paper presents an evaluation of the applicability of visual fisheye distortion techniques for embodiments of lists other than drop-down menus. List widgets are often used for displaying long lists of data items, containers or folders. Thus, these widgets typically involve two types of tasks – item selection and drag & drop, whereas drop-down menus generally only facilitate selection tasks. The focus of our study was on one-dimensional lists, which are often used in applications or contexts that do not allow the employment of hierarchical structures. The goal of our user study was to evaluate the usability of a one-dimensional visual fisheye distortion for typical desktop user interfaces such as a list widget.
2. METHOD To evaluate the usability of our presented graphical user interface (GUI) widget, we compared the performance and user preference of our fisheye list implementation with a traditional list with scrollbar. The fisheye list enables task completion in one continuous movement. In contrast, in traditional lists users have to perform a series of mouse movements and clicks in order to fulfill the selection or drag & drop task. For drag & drop tasks they can use auto-scroll functionality, however, this also increases task completion time. Therefore we expected the fisheye list to perform better or at least the same as the list.
A hierarchical folder view served as a baseline condition in our experiment. Items were alphabetically grouped in folders for this view. We anticipated that the folder view would be superior to both the list and fisheye list, because the hierarchical organization of data allows faster selection and better orientation.
2.1 Participants Ten volunteer participants (3 female, 8 right-handed) were recruited for our study. The age of the participants was between 20 and 25 years (M=23.6, SD=2.0). All participants had several years of experience in computer usage and where therefore proficient in mouse usage and familiar with typical mouse interactions in a desktop computing environment. All participants had extensive experience in using lists and folder views as part of GUIs, but had no prior experience in using fisheye views.
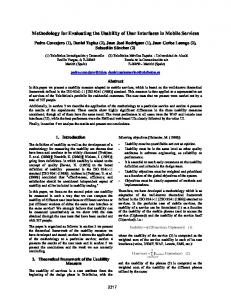
2.2. Apparatus We developed a test application using Java including all three different widgets for our experiment, namely: our own implementation of a fisheye list, a traditional list with scrollbars, and a folder view (Figure 1). In the test application the list widgets are presented on the left hand side of the window. The basic layout of our test interfaces mimics typical desktop applications such as mail clients or media players in widespread use. This design was chosen to evoke familiarity in the study participants and ensure the applicability of our test results to typical desktop applications already in practical use. The fisheye list was implemented as a list widget utilizing a one-dimensional visual fisheye distortion for visualization. Our design and implementation of a fisheye list was based on fisheye menus (Bederson, 2000), using a similar type of visualization and features such as fixed alphabetic indices. However, we omitted the focus lock mode because its usage turned out to be not intuitive for users in Bederson’s previous study. The fisheye list shows list items in the focus region at full size while shrinking list items outside the focus region. This distortion effect is applied dynamically depending on the mouse pointer position. The fisheye list displays all of the list items in a single, completely visible window of fixed size with no need to scroll. The traditional list with scrollbars offers auto-scroll functionality and the folder view provides auto-expand functionality when the focus is moved over a node. Items are grouped alphabetically in the folder view. As content for the widgets we used the titles of 100 popular websites as our data pool. The data pool is based on one of the pools used by Bederson (2000) for his fisheye menu implementation. All tests were done on a laptop computer with no peripherals attached except for a standard optical mouse as an input device. The resolution of the laptop display (13.3” widescreen) was 1280 x 800 pixels. The widgets were all equal in size (240 x 545 pixels). No additional windows were visible on the laptop screen during testing. Figure 1. Three variations of widgets used for our experiment – fisheye list, traditional list with scrollbar and folder view (left). Layout of the test interface (right)
2.3. Task and Procedure We used two typical mouse interaction tasks to evaluate our widgets: selection and drag & drop. In the beginning of both tasks a single item was displayed on the top right hand side of the widget. This item was randomly selected from our data pool. The selection tasks consisted of selecting the corresponding item from
the widget using a mouse click. The drag & drop tasks consisted of dragging the actionable item from the right into the widget on the left hand side and dropping it onto the corresponding item. We conducted the tests in a quiet environment to minimize the effect of disturbances on our study. The experiment started with an explanation of its purpose, followed by a survey of each participant to learn more about their general level of computer proficiency. After an oral introduction of the test application, the different widget types and tasks at hand, the tests started with a training session for every testing condition. Here all participants performed each task 10 times using every widget to familiarize themselves with the interface and testing procedure. After these training sessions, the participants were instructed to complete the tasks as quickly as possible without making errors. After the tests, participants were asked to fill out a posttest survey for gathering feedback about subjective user satisfaction and preferences regarding the three evaluated interface types. Subjects were asked which interface type they liked best and least. They further had to rank each of the three interface types on a 9-point semantic-differential scale according to 7 characteristics (see Table 2). Finally, a post-test interview allowed room for additional comments.
2.4. Design The experiment had two factors: widget (fisheye list, list, folder view) and task (selection, drag & drop). For each widget, participants conducted the given task 30 times. Using a within-subject design, each participant had to complete the test for all 6 testing conditions. The sequence of the testing conditions per user was counterbalanced to avoid learning effects. To measure performance and accuracy, we used task completion time and error rate respectively. Both measures represented the dependent variables in our experiment and were automatically logged by the test application. We defined errors as selection of the wrong item in the selection task as well as dropping the actionable item on the wrong item in the widget in the drag & drop task. We calculated pair-wise comparisons using a paired samples t test. User preference rankings were analyzed using Wilcoxon’s signed ranks test.
3. RESULTS We performed the experiment to look for effects of widgets on task performance. Since differences between selection and drag & drop were expected, the analysis was performed individually for each task. The mean task completion time per widget was calculated for each participant. Task completion times for erroneous tasks were discarded from this calculation.
3.1. Completion Time Based on mean task completion times per participant, we calculated the mean task completion time per widget as shown in Table 1. Pair-wise comparisons of widget showed a significant difference between task completion time of folder view and both fisheye list (t(9)=2.84, p