2 . Reinforcing bars used in the prototype building were D10. (10 mm diameter) and D19 (19 mm diameter) with yield strengths (fy) of 294.2 MPa (3,000 kgf/cm. 2. ) ...
EVALUATION OF SEISMIC PERFORMANCE OF 3 STORY ORDINARY MOMENT RESISTING CONCRETE FRAMES Sang Whan Han1, Oh-Sung Kwon 2, Li Hyung Lee 1
ABSTRACT Most low to medium rise buildings located in low to moderate seismic regions have been designed only for gravity loads. This study is to investigate the seismic behavior of moment frames designed only for gravity loads and detailed by the requirements for ordinary moment resisting concrete frames. In this study experimental test was carried out. For this purpose a three-story frame (prototype building) was designed in compliance to the minimum design and detail requirements in ACI 318 (1999) for gravity loads (1.4D+1.7L). One-third scale specimen of the prototype building was made. Quasi-static cyclic reversed loads were applied. Based on the test results the seismic behavior of the OMRCF is evaluated. Introduction Most low-rise buildings in mild seismic zone (low to moderate seismic zone) and old buildings even in high seismic zone have been designed only for gravity loads (Bracci et al. 1992). Since such buildings have less stringent details than those required in high seismic zone (e.g. strong column weak beam requirements need not be considered) the buildings may behave in brittle manner during a large earthquake event, by which story failure mechanism can be developed. Current design provisions such as ACI 318 (1999) provide three types of moment frames such as ordinary moment resisting concrete frame (OMRCF), intermediate moment resisting concrete frame (IMRCF), and special moment resisting concrete frame (SMRCF). OMRCF is the most popular type of moment frame in mild seismic zone. Details of OMRCF are different from those of IMRCF and SMRCF as follows; Strong column and weak beam requirement need not be satisfied, which causes story failure mechanism in OMRCF during a large earthquake event. Lap splices can be placed just above slabs where the plausible plastic hinge can be located during a large earthquake loading. The minimum spacing for column tie and beam stirrup of OMRCF is the largest. No transverse shear reinforcement is required at interior beam-column joints and
Г/ Д/ Е/ Ж/
//////////////////////////////////////////// 1 2
Professor, Dept. of Architectural Engineering, Hanyang University, Seoul 133-791, Korea Graduate Research Assistant, Dept. of Architectural Engineering, Hanyang University, Seoul 133-791, Korea
З/ И/
minimal reinforcement is required at exterior joints. Shear design for joints is not required. Discontinuous flexural reinforcement can be placed in a beam.
This study investigates the seismic behavior of moment frames designed only for gravity loads and detailed by the requirements of OMRCF in ACI 318 (1999). For this purpose a threestory moment frame office building was designed for gravity loads (1.4D+1.7L). Experimental test was carried out using an one-third-scale test specimen of the prototype frame.
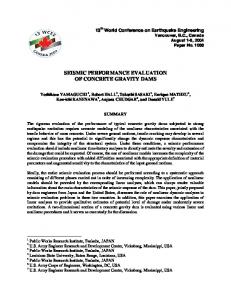
Experiments Design of Prototype Frames In this study a three-story office building is considered. The building is assumed to have 3 and 4 bays in E-W and N-S direction, respectively. The height of a story is 3.5 m and the width of each bay is 5.5 m. Total building height is 10.5 m. Fig. 1 shows the dimensions of the building. Compressive strength of concrete (f’c) and yield strength of reinforcement (fy) are assumed to be 23.54 MPa (240 kgf/cm2) and 392.4 MPa (4000 kgf/cm2), respectively. Structural analysis for member design was carried out using commercial software SAP 2000 (1997). Only gravity loads (1.4D+1.7L) were considered for design in this study. Slabs were designed using the direct design method according to the section 13.6 of ACI 318 (1999). Rebar D10 (diameter of 10 mm) is spaced at 15 cm for both positive and negative moments. Cross sections of columns and beams were assumed to be 33x33 cm and 25x50 cm, respectively, where the beam depth is measured as total depth. Beam and column details are given in Fig. 2 and 3, respectively. One-Third Scale R/C Frame Model The frame indicated by dashed line in Fig. 1(b) was reduced to a 1/3-scale model due to experimental conditions (experiment space constraint). Material size used in the 1/3 scale model specimen such as maximum size of aggregates and reinforcement was also reduced. This study attempted to make the properties of materials used for reduced model identical to those for the prototype model. Based on trial mixes from various recipes, a design mix was established for a 28 day target strength of 23.54 MPa (240 kgf/cm2), slump of 18 cm, and maximum aggregate size of 13 mm. Cylinder specimens were cured near the model specimen in the laboratory. The compressive strength of 28 day was 298 kgf/cm2. Reinforcing bars used in the prototype building were D10 (10 mm diameter) and D19 (19 mm diameter) with yield strengths (fy) of 294.2 MPa (3,000 kgf/cm2) and 392.3 MPa (4,000 kgf/cm2) and cross-sectional rebar areas (Ab) of 0.713 and 2.865 cm2, respectively. Similitude of yield force (Ab × fy) for the model reinforcement is accomplished with a scale factor of 9. In order to satisfy similitude law for both yield and ultimate strength of rebar, longitudinal reinforcement in the prototype building was substituted with D6 bar with cross-sectional areas of 0.316 cm2 in the 1/3-scale model specimen. Also φ3.3 mm wire with a cross-sectional area of 0.086 cm2 and yield strength of 345.2 MPa (3520 kgf/cm2) was used in model specimen to substitute D10 bars for lateral reinforcement in the prototype frame.
Reinforcement for slabs in the model specimen used a 5 cm square mesh composed of φ3.2 mm wire with yield strength of 460.9 MPa (4700 kgf/cm2). As materials of a 1/3-scale model specimen are almost identical with those of the prototype frame, similitude law of true replica was applied to reduce the prototype model. Properties of concrete and reinforcing steel used in the testing are given in Table 1 and Table 2, respectively. For proper modeling of gravity loads, mass similitude should be considered. Details for calculating the additional mass to satisfy the mass similitude of the floor weight is described in Han et al. (2002). Two different sizes of concrete blocks were used, whose weight is 3.4 kN and 1.7 kN, respectively. These blocks were mounted at the one sixth points of the span length of the beam to simulate the shear forces and moments at the ends of the beams induced by gravity loads. /
Loading and Test Setup /
The experimental setup of the test model specimen is shown in Fig. 4. Guide frames were placed on each side of test specimen to prevent out-of-plan movement and instability of the model. Specimen was subjected to the quasi-static reversed cyclic loading controlled by drift. Drift loads were applied at the roof by a hydraulic actuator fixed on the reaction wall and the story force induced by this drift at the roof (F3) was measured. Then story forces at 1st and 2nd floor (F1 and F2) are calculated to be 1/3 and 2/3 of F3, and applied to the corresponding floor. The ratios for F1/F3 and F2/F3 were kept to be constant, which were 1/3 and 2/3, throughout every loading step in the test. These ratios represent the inverted triangular distribution of seismic forces. At each prescribed roof drift ratio two cycles of loading were applied. Horizontal displacements of the specimen were measured with linear potentiometers placed at each level. In addition, 12 pairs of potentiometers were installed to measure the average curvatures at column and beam sections. The instrumented beam sections were typically located at 0.5hb (hb is the beam depth) from the face of the column, and the instrumented column sections were located at 0.5hc (hc is the column depth) from the face of the beam. A data logger TDS601-A system was used to record the analog output readings from the instrumentation digitally. / /
Test Results and Observations Cracks and Failure Mode For safety reason, observations were made after each loading cycle. At the roof drift ratio of 0.5 % (first cycle) the first crack was observed. Cracks were found at both ends of all columns and beams in the first and second story. In third story cracks were observed at lower ends of all columns and interior beam-ends. After the roof drift ratio of 2.5 %, shear cracks were observed at the exterior joint of the first floor, where the transverse beam met the longitudinal beam. At the roof drift ratio of 3.0 %, cracks at the upper ends of the first story columns became wider, while the slight concrete crushing was observed at the lower ends of columns in the same story.
Test was terminated at the roof drift ratio of 5.5 % when the lateral strength was deteriorated up to 70 % of the maximum strength. After testing, the columns in the first and second stories were severely damaged. At this displacement level, loss of cover concrete and reinforcement exposing at the column ends in the first-story was observed. /
Hysteretic Performance Hysteretic curve for base shear force (V) versus roof drift ratio is shown in Fig. 5. Also, Fig. 6 shows hysteretic curves at each joint at the 1st floor. The hysteresis loops shown in Fig. 5 is quite stable. The model behaved almost elastically until ±0.5 % roof drift level. As the drift level increased, stiffness degradation in unloading curves became larger. At the 2nd cycle of a large drift amplitude (>1.8 %) significant strength degradation was observed while stiffness degradation is relatively small. Even though the structural damage was severe at the roof-drift ratio of 5.5 %, hysteretic loops were still stable without abrupt degradation of strength or energydissipation capacity. The maximum base shear force from the test was 0.157 W (weight). This shear force is attained at the roof drift ratio of 0.015 (see Fig. 6). Yield displacement was determined from reduced stiffness equivalent elasto-plastic curve which was suggested by Park (1989). The yield drift ratio of the tested OMRCF structure was found as 0.005. And maximum drift ratio is estimated as 0.04, which is corresponding to the strength deteriorated by 20% from the maximum strength. Fig. 7 shows that interior columns have experienced significant inelastic deformation, while interior beams had only slight inelastic excursions. This indicates weak column-strong beam mechanism. In exterior joints, damages were distributed to the exterior beam and column. The exterior columns did not experience severe inelastic excursion, as did the interior columns whereas the exterior beams experienced severe inelastic behavior. Due to the slab effect the hysteretic curves at exterior joints are not symmetric (see Fig. 7). In the negative loading the reinforcement in the slab are acted as tensile reinforcement so that beam moment capacity becomes larger. However, the slab contribution to the beam moment capacity is minor in the positive loading direction. Thus in the positive loading direction damage is concentrated on beams whereas exterior columns behaved almost in elastic range. In the negative loading direction damage is distributed along beam and column. In the interior joints hysteretic curves are symmetric. Columns behaved in inelastic range whereas beams behaved almost in elastic range. Thus when large earthquake occurs columns are more vulnerable than beams at interior joints. / /
Conclusions /
This study investigates the behavior of moment frames designed only for gravity loads and detailed by the requirements for OMRCF. From the experimental test, following conclusions can be made. � The 3-story OMRCF has stable hysteretic behavior without abrupt deterioration of lateral strength throughout the test even if the frame was designed only for gravity loads and detailed for the requirements of OMRCF in ACI 318 (1999). � The yield and maximum roof drift ratios of the test specimen were determined as 0.005 and 0.04, respectively. � The frame has a hybrid failure mechanism, which is combination of column hinge mechanism (interior beams and columns) and beam hinge mechanism (exterior beams and columns). /
Acknowledgements /
The support of the STRESS of KOSEF at Hanyang University is greatly acknowledged. / /
References /
American Concrete Institute (1999), Building code requirements for reinforced concrete, ACI 318-99, Detroit, Michigan International Conference on Building Officials (1997), Uniform Building Code (UBC), Whittier, California. Computers and Structures Inc. (1997),, SAP2000-Integrated Structural Analysis and Design Software, Berkeley, California, 1997. Bracci, J. M., A. M. Reinhorn, and J. B. Mander (1992), Seismic resistance of reinforced concrete frame structures designed only for gravity loads: Part I -- design and properties of a one third scale model structure, NCEER-92-0027, National Center for Earthquake Engineering Research, Buffalo, N.Y., vol 1. Park, R. (1989), “Evaluation of ductility of structures and structural assemblages from laboratory testing,” Bulletin of the New Zealand National Society for Earthquake Engineering, Vol 2, No 3, pp.155166. Han, S. W., Lee, L. H., Foutch, D. (2002), Seismic Performance of Ordinary Moment Resisting Concrete Frames, SRS report, SRS000, University of Illinois, Urbana. (under publication)
/
Table 1. Concrete Properties of the Model Compression strength (kgf/cm2) 3 days
28 days
85 days
112
298
315
Young coefficient (kgf/cm2)
Slump (cm)
265.4
18
/ / /
Table 2. Reinforcing Steel Properties of the Model
Bar
Ductility (%) 6.82 6.50
550
D6 φ3.3 mm
Young Yielding Yielding Ultimate strain strength modulus strength 2 2 -6 (kgf/cm ) (kgf/cm ) (×10 ) (kgf/cm2) 3600 2206 4200 1.82×10⁶ 6 3520 2130 3900 1.73×10
183 183
550
350
ALL COLUMNS 33 ,/33cm ALL BEAMS 25 ,/ 50cm
550
550
550
350 550
//
550
550
/
(a) Elevation
550
350
SLAB(15cm)
(b) Plan
Figure 1. Plan and elevation of prototype structure (Units are in cm.)
550
/
517cm 54cm
210cm
A
254cm
B
CL C
C
2 -D19 (L=264cm, tot)
23cm
3 -D19 (L=651cm)
85cm
2 -D19 (L=609cm, tot) A
B
C
11-D10 @200mm
13-D10 @200mm
C
13-D10 @200mm /
50cm 35cm 15cm
/ 2-D19
3-D19
D10 2-D19
D10 2-D19
2-D19
25 cm
A-A
//
B-B
C-C
/
/
Figure 2. Rebar layout for beams of prototype structure / / /
3-D10 @150mm
16cm
3-D10 @150mm
8-D10 @300mm
100cm
8-D10 @300mm
3-D10 @150mm
3-D10 @150mm 3-D10 @150mm
16cm
3-D10 @150mm
8-D10 @300mm
100cm
8-D10 @300mm
3-D10 @150mm
3-D10 @150mm 3-D10 @150mm
3-D10 @150mm
16cm Y
Y
Y
9-D10 @300mm
Y 9-D10 @300mm
100cm
4-D19
33cm
D10
4-D10 @150mm
18.5cm
4-D10 @150mm 25cm
/// / /
Figure 3. Rebar layout for columns of prototype structure
33cm
/
Figure 4. Experimental setup / �� ��
��� ��� �� �� � � �� �� �� � �� �� �� �� �� �� �� ��� �� �� �� �� �� �� � �� �� � �� �� � ��
� �
� ��
��
��
�
��
�� ��� ���� ��
/
Figure 5. Base shear force-roof drift Responses /
���
��
� ���� � � �
�� ���� �� �� ���� �� �� �� ���� �
�� ��� ������������
���� ����
�� �
�PD[
�� ����
����
����
���
����
� ���� ����� ��
Figure 6. Yield drift and maximum base shear /
/
/
/