Experimental observation and matching numerical simulation for the deformation and breakup of immiscible drops in oscillatory shear Sirilak Wannaborworn and Malcolm R. Mackleya) Department of Chemical Engineering, University of Cambridge, Pembroke Street, Cambridge CB2 3RA, United Kingdom
Yuriko Renardy Department of Mathematics and ICAM, Virginia Polytechnic Institute and State University, Blacksburg, Virginia 24061-0123 (Received 27 March 2002; final revision received 19 June 2002)
Synopsis This paper describes experimental results on the way immiscible drops of a Newtonian fluid can deform and breakup when subject to oscillatory shear deformation. The paper also reports a matching three-dimensional numerical simulation of corresponding events. Using an optical shearing apparatus and a modified rheometer, experimental observations on the deformation of drops with a viscosity ratio of unity were carried out for a range of strain amplitudes and frequencies. For moderate strain deformations, it was discovered experimentally that the drop deformation oscillates between a maximum and a nonzero minimum deformation parameter and that the numerical simulation was able to capture both this and start up effects. For large strain deformations it was experimentally observed that breakup occurred only by one mechanism; namely, end pinching, and this was successfully matched by the numerical simulation. The results for oscillatory deformation and breakup are compared with those obtained in steady shear. © 2002 The Society of Rheology. 关DOI: 10.1122/1.1501960兴
I. BACKGROUND The deformation and breakup of immiscible Newtonian drops is a subject that has been extensively studied since the pioneering work of Taylor 共1932兲. Taylor carried out experiments both in extensional and steady simple shear flow. He also developed modeling, and in relation to this paper defined a droplet deformation parameter, D f , in terms of an ellipsoid major 共L兲 and minor 共B兲 axes: D f ⫽ (L⫺B)/(L⫹B). Deformation was found to depend on the viscosity ratio of the system and a dimensionless capillary number, Ca, which is the ratio of the viscous shear stress and the interfacial stress, Ca ⫽ m ␥˙ a/ , where m is the viscosity of the matrix phase, ␥˙ is the shear rate, a is the spherical drop radius, and is the interfacial tension between the two phases. In relation to droplet deformation extensive further experimental and modeling studies have been made in particular on the deformation of drops in steady simple shearing flow 关see, for example, Torza et al. 共1972兲兴. There is a more limited number of studies that a兲
Author to whom correspondence should be addressed; electronic mail:
[email protected]
© 2002 by The Society of Rheology, Inc. J. Rheol. 46共5兲, 1279-1293 September/October 共2002兲
0148-6055/2002/46共5兲/1279/15/$25.00
1279
1280
WANNABORWORN, MACKLEY, AND RENARDY
examine the time dependence of droplet deformation in steady shearing flow 关Guido et al. 共2000兲兴. Both experiment and modeling show that the deformation of an initially spherical drop in a simple shear flow occurs in the 45° direction within the shear plane. The principle axis of the deformed ellipsoid then rotates towards the direction of flow. The degree of rotation and the level of distortion depend on the applied capillary number, Ca. The criteria for droplet breakup has been found to be more complex and is usually associated with a critical value of the capillary number, Cac , 关see, for example, Grace 共1982兲兴. Cac depends on the viscosity ratio of the drop and matrix, p ⫽ d / m , where d is the viscosity of the drop. For p ⫽ 1, Cac is of order 0.55. Liquid drops can breakup in a number of ways as reported for example by Tsakalos et al. 共1998兲 and the particular form of drops that are formed depends not only on p but also on Ca/Cac when Ca/Cac ⬎ 1. Theoretical work on both deformation and breakup in simple shear flow has been extended since Taylor’s original work. Chaffey and Brenner 共1967兲 predicted small deformation relationships between D f and Ca using second-order small deformation theory. Cox 共1969兲 studied deformation behavior in steady flow and Hinch and Acrivos 共1980兲 used slender body modeling to describe large-scale deformation. Reviews by Rallison 共1984兲 and Stone 共1994兲 give useful summaries on both deformation and breakup studies. Little attention appears to have been paid to time-dependent flows. In most cases droplets in the quiescent state are spherical and it is the time dependence of any deformation history that will dictate how the drop is deformed or broken. The application of steady shear from rest is one obvious case that has already received some attention. Another well-defined time-dependent deformation is the application of oscillatory shear, where both the amplitude and frequency of deformation can be carefully controlled. This paper describes both the way drops deform and also how they are observed to breakup in this kind of deformation. The deformation and breakup of drops in oscillatory shear also offers a challenging set of boundary conditions for any numerical simulation of droplet behavior and this paper provides a platform for such a comparison. The three-dimensional 共3D兲 numerical scheme has been under recent development and the matching of the experiment observations to the numerical scheme provides insight to the observations and confidence in certain predictions of the modeling. In Sec. II of this paper a summary of the numerical scheme that was used is given. Section III describes experimental materials and equipment. The experimental results and matching simulations are given in Sec. IV and the main findings of the work summarized in a final conclusion.
II. NUMERICAL SIMULATION The numerical simulation described has been developed over recent years by Renardy 关see, for example, Li and Renardy 共2000兲兴. The matrix fluid 1 and liquid drop fluid 2, are both considered as Newtonian. The immiscible interface is described by a surface tension, , and both fluids are assumed incompressible. The flow is considered to be creeping, although inertia terms are retained within the formulation. A. Governing equations and solving methods Both fluids 1 and 2 are assumed Newtonian and the Navier–Stokes equation is applied:
DEFORMATION AND BREAKUP OF IMMISCIBLE DROPS
冉
u t
冊
⫹u•“u ⫽ ⫺“ p⫹“• S⫹F,
1281
共1兲
where is the density, is viscosity, S is the strain rate tensor, Si j ⫽
冉
u j xi
⫹
ui x j
冊
共2兲
,
and F is the body force, which in this case is the interfacial tension force. F ⫽ ns , where is the interfacial tension, is the mean curvature, and ns is the normal to the interface. The velocity field u is subject to the incompressibility constraint, “•u ⫽ 0.
共3兲
To enable effective numerical solution, the projection method 关see, for example, Chorin 共1967兲兴 is used. The projection method makes use of an intermediate velocity, u * , between the time level n and n⫹1 to calculate the pressure gradient and obtain u n⫹1 . Assuming that un is known, the momentum equations are first solved for an approximate u* without the pressure gradient: u* ⫺un ⌬t
1 ⫽ ⫺un •“un ⫹ 关 “• 共 S兲 ⫹F兴 n .
共4兲
The pressure gradient term relates to u * by Eq. 共5兲: un⫹1 ⫺u* ⌬t
⫽⫺
“p
.
共5兲
By taking the divergence of Eq. 共5兲 and from “•un⫹1 ⫽ 0 共u* does not generally satisfy the continuity equation兲, the pressure gradient term can be solved from Eq. 共6兲: “•
冉 冊 “p
⫽⫺
“•u* ⌬t
.
共6兲
Once the pressure term is known, un⫹1 is found from Eq. 共5兲. By using this method, the algorithm is easier to solve. A combination of semi-implicit treatment with a factorization is utilized 关for more detail, see, for example, Li and Renardy 共2000兲兴. B. Spatial discretization A Cartesian mesh of rectangular cells of variable sizes is used. The momentum equations are finite differenced on a locally variable, staggered mesh. The velocities u, v , and w in the x, y, and z directions, respectively, are located on the faces of the cell whereas the pressure and the volume fraction of fluid 1 and 2 are located at the center. This is called the marker-and-cell 共MAC兲 method 关see, for example, Peyret and Taylor 共1990兲兴. C. Interface tracking and construction In this type of problem the flow-induced changes of the interface are of central interest and, therefore, an efficient interface tracking method is essential. The volume of fluid 共VOF兲 method used is based on a fixed, Eulerian grid of control volumes. In this method, a volume fraction C 共or so-called the VOF function兲 is used to determine the presence of one fluid. For example, if C represents the volume fraction of fluid 1, in the cell containing this fluid, C ⫽ 1 and in the cell without this fluid, C ⫽ 0. In the cell containing the
1282
WANNABORWORN, MACKLEY, AND RENARDY
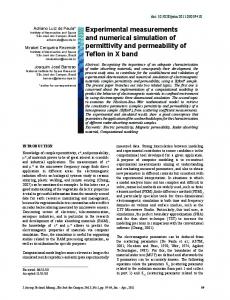
FIG. 1. Three-dimensional box computational domain: 0 ⬎ ⫽ x ⬎ ⫽ Lx, 0 ⬎ ⫽ y ⬎ ⫽ Ly, 0 ⬎ ⫽ z ⬎ ⫽ d, and d ⫽ Lz, with spatial periodicity in the x and y directions, of periods Lx and Ly, respectively. The top and bottom boundaries are oscillating plates with speeds u ⫽ U cos(t) and u ⫽ ⫺U cos(t), respectively. Initially, a spherical drop of radius a is placed at the center of the box.
interface 0 ⬍ C ⬍ 1. The interface lies in cells partially filled with fluid 1 or between cells full of fluid 1 and fluid 2. For a given interface, C can be calculated, but knowing the volume fraction in the cell does not directly provide the information of the orientation and local curvature of the interface. In order to construct the interface in the cell, the piecewise linear interface construction 共PLIC兲 method was used 关for more detail, see, for example, Li and Renardy 共2000兲兴. In this method, the approximate normal n to the interface in each cell was calculated from the discrete gradient of the volume fraction field so the linear interface of the cell can be determined: n⫽
“hC 兩“hC兩
.
共7兲
The volume fraction, C, is governed by a transport equation by the velocity field u:
C t
⫹u•“C ⫽ 0.
共8兲
Once the interface is reconstructed, the velocity at the interface is interpolated linearly and then the new position of the interface is calculated by the following formula: xn⫹1 ⫽ xn⫹u共 ⌬t 兲 .
共9兲
The new position of the interface obtained from Eq. 共9兲 is then used to calculate the new volume fraction, which is subjected to the physical constraint 0 ⭐ C ⭐ 1. The new interface can then be reconstructed from new C and n. In this way, the interface changes due to the external flow can be followed. D. Conditions used in simulations for the problem of deformation and breakup in oscillatory shear The computational domain is a three-dimensional box as shown in Fig. 1: 0 ⭐ x ⭐ Lx, 0 ⭐ y ⭐ Ly, 0 ⭐ z ⭐ h, and h ⫽ Lz, with spatial periodicity in the x and y directions, of periods Lx and Ly, respectively. The top and bottom boundaries are oscillating plates with speeds U cos(t) and ⫺U cos(t), respectively. Initially, a spherical drop of radius a is placed at the center of the box. The initial conditions are that the droplet is spherical in shape and the velocity is zero. The boundary conditions are that in the x and y directions the flow is periodic. For the sinusoidal strain oscillation, in the z direction, the top plate at z ⫽ Lz has velocity in the x-direction U cos t, the lower plate at z ⫽ 0 is ⫺U cos t, where ⫽ 2 f , f being the
DEFORMATION AND BREAKUP OF IMMISCIBLE DROPS
1283
frequency. The velocity differential between the top and bottom plates is 2U cos t. To determine U, 2U cos t is integrated with respect to time for the position differential, the amplitude of the displacement is 2U/ , then strain ( ␥ ) ⫽ 2U/( h), h being the gap width. This yields U ⫽ ␥ h/2. The experimental gap set between the two plates is 200 m, so that the effect of the walls is minimal for drops of 30– 40 m typical diameter. The computational domain is chosen so that under the strains, the drop will not elongate out of the computational box and re-enter the box due to periodicity in the x and y directions. It was found that Lx ⫽ 8a, Ly ⫽ 4a, and h ⫽ 8a were sufficient to minimize the wall effect. The numerical simulations were performed with a symmetric boundary condition at the top and bottom plates in a three-dimensional box. This means that both plates oscillate. It has been checked in the simulations that the case where just the bottom plate oscillates gives identical results. The solutions were calculated at successive time steps until convergence, i.e., until the solution no longer changed from one periodic time to the next showing that steady state was reached. Breakup was indicated by the lack of steadystate solution. The method of simulation has already been tested for a similar type of problem in steady shear, i.e., droplet deformation, orientation and breakup 关see, for example, Li et al. 共2000兲兴. The consistency of the results obtained from this numerical simulation technique with previous theoretical, numerical and experimental results in steady shear, has shown that the simulation is robust at least for these boundary conditions. III. MATERIALS AND EXPERIMENTAL TECHNIQUE The liquids under investigation were polydimethysiloxane 共PDMS兲 and polyisobutene 共PIB兲. Their details are listed in the following table. Fluid
Formula
PDMS
关 – Si(CH3 ) 2 O– 兴 n 关 – CH2 C(CH3 ) 2 – 兴 n
PIB
Grade
Suppliers
Phase
sp.gr.
100 000
Aldrich
Dispersed 共1兲
0.971
Refractive index 1.405
ULTRAVIS
Adibis
Matrix 共2兲
0.901
1.498
Both fluids are transparent liquids at room temperature. The difference in their refractive indices is high enough to ensure good optical contrast under bright-field observation. Buoyancy effects are negligible due to the closeness in densities and high viscosities of the polymers. The interfacial tension between PDMS and PIB is reported to be 2.3– 4 mN/m 关Sigillo et al. 共1997兲兴. In this work, using the small deformation theory of Taylor 共1934兲 and Cox 共1969兲 and the drop retraction method of Luciani 共1997兲, the interfacial tension between PDMS and PIB was found. All values obtained fell in the range mentioned above, therefore, an average value of 3 mN/m was used to calculate the capillary number. In our case, since the density and the viscosity of the matrix phase are constant, the maximum oscillatory Reynolds number, Reosc ( ⫽ a2/ ) depends on the external flow frequency and droplet size, e.g., for the maximum frequency tested of 1 Hz and droplet size of 50 m PIB ⫽ 901 kg/m3 , ⫽ 80 Pa s, then Reosc ⫽ 2.8⫻10⫺8 . The characteristic droplet relaxation time is given by ⫽ a/ . For a droplet of 50 m, ⫽ 80 Pa s and ⫽ 3 mN/m, ⫽ 0.66 s. The ratio of the drop relaxation time to oscillation period of the external flow then can be calculated. Rheological properties of both materials are shown in Fig. 2. Both fluids have constant viscosity 共 ⬃ 80 Pa s兲 over the range of shear rates operated for the experiments carried out here.
1284
WANNABORWORN, MACKLEY, AND RENARDY
FIG. 2. Rheology of PIB and PDMS showing viscosity in steady shear mode using the Rheometrics rheometer, RDSII. 25 mm diam parallel-plate geometry, gap ⫽ 0.6 mm, transducer ⫽ 2000 g cm, and room temperature.
The main apparatus used in this work is the Cambridge Shearing System-CSS450 关Mackley et al. 共1999兲兴 manufactured by Linkam Scientific Instrument Ltd. The normal sample stage on an optical microscope is simply removed and replaced by the shear system. The apparatus is precision engineered and is shown schematically in Fig. 3. The apparatus consists of two glass disks mounted on top and bottom plates. The bottom disk, 55 mm in diameter, is attached to a stepper motor, and by the use of appropriate software
FIG. 3. Schematic diagram of the Cambridge Shearing System, CSS450.
DEFORMATION AND BREAKUP OF IMMISCIBLE DROPS
1285
FIG. 4. Deformation parameters defined in both views: D f for sideview along vorticity axis using the Rheometrics rheometer and for top view along velocity gradient axis using the Cambridge Shearing System, CSS450.
the bottom disk can be either oscillated or rotated at a constant speed, allowing the applied shear to the sample to be either oscillatory or continuous. The top disk, 32 mm in diameter, can be positioned with micron accuracy using a second stepper motor to give gap control for the disks of between 0 and 2500 m. In this way, it is possible to then provide a controlled shear field across the field of view. Temperature-controlled heated silver block disks are placed on either side of the glass disk, as shown in Fig. 4, to give precise temperature control between room temperature and 450 °C. The mechanical function of the CSS450 mimics the response of many rheometers such as the Rheometrics, however, instead of providing rheological information on the shear behavior of materials, the CSS450 provides complementary optical information. Full control of the shear cell was facilitated by software interface running on a personal computer. The optical stage was mounted on a standard Olympus optical microscope with a JVC charge-coupleddevice 共CCD兲 camera fitted so that experiments could be recorded onto S-VHS videotape. Optical observation of droplet deformation was obtained from a ‘‘top view,’’ as shown schematically in Fig. 4. More detail on this apparatus can be found in Mackley et al. 共1999兲. PDMS 共fluid 1兲 was injected into PIB 共fluid 2兲 in situ to ensure that the dispersed phase was in the middle of the gap between the glass plates. All experiments were conducted at room temperature with a gap width of 200 m and an objective lens of ⫻5 and ⫻10 magnification. Droplet sizes generated were between 10–50 m. The shear rate in the field of view was calculated from a knowledge of the steady or oscillatory velocity corresponding to the radial position of observation and the separation gap of the plates. We do not believe that curvature effects were present in this work since observed from the top view, the elongated droplet would appear distorted if bent from the curvature of the device. ‘‘Sideview’’ observation along the vorticity axis was not possible using the CSS450 and so a complementary set of experiments were carried out using a Rheometrics RDSII instrument. The Rheometrics rheometer, RDSII, is a controlled strain rheometer capable of applying steady, step, and oscillatory shear to samples, employing a choice of different geometries. The bottom plate is mounted on a high-resolution stepper motor that subjects the sample to controlled shear strain conditions in either steady, oscillatory, or step strain modes. The stationary top plate is coupled to a force rebalance transducer 共FRT兲 that provides a continuous measure of the transmitted stress. It is prevented from moving by use of an induction coil that instantaneously applied an equal and opposite torque to the plate. In all experiments reported here a RDSII, 2000 g cm force rebalance transducer
1286
WANNABORWORN, MACKLEY, AND RENARDY
FIG. 5. Deformation parameter, D ⬘f , vs time. Initial droplet diameter ⫽ 42.72 m. Shear rate ⫽ 0.5 s⫺1 ; Ca ⫽ 0.285. Comparison with VOF numerical simulation. The experimental data are from the CSS450 and VOF data are calculated from the top view.
was used in conjunction with 25 mm in diameter parallel plates at room temperature. The instrument was under full computer control with real-time on-screen data acquisition. The RDSII was not only used for rheological data of two materials, but was adapted in conjunction with a CCD camera for observation of droplet deformation sideviewed 共along vorticity axis兲. The deformation parameter from the sideview 共in the plane of velocity gradient axis and flow direction axis兲 is defined as D f ⫽ (L⫺B)/(L⫹B), which is the conventional definition first proposed by Taylor. The angle of rotation, , is defined as the angle between the velocity gradient axis and droplet principle axis of extension. The strains stated in each figure are the maximum strain of the oscillation. From the top view 共in the plane of vorticity axis and flow direction axis兲 the projections of L and B are L ⬘ and C, respectively, so that the deformation parameter in this case will be D ⬘f ⫽ (L ⬘ ⫺C)/ (L ⬘ ⫹C). Figure 4 shows how D f and D ⬘f , relate to the ellipsoid axes in both views. Data from both CSS450 and RDSII were converted from the VDO tapes to digital files by Adobe Premier software. These images were then analyzed by Scion Image software for L, B, L ⬘ , C, D f , and D ⬘f . IV. RESULTS AND DISCUSSION A. Oscillatory deformation without breakup In steady shear flow, droplet deformation increases with time from zero as a spherical drop to a definitive steady-state value. An example of droplet deformation obtained using the CSS at steady shear startup and at steady state with matching simulation of the VOF method is shown in Fig. 5. Droplet deformation in oscillatory shear is more complicated than in steady shear due to the combination of droplet rotation and the periodic change in shear direction. A coupled series of experiments and simulations were carried out in order to establish how droplet deformation occurred in oscillatory shear. Visual sideview observation was most revealing in terms of the mechanism involved, and Fig. 6 shows both RDS experimentally observed images and matching simulation. The experimental photographs of a deforming drop in one oscillatory cycle are shown in the top row a of Fig. 6 and the matching simulation in row b. The initially spherical drop is deformed into an ellipsoid by the bottom plate of the rheometer moving from left to right. The maximum deformation is seen when the strain reaches its maximum value and at this point the droplet aligns
DEFORMATION AND BREAKUP OF IMMISCIBLE DROPS
1287
FIG. 6. The sideview deformation and orientation of a droplet in the first oscillatory cycle of 150% strain and 0.1 Hz frequency. Droplet size is 0.9 mm and gap width ⫽ 1.5 mm. Top row 共a兲 is experimental images from the RDSII and bottom row 共b兲 is simulated sideview images from VOF numerical method. Graph below shows time dependent strain of 150% 0.1 Hz. The arrows show the direction of flow.
closest to the flow. As the strain amplitude reaches a maximum the plate movement changes from right to left; this leads to a corresponding change in the deformation of the drop. The principal axis of the drop essentially switch from extension to compression, i.e., the droplet being stretched in the ellipsoid minor axis direction and squashed in the ellipsoid major axis direction as the droplet is subject to the reversing strain. Figure 6 not only shows how deformation and orientation vary with time and strain but also shows how well the simulation captures this behavior. A more quantitative match of the simulation is given in Figs. 7 and 8 where the sideview deformation parameters and orientation angle are compared with RDS experimental results. It can be seen from Fig. 7 that D f varies with strain between the maximum value (D f max) and minimum value (D f min). The unexpected observation of both experiment and simulation was that when steady-state oscillatory conditions were reached, a nonzero minimum deformation parameter was detected. This is more clearly seen from top view observations described later. Figure 7 shows that when the magnitude of applied strain is increased, i.e., from 50% to 150% or 250%, it is clear that D f also increases but it is observed that this increment
FIG. 7. Time evolution of deformation parameter from sideview observation for 50%, 150%, and 250% strain 0.1 Hz frequency. Symbols are experimental data from the RDSII and solid lines are simulation data.
1288
WANNABORWORN, MACKLEY, AND RENARDY
FIG. 8. Time evolution of maximum angle of rotation, max , from sideview observation using the RDSII for 250% strain, 0.1 Hz frequency.
is not linearly proportional to the increase in strain. In steady shear, D f increases linearly at a small capillary number, Ca, and starts to deviate at higher Ca, for instance, at Ca ⬎ ⬃ 0.4 关Uijttewaal and Nijhof 共1995兲兴. The numerical matching of the RDS sideview rotation angle with experiment is shown in Fig. 8 for one strain amplitude and again agreement with simulation is good. The angle of rotation is defined as the angle between the velocity gradient axis and droplet principle axis of extension such that is positive in the first quadrant and negative in the second quadrant, then changes sign every half an oscillatory cycle or in other words, every quarter of the cycle after flow reversal. The difference in sign of is used to distinguish the orientation of the droplet when the flow reverses. As seen from Fig. 8, increases with strain to max at maximum strain. This is similar to steady shear where the stronger the flow the more the droplet aligns closer to the flow direction 关see, for example, Bentley and Leal 共1986兲兴. At this point of maximum strain the flow reverses as the droplet tries to rotate to the opposite direction due to the new flow field. Usually, the droplet does not resume the spherical shape at zero strain so this neutral position does not necessarily mean zero degree of the angle of rotation. It can be noticed that there is a sharp change of from negative to positive value 共or vice versa兲 revealing that the droplet quickly aligns in the opposite direction right after the neutral position. The work of Guido et al. 共2000兲 on flow reversal of steady shear showed that for p ⫽ 1 and Ca ⭐ 0.3 the time taken for such a change of sign of the angle of rotation was less than 1 s. The periodic change in flow direction is seen to be the main factor governing the orientation. In general, it was easier to obtain greater precision from the CSS450 top view observation and Figs. 9 and 10 show matching experimental and simulation data for this case. In Fig. 9 the qualitative match between simulation and experiment can be seen for two different strain amplitudes. The experimental images are on the top row and directly below are the simulated images. The plate movement of the CSS450 is of cosinusoidal strain function. In Fig. 9共a兲 the deformation at dynamic steady state in one oscillatory cycle is presented. It shows the way the deformation oscillates between the maximum and minimum values without returning to a truly spherical shape at zero strain. Figure 9共b兲 shows the transient behavior from startup of the deformation at high strain. In the first half of the cycle, e.g., from t ⫽ 0 s to t ⫽ 1.5 s, the droplet deforms rapidly. The deformation oscillates more regularly in the second cycle compared to the first cycle as both D ⬘f max and D ⬘f min are adjusting magnitudes towards the dynamic steady-state values. The
DEFORMATION AND BREAKUP OF IMMISCIBLE DROPS
1289
FIG. 9. Top view experimental 共from the CSS450兲 and simulated images, f ⫽ 0.3 Hz, 共a兲 strain ⫽ 150%, d ⫽ 36.71 m showing one oscillatory cycle at dynamic steady state. 共b兲 strain ⫽ 250%, d ⫽ 30.17 m showing two oscillatory cycles during transient deformation at shear startup.
numerical simulation captured the transient behavior of D ⬘f max and D ⬘f min showing both overshoots and undershoots. The transient behavior in steady shear is simpler than the oscillatory case in that D f rises with time before reaching a single definitive steady state. When the magnitude of the maximum value of D f in oscillatory shear is compared with an equivalent steady shear rate, then oscillatory shear produces a lower D f for the same capillary number, based on the maximum shear rate of the oscillation. In summary, it has been possible to follow both the side and top view deformation. The reversing direction of strain causes a complex change in droplet shape and this has been successfully captured by the numerical simulation. A nonzero minimum deformation of the drop was experimentally observed and predicted by the simulation. B. Oscillatory deformation with breakup We have examined only a limited range of frequencies and amplitudes; however, the only breakup mechanism of droplet that we have observed in oscillatory shear is end pinching. In particular, as the amplitude of oscillation is increased the drop progressively
FIG. 10. Top view from the CSS450 comparison with simulated L ⬘ /a, C/a and D ⬘f for f ⫽ 0.3 Hz, strain ⫽ 250%; d ⫽ 30.17 m.
1290
WANNABORWORN, MACKLEY, AND RENARDY
FIG. 11. Top view images from the CSS450 of end-pinching breakup mechanism during oscillatory shear of 1500% strain and 0.05 Hz frequency. Droplet diameter ⬃ 30m, the aspect ratio at t ⫽ 7.3 s is 47.77 and Camax ⫽ 1.88.
distorted to higher aspect ratios and at a critical condition, end pinched drops are formed. The effect is shown experimentally using the CSS in Fig. 11 and numerically in Fig. 12. As seen in Fig. 11, the breakup mechanism was such that as the droplet elongates into a thread, the end parts start to develop bulbous shapes, and two end pinched drops form at the tips of the elongated drop at the first maximum strain of the cycle. Subsequently, the elongated drop relaxes during the reversing strain, leaving the initial drops isolated. At the second point of maximum strain, a further pair of end pinched drops are formed during the next oscillation as shown in the second sequence of photographs. At every maximum strain, the droplet aspect ratio reaches its maximum value. This leads to forming of bulbous ends and the end-pinching process repeats. In the bottom sequence of photographs two previous end pinched drops can be seen at each end of the thread, together with the formation of the third pair. Figure 12 shows the numerical simulation of the highly deforming thread and it can be seen that the simulation predicts breakup by end pinching. The simulated velocity vector plots in the plane of velocity gradient axis and flow direction axis, before and after flow reversal, at t ⫽ 9, 11, and 13 s are shown in Fig. 12. At t ⫽ 9 s the flow is moving from left to right pushing the end of the thread outwards. Breakup at t ⫽ 11 s shows that the end was pinching off by the outward shear. As the flow reverses, the drop becomes rounder at the end as shown at t ⫽ 13 s. For the same viscosity ratio, in steady shear if the Ca–Cac , the breakup mechanism
DEFORMATION AND BREAKUP OF IMMISCIBLE DROPS
1291
FIG. 12. Velocity plot of oscillatory shear of 1,500% strain 0.05 Hz at t ⫽ 9, 11, and 13 s. Horizontal axis is the flow direction and vertical axis is the velocity gradient direction. The simulation was carried out using the VOF method; Camax ⫽ 1.88
would be the so-called dumbbell breakup where a neck that develops in the middle becomes narrower and results in two equal daughter droplets along with three small satellite drops 关see, for example, Rumscheidt and Mason 共1961兲兴. In case of steady flow with Ca Ⰷ Cac , breakup occurs via a Rayleigh instability resulting in a string of equal daughter drops with three small satellite drops 关see, for example, Grace 共1982兲兴. By applying oscillatory shear, a different droplet size distribution from that of steady shear can be generated since at the critical condition end pinching produces two daughter drops at every maximum strain and no satellite drop is seen. It may be an alternative way of producing two sets of droplet sizes by using oscillation to shed off end drops of the thread, and then stop the shear to let the central thread relax into a bigger drop. Oscillatory shear is a convenient way to generate a certain thread aspect ratio, therefore, it is very useful for studying breakup after shear. The critical aspect ratio, the breakup mechanisms, and the resulting droplet size distribution can be different from those in breakup during shear case. It was found that during oscillatory shear, the droplet
1292
WANNABORWORN, MACKLEY, AND RENARDY
was able to sustain the flow and become highly elongated so that the critical aspect ratio for breakup can be much higher than that in steady flow. For Figs. 11 and 12, the maximum capillary number is Camax ⫽ 1.88, where Camax ⫽ 关m(2 f ␥0)a/兴 where m ⫽ 80 Pa s, f ⫽ 0.05 Hz, ␥ 0 ⫽ 15, a ⫽ 15 m, and ⫽ 3 mN/m. This critical Camax for breakup in oscillatory shear is significantly higher than that in the steady shear where Cac ⬃ 0.55 is for the p ⫽ 1 system. V. CONCLUSIONS Experimental and numerical simulations of droplet deformation and breakup in oscillatory shear have been presented in this paper. The model system was a Newtonian liquid at room temperature, where the dispersed phase has equal viscosity to that of the matrix phase. The Cambridge Shearing System, CSS450 has been shown to be viable for this study, where precise oscillatory flow can be controlled and optical information from the top view, along velocity gradient, observed. The adaptation of the Rheometrics Spectrometer, RDSII, has been utilized, allowing sideview information to be obtained. This data along the vorticity axis shed light on how a droplet orients in this time-dependent flow type. For a small oscillatory deformation, a spherical drop deforms into an ellipsoid shape. The deformation varies with time in an oscillatory cycle in the same way as the strain. The reversal of flow direction causes the droplet to be compressed in the ellipsoid major axis direction and extended in the ellipsoid minor axis direction. This causes the droplet to orient in the opposite direction every time the flow direction changes. The deformation parameter, D f varies between a maximum and a minimum value. The droplet does not return to a spherical shape at zero strain. Both D f max and D f min also increase with the magnitude of applied strain but not linearly. The critical Ca for breakup in oscillatory shear was found to be higher than an ‘‘equivalent’’ situation in steady shear. The breakup mechanism occurred only by end pinching at the point of maximum strain. This mechanism is different from the steady shear case 共for unity viscosity ratio兲 where at critical shear rate, elongated dumbbell shape droplet is broken in the middle producing two equal daughter drops along with satellite drops. The deformation and breakup of drops in an oscillatory flow has provided a challenging series of experimental time-dependent deformation situations for the numerical simulation to match. In general, the 3D simulation has predicted both deformation and breakup with good precision thereby showing that both modeling base assumptions and numerical techniques were sound 关see, also, Flumerfelt 共1972兲; Janssen 共1993兲; Karem and Bellinger 共1968兲; Lafaurie et al. 共1994兲; Stone and Leal 共1998兲; Tjahjadi et al. 共1992兲兴. ACKNOWLEDGMENTS The numerical part of this work was sponsored by NSF-INT 9815106, ACS-PRF, NSF-DMS SCREMS, the Illinois NCSA under Grant Nos. CTS990010N, CTS990059N, and CTS990063N, and utilized the NCSA SGI Origin 2000, and the Interdisciplinary Center for Applied Mathematics Origin 2000. The authors thank Michael Renardy for discussions, and Stephane Zaleski and Jie Li for the use of SURFER. Acknowledgement is made to the donors of The Petroleum Research Fund, administered by the ACS, for partial support of this research. One of the authors 共S.W.兲 would like to thank Cambridge Overseas Trust, Cambridge–Thai Foundation and Linkam Scientific Instruments Ltd. for financial support and Ashish Lele for discussions.
DEFORMATION AND BREAKUP OF IMMISCIBLE DROPS
1293
References Bentley, B. J. and L. G. Leal, ‘‘An experimental investigation of drop deformation and breakup in steady, two-dimensional linear flows,’’ J. Fluid Mech. 167, 241–283 共1986兲. Chaffey, C. E. and H. Brenner, ‘‘A second-order theory for shear deformation of drops,’’ J. Colloid Interface Sci. 24, 258 –269 共1967兲. Chorin, A. J., ‘‘A numerical method for solving incompressible viscous flow problems,’’ J. Comput. Phys. 2, 12–26 共1967兲. Cox, R. G., ‘‘The deformation of a drop in a general time-dependent fluid flow,’’ J. Fluid Mech. 37, 601– 623 共1969兲. Flumerfelt, R. W., ‘‘Drop breakup in simple shear fields of viscoelastic fluids,’’ Ind. Eng. Chem. Fundam. 11, 312–318 共1972兲. Grace, H. P., ‘‘Desperion phenomena in high viscosity immiscible fluid systems and application of static mixers as dispersion devices in such systems,’’ Chem. Eng. Commun. 14, 225–277 共1982兲. Gueyffier, D., J. Li, A. Nadim, R. Scardovell, and S. Zaleski, ‘‘Volume-of-fluid interface tracking and smoothed surface stress methods for three-dimensional flows,’’ J. Comput. Phys. 152, 423– 456 共1999兲. Guido, S., M. Minale, and P. L. Maffettone, ‘‘Drop shape dynamics under shear-flow reversal,’’ J. Rheol. 44, 1385–1399 共2000兲. Hinch, E. J. and A. Acrivos, ‘‘Long slender drops in a simple shear flow,’’ J. Fluid Mech. 98, 305–328 共1980兲. Janssen, J. M. H., ‘‘Dynamics of liquid–liquid mixing,’’ Ph.D. thesis, Eindhoven University of Technology 共1993兲. Karam, H. J. and J. C. Bellinger, ‘‘Deformation and breakup of liquid droplets in a simple shear field,’’ I & EC Fund. 7, 576 –581 共1968兲. Lafaurie, B., C. Nardone, R. Scardovelli, S. Zaleski, and G. Zanetti, ‘‘Modeling merging and fragmentation in multiphase flows with SURFER,’’ J. Comput. Phys. 113, 134 –147 共1994兲. Li, J. and Y. Renardy, ‘‘Numerical study of flows of two immiscible liquids at low Reynolds number,’’ SIAM Rev. 42, 417– 439 共2000兲. Li, J., Y. Renardy, and M. Renardy, ‘‘Numerical simulation of breakup of a viscous drop in simple shear flow through a volume-of-fluid method,’’ Phys. Fluids 12, 269–282 共2000兲. Luciani, A., Champagne, M. F., and Utracki, L. A., ‘‘Interfacial tension coefficient from the retraction of ellipsoidal drops,’’ J. Polym. Sci. B 35, 1393–1403 共1997兲. Mackley, M. R., S. Wannaborworn, P. Gao, and F. Zhao, ‘‘The optical microscopy of sheared liquids using a newly developed optical stage,’’ J. Microsc. Anal. 69, 25–27 共1999兲. Peyret, R. and T. D. Taylor, Computational Methods for Fluid Flow 共Springer, Berlin, 1990兲. Rallison, J. M., ‘‘The deformation of small viscous drops and bubbles in shear flows,’’ Annu. Rev. Fluid Mech. 16, 45– 66 共1984兲. Rumscheidt, F. D. and S. G. Mason, ‘‘Particle motions in sheared suspensions. XII. Deformation and burst of fluid drops in shear and hyperbolic flow,’’ J. Colloid Sci. 16, 238 –261 共1961兲. Sigillo, I., L. di Santo, S. Guido, and N. Grizzuti, ‘‘Comparative measurements of interfacial tension in a model polymer blend,’’ Polym. Eng. Sci. 37, 1540–1549 共1997兲. Stone, H. A. and L. G. Leal, ‘‘Relaxation and breakup of an initially extended drop in an otherwise quiescent fluid,’’ J. Fluid Mech. 198, 399– 427 共1998兲. Stone, H. A., ‘‘Dynamics of drop deformation and breakup in viscous fluids,’’ Annu. Rev. Fluid Mech. 26, 65–102 共1994兲. Taylor, G. I., ‘‘The viscosity of a fluid containing small drops of another fluid,’’ Proc. R. Soc. London, Ser. A 138, 41– 48 共1932兲. Taylor, G. I., ‘‘The formation of emulsions in definable fields of flow.’’ Proc. R. Soc. London, Ser. A 146, 501–523 共1934兲. Tjahjadi, M., H. A. Stone, and J. M. Ottino, ‘‘Satellite and subsatellite formation in capillary breakup,’’ J. Fluid Mech. 243, 297–317 共1992兲. Torza, S., R. G. Cox, and S. G. Mason, ‘‘Particle motions in sheared suspensions XXVII Transient and steady deformation and burst of liquid drops,’’ J. Colloid Sci. 38, 395– 411 共1972兲. Tsakalos, V. T., P. Navard, and E. Peuvrel-Disdier, ‘‘Deformation and breakup mechanisms of single drops during shear,’’ J. Rheol. 42, 1403–1417 共1998兲. Uijttewaal, W. S. J. and E. J. Nijhof, ‘‘The motion of a droplet subjected to linear shear flow including the presence of a plane wall,’’ J. Fluid Mech. 302, 45– 63 共1995兲.