choice of a convex hull inclusion. For convex hull computation we use Ken Clarkson implementation of Edelsbrunner algorithm [1], that works in O (n log (n)).
Exploiting Color and Topological Features for Region Segmentation with Recursive Fuzzy c-means R. Cucchiara, C. Grana
S. Seidenari and G. Pellacani
Dipartimento di Scienze dell’Ingegneria Universit` a di Modena e Reggio Emilia, Italy
Dipartimento di Scienze Neuropsicosensoriali Universit` a di Modena e Reggio Emilia, Italy
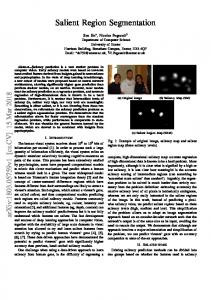
Abstract. In this paper we define a novel approach for image segmentation into regions which focuses on both visual and topological cues, namely color similarity, inclusion and spatial adjacency. Many color clustering algorithms have been proposed in the past for skin lesion images but none exploits explicitly the inclusion properties between regions. Our algorithm is based on a recursive version of fuzzy c-means (FCM) clustering algorithm in the 2D color histogram constructed by Principal Component Analysis (PCA) of the color space. The distinctive feature of the proposal is that recursion is guided by the evaluation of adjacency and mutual inclusion properties of extracted regions; then, the recursive analysis addresses only included regions or regions with a not-negligible size. This approach allows a coarse-to-fine segmentation which focuses the attention on the inner parts of the images, in order to highlight the internal structure of the object depicted in the image. This could be particularly useful in many applications, especially in the biomedical image analysis. In this work we apply the technique to the segmentation of skin lesions in dermatoscopic images. It could be a suitable support for the diagnosis of skin melanoma, since dermatologists are interested in the analysis of the spatial relations, the symmetrical positions and the inclusion of regions. Key words: PCA, fuzzy C-means, clustering, color segmentation, topological features, dermatoscopic images
1. Introduction Color is one of the most significant features exploited for image segmentation: color clustering , color reduction and many other techniques have been proposed to divide images into meaningful patterns with similar color [2, 3, 6, 10, 15, 16]. Indeed, colorbased segmentation is often not enough to define regions of objects depicted in an image, since regions are characterized by other properties, first of all the connectivity of their points. Moreover, spatial relations between connected regions are further evaluated to achieve a better description of the segmented object. Thus, color clustering is often associated with other techniques for extracting connected regions and for representing spatial and topological relations between them, like region adjacency. The selection of which visual cues and relations should be outlined depends on the image content and the final applications. As well as the region adjacency, an important topological relation for image understanding is the inclusion propriety, that describes if all pixels labeled as Machine GRAPHICS & VISION
2
Exploiting Color and Topological Features for Region Segmentation with Recursive Fuzzy c-means
belonging to a region are included in a set of pixels of another region. For instance in dermatoscopic images, to improve the diagnosis of malignant melanoma on pigmented skin lesions, a very important task is to find meaningful regions of similar color and to evaluate their mutual relations. A benign lesion is often characterized by symmetric and uniform regions, symmetrically included each other in a concentric way. The lack of inclusion and symmetrical envelop of region could suggests the presence of a malignant melanoma. The inclusion property can be evaluated a-posteriori on regions obtained from a previously segmented image. Instead, in this work we propose a new method of color-based segmentation that exploits the inclusion propriety as the basic criterion to guide segmentation. The algorithm we propose is a recursive version of the fuzzy c-means (FCM) clustering in the 2D color space obtained after a suitable reduction of th color space by means of Principal Component Analysis (PCA). The goal of the process is to segment the image recursively, providing a dichotomic partitioning of the color space. In this coarse-to-fine segmentation, at each step two clusters of color are extracted with FCM, connected regions are labeled and are further analyzed in terms of mutual adjacency and inclusion. Regions included into others and with a not-negligible size are recursively evaluated. In this way we are not constrained to have a fixed number of clusters and thus of regions, but we can define termination criteria based on the requirements of focused analysis. For instance the segmentation could terminate when the region size is lower than a defined threshold, which bounds the smallest region of interest. We verified that the proposed approach could be a very suitable method not only for segmentation but also to provide an adequate representation method of the topological structure of the target object. The paper is structured as follows: in the next section we overview some related works of color clustering, especially the one proposed for dermatoscopic images, and of approaches to describe connectivity and topological features. In section 3 we define the terms used in the paper, and in particular the inclusion propriety. In section 4 we describe the algorithm step by step and show, in section 5, its applicability in the field of dermatoscopic images. Conclusions follow in section 6. 2. Related Work Many systems of computerized image analysis for melanoma diagnosis, that use shape features extracted by means of segmentation, have been proposed and developed [8]. However, as noted in [14], these features often do not correspond to known biological phenomena and do not model human interpretation of dermatoscopic imagery. Most works in the literature concentrated on the separation of lesion from background, since it is obviously a critical preliminary step in any analytic procedure. Grayscale thresholding [12], color clustering [6], edge-finding and non-linear diffusion [14] have been proposed,
Machine GRAPHICS & VISION
R. Cucchiara, C. Grana, S. Seidenari, G. Pellacani
3
while a metric for performance evaluation of the various techniques has been developed in [10]. Certainly, color is a key feature in dermatoscopic diagnosis (the third of the ABCD criteria presented in [11]) and color clustering is widely used [18, 6, 2]. Amongst the many different approaches proposed, fuzzy c-means (FCM) color clustering is often adopted: an example is the work of Schmid [16] that proposed a fuzzy c-means segmentation over the first two principal components of the color space for skin lesion images. The only drawback of Schmid’s proposal is that, lacking of spatial information, the number of classes is automatically obtained by a statistical evaluation of the histogram and fails to identify small color areas in the original image, being their pixels included in larger surrounding clusters in the histogram. Both in [16] and in [6] spatial information is ignored in the clustering phase, but is implicitly exploited during the preprocessing with median or median-like filtering. Spatial information together with color features usage, like in the standard ISODATA algorithm used in [15], has not been widely considered in the dermatological field [14]. In this paper we use a basic segmentation step similar to Schmid’s approach, but improved by means of the recursive and dichotomic clustering and included in a larger process of knowledge extraction. In fact the efficacy of segmentation is strictly related with the stage that immediately follows it, that is a structural description of the extracted regions and their relationships. The knowledge representation paradigm is strongly dependent on the model of the target and the application. For instance, graph based representations are exploited to describe complexes scenes, to recognize objects composed by several parts or to handle contentbased retrieval[21]; an example are adjacency graphs, in which nodes are regions and arcs are spatial relations. We achieve a similar representation using the inclusion relation as well. 3. Regions, adjacency and inclusion In this paper we aim to provide a segmentation into regions characterized by color similarity and to define an approach that highlights, in addition to region adjacency, another topological property, i.e. inclusion, as suggested by the dermatologists’ approach. Given an image space I = {x = (i, j), 1 ≤ i ≤ M1 , 1 ≤ j ≤ M2 } and a neighborhood system N = {Nx : x ∈ I}, where Nx ⊂ I is a set containing the neighbors of x, we define the following: Def. 3.1. R ⊂ I is a connected region (region for short) if ∀ x, y ∈ R, ∃ X ⊂ I : X = (x1 , . . . , xn ) ⇒ xi ∈ Nxi+1 ∧ x1 = x ∧ xn = y. 8 Commonly 8-connection is adopted: N(i,j) = {(l, m) ∈ I : |l − i| ≤ 1 ∧ |m − j| ≤ 1}. As noted before, segmentation is often provided by a clustering algorithm: the goal is to divide the image into a number c of clusters; points of the same cluster are alike in the sense that they share a similar visual property f (x), as for instance color. Machine GRAPHICS & VISION
4
Exploiting Color and Topological Features for Region Segmentation with Recursive Fuzzy c-means
In addition, segmentation aims toT partition the image into a set of regions R = S {R1 , . . . , Rk } such that Ri = I and Ri = ∅. Therefore the clustering process should embed or be followed by an analysis of the spatial relationships between points, according with the given neighborhood system. Then if the spatial and/or topological relations between regions must be described, often a graph-based representation is exploited . An example is the adjacency graph [7], a graph G(V, E) whose vertexes are the image regions (V ≡ R) and whose arcs show the adjacency property, that is a neighborhood system at region level. In this context adjacency is defined as follows: Def. 3.2. A region Ri is adjacent to Rj ⇔ ∃ xi ∈ Ri , xj ∈ Rj : xj ∈ Nxi . In addition to connectivity and adjacency, we aim to evaluate inclusion of a region into another, thus we need to formally define inclusion between regions. First, we consider an “extended” set of image regions R = R ∪ {R0 }, being R0 a dummy region representing the external boundary of an image. Then, we define the inclusion property as follows: Def. 3.3. A region Ri ∈ R is included in Rj ∈ R ⇔ @P = {R1 , . . . , RN } : R0 ∪ N S Ri ∪ Rn is a connected region ∧Rj ∈ / P. n=1
This definition means that is not possible to draw a path of connected points between region Ri and the end of the image space (R0 ) that doesn’t include points of Rj . It should be noted that this definition of inclusion does not imply a direct relation between inclusion and adjacency. That is, a region Ri included into Rj is not necessarily adjacent to it. Moreover a transitive property holds for inclusion: if Ri is included into Rj and Rj into Rt , than Ri is included into Rt . This assumption leads us to use the inclusion property to analyze the interior of a region with no worries about its internal subdivision (adjacency or further inclusions). 4. Color and inclusion-based image segmentation In this section we define our algorithm in details. The approach can be applied on whichever color image but we take as a reference the dermatoscopic images described in the figures. An initial preprocessing task is performed to improve the segmentation, followed by PCA and then the recursive FCM. 4.1. Preprocessing In order to obtain a smoother outline for regions and to suppress details that are useless for the color area segmentation and sometimes only introduced by the acquisition process, we first convolve the image with a Gaussian kernel with standard deviation of one pixel. Then, since we want to obtain results similar to the dermatologist perception of color, after calibration with commercial tool supplied by the acquisition system, we transform
Machine GRAPHICS & VISION
5
R. Cucchiara, C. Grana, S. Seidenari, G. Pellacani
(a) Original image
(b) 1st component
(d) 3rd component
(c) 2nd component
(e) 2D histogram
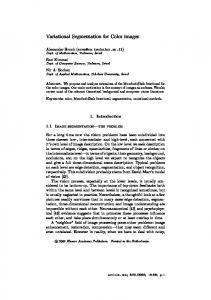
Fig. 1. Principal Component Analysis applied on a skin lesion.
our images from the original RGB color coordinates into CIE L∗ a∗ b∗ color coordinates [5], a uniform color space in which equal distances mean almost equal perceived chromatic difference. Working in a uniform color space gives us a more reliable metric for the clustering phase. 4.2. Principal Component Analysis The diagnosis of pigmented skin lesions, regarding color properties, relies on no more then a dozen color classes, and this hints that a color reduction method can be used having no worries about masking relevant properties. A common way used for the reduction of the feature space dimensionality, is to discard components with less discriminating power by projecting data onto principal components with the Karhunen-Lo`eve transform, also called Hotelling transform or Principal Component Analysis [4]. This transform consists of the projection of the data vectors to be reduced on the eigenvectors of their covariance matrix, computed using the following equations: M 1 X xk M
(1)
M � 1 X xk · xTk − mx · mTx M
(2)
mx =
k=1
Cx =
k=1
Machine GRAPHICS & VISION
6
Exploiting Color and Topological Features for Region Segmentation with Recursive Fuzzy c-means
where M is the number of data samples xk and mx is their mean vector. We define a matrix A whose rows are the eigenvectors of matrix C ordered by decreasing eigenvalue. The PCA of vector x is then defined by y = A · (x − mx ) . (3) In our case the three components (L∗ ,a∗ ,b∗ ) are to be reduced to just two components and the samples are the image pixels. Processing with PCA does not change the uniformity of the chosen color space [16]. The motivation for the choice of PCA is twofold: first we eliminate image noise that could affect segmentation. In fact our goal is to cluster similar colors and we aim to neglect small variations; second the dimensionality reduction benefit, from the computational complexity point of view, will increase because FCM will be repeated many times. This results are in accordance with [13]. We then discard the third component of the transform and rescale and quantize the first two components to 256 levels in order to store each transformed pixel in a byte-type variable. From this two components a 2D histogram is computed and used for the next steps. In Fig. 1 an example of Principal Component Analysis is shown, with it’s corresponding 2D histogram in Fig. 1(e). The third component (Fig. 1(d)) usually contains poor data and most of the image noise [13], so it makes sense to discard it while keeping the first two (Fig. 1(b), 1(c)) in order to obtain a more reliable measure. 4.3. Fuzzy c-means clustering The fuzzy c-means (FCM) algorithm is a robust clustering technique, especially efficient for cluster center computation [2, 19, 20]. Being c the number of classes, we use the following two recurrent equations [16]: c X Uik = 1 +
2
kxk − vi k
2
kxk − vj k
j=1 j6=i
M P
vi =
1 ! m−1
−1
(4)
m
(Uik ) · xk
k=1 M P
(5) m
(Uik )
k=1
where Uik is the fuzzy membership of xk to class i and vi is the ith class center. The weighting exponent m defines the fuzziness of the membership values. When m = 0 the formula defines a crisp clustering, while a growing value of m increases the fuzziness. Details of characteristics and properties of the FCM algorithm can be found in [2] and in [3].
Machine GRAPHICS & VISION
R. Cucchiara, C. Grana, S. Seidenari, G. Pellacani
7
4.4. FCM into 2 clusters in the 2D color space For our application, with only two clusters to segment at each step, it is useful to explicitly write the equations for the fuzzy membership. Using a weighting exponent m = 3, the equation is simplified as follows: U1k =
kxk − v1 k , kxk − v1 k + kxk − v2 k
(6)
U2k = 1 − U1k . (7) In Eq. 7, it is possible to note the effect of the normalization as an aid to the computational requirements of the algorithm, since the membership of the second cluster is directly obtained after the evaluation of the first one. This computational simplification is important to achieve a final region segmentation (after many recursive steps) in acceptable times for a suitable human interface. 4.5. Recursive FCM exploiting inclusion and adjacency cues The definition of recursive FCM has been inspired by the biomedical context, in which often images contain target objects that have to be distinguished from the background, objects that should be then further analyzed. With reference to the dermatoscopic application, the main idea behind structuring the region decomposition of the lesion with a dichotomic process derives from the observation that the pixels group easily into two clusters, one brighter, corresponding to the healthy skin and the other darker, corresponding to the lesion. Iterating the same concept on the lesion’s interior can provide us with an informative view of its internal structure. Color is evidently the main clinical criterion in this type of analysis; however, a blind segmentation in multiple, differently colored areas could lead to segmentation into areas of poor interest (see Fig. 3(d), where the area corresponding to the healthy skin has been improperly split into several parts). At the end of the segmentation, we will able to construct a tree (that we could call a topological tree or TT ) whose nodes are regions and whose arcs represent the inclusion property. A region has as many sons as the number of regions included in itself. Regions at the same level are not included each other, but are included in the same father. They can be adjacent but of different color or of the same color but not touching each other. An example of the structure that derives from this algorithm is shown in Fig. 3(h). The algorithm is described as a recursive construction of a tree: outer regions extracted after FCM are not further evaluated: regions of connected pixels belonging to the inner cluster are instead recursively divided into a coarse-to-fine clustering. The process ends when a termination condition on the area of the regions is met. The tree construction follows a recursive procedure that starts with the analysis of the PCA 2D histogram of the current set of pixels (called P in the algorithm of Fig. 2), Machine GRAPHICS & VISION
8
Exploiting Color and Topological Features for Region Segmentation with Recursive Fuzzy c-means
node AnalyzePixelSet (PixelSet P, node N) { for each C in ConnectedComponents(P) { if (Area(C)