moving average (EWMA) control chart experienced a kind of rebirth in the ... the above three papers use the average run length (ARL) exclusively for the.
Statistical Papers manuscript No. (will be inserted by the editor)
Fast initial response features for EWMA Control Charts Sven Knoth1 Europa-Universit¨ at Viadrina, Postfach 1786, D-15207 Frankfurt(Oder)
Received: date / Revised version: date
Abstract
The exponentially weighted moving average (EWMA) control
chart became very popular during the last decade. It is characterized by simple handling and good performance. It turns out, however, that the most popular EWMA scheme with fixed-width control limits – the asymptotic control limits are taken and do not change over time – detects early changes rather slowly. For the competing CUSUM chart the so-called fast initial response (head-start) feature is developed which permits rapid response to an initial out-of-control situation. Meanwhile, in some papers similar modifications for EWMA schemes are described. We compare these approaches by using precise computation techniques, which are based on numeric quadrature rules and allow higher accuracy than earlier studies. Moreover, previous comparisons are restricted to the evaluation of the detection speed by comparing the average run lengths (ARLs), that is, the
2
Sven Knoth
parameter of interest is constant during the whole monitoring period. Here, we consider more possible change point locations, which gives the EWMA control chart user a better insight into the scheme performance for early changes.
1 Introduction
In Statistical Process Control (SPC) one usually applies methods which are developed in order to detect changes in the sequence of observed data. These procedures are known as control charts (the standard phrase in SPC), surveillance, monitoring, and change point detection schemes etc. With Hunter (1986) and Lucas & Saccucci (1990) the exponentially weighted moving average (EWMA) control chart experienced a kind of rebirth in the field of SPC. Papers by Waldmann (1986), Crowder (1987), and Lucas & Saccucci (1990) – the approach due to Robinson & Ho (1978) works poorly for the more interesting cases – allow to assess the EWMA performance with high precision. Roberts (1959) introduced the EWMA control chart for monitoring the mean level in a sequence {Xn } of independent random variables (Xn may be a sample statistic as well, e. g., the sample mean) in the following way (here, we are assuming unit variance of Xn ).
Zn = (1 − λ)Zn−1 + λXn
, n = 1, 2, . . .
, Z0 = z0 ,
n o p p L = inf n ∈ N : |Zn − µ0 | > c λ/(2 − λ) 1 − (1 − λ)2n .
(1) (2)
Fast initial response features for EWMA Control Charts
3
The random variable L is the number of observations (samples) until the chart generates a signal. The EWMA scheme triggers such a signal whenever Zn falls outside the range of the control limits µ0 ± c σZ,n which are written in a standardized form. The critical value c is multiplied by the standard deviation σZ,n of the current EWMA value Zn . Recall that 2 σZ,n = var(Zn ) =
¢ λ ¡ λ 1 − (1 − λ)2n → for n → ∞ . 2−λ 2−λ
(3)
Note that the standard computation methods for evaluating EWMA charts are developed for fixed-width control limits, i. e. based on the asymptotic limit c
p λ/(2 − λ), instead of the time-varying limit in (2). It is well known,
however, that EWMA schemes with fixed-width limits behaves inert in the beginning of the monitoring process. Additionally, sometimes it is necessary to make the detection scheme more sensitive for the first time points, as is recommended in Lucas & Crosier (1982) for CUSUM control charts. E. g., after restarting the control chart following an alarm and checking the monitored system one is interested to know instantaneously whether the process returned under statistical control. Therefore, in Lucas & Saccucci (1990) a similar fast initial response (FIR) feature for EWMA schemes is introduced. Note that the FIR version of Lucas & Saccucci (1990), which is a composite scheme consisting of two one-sided EWMA charts, is equivalent to one univariate two-sided EWMA chart. In the discussion of the latter paper MacGregor and Harris (1990) remember, that it would be reasonable to use the variance adjusted limits in (2). Furthermore, Montgomery (1991) indicates, that the control limits should be variance adjusted because of the
4
Sven Knoth
stronger influence of the starting value z0 at early time points (it decreases as time n marches on). The usual way to deal with this problem is to apply the varying limit scheme with the scheme parameter values derived for the fixed-width limits scheme. Simulations show that the influence of the replacement on the in-control behavior is small, at least for λ larger than 0.1. Finally, in Chandrasekaran, English & Disney (1995), Rhoads, Montgomery & Mastrangelo (1996), and Steiner (1999) the problem is explicitely addressed and solved by applying approximation methods. In the first and the third of the papers the parameter c is directly calculated for the varying limits scheme by using a Markov chain approach. The second paper is based on Monte Carlo simulations. The precision of these approaches is worse for varying limits than for fixed-width limits.
Unfortunately, the most precise numeric approaches, which are based on numeric quadrature rules (Crowder 1987, Waldmann 1986), could not be applied straightforwardly in the case of varying control limits. In Knoth (2002) ideas of Woodall (1983) and Waldmann (1986) are extended to deal with these varying limits. Here, we use this method to compute the properties of different EWMA schemes with FIR features very precisely. Besides, the above three papers use the average run length (ARL) exclusively for the evaluation of FIR EWMA schemes. That is, they focus on a situation where the parameter of interest (mostly the mean) is constant during the whole monitoring period. Here we expand the evaluation procedure by considering arbitrary time points of a possible parameter change.
Fast initial response features for EWMA Control Charts
5
In the next section, the change point model is formulated in more detail and some performance measures of control charts are listed. Then in the following section, we introduce the six different EWMA schemes under consideration. Finally, we compare all these schemes for the most popular choice λ = 0.1.
Here we conclude that there is no obvious best scheme. For users who are interested in fast detection of a change at the very first time point only, the modification due to Steiner (1999) would be the best one. If the first time positions, say about 10, are important, then the FIR features of Lucas & Saccucci (1990) or Rhoads et al. (1996) are the first choice. If no special location of the change point is specified, then the so-called stationary or the fixed-width limits EWMA chart should be taken. However, one has to be aware that the most sensitive FIR schemes (Rhoads et al. (1996) and Steiner (1999)) provide high early false alarm rates – above 10 % probability that an alarm is given during the first (in-control) observations. The original EWMA scheme in (2), finally, seems to be a good compromise between all these demands. Therefore, it is the exclusive decision of the particular user of an EWMA scheme, which scheme has to be preferred. Eventually, if one uses prior information as, e. g., a prior distribution for the change point (cf. Fris´en & Wessman (1999)), then our results can be transferred as well.
6
Sven Knoth
2 Change Point Model and Performance Measures
For assessing control charts one has to declare which change point model the considerations are based on. Here, we assume independent and normally distributed random variables Xi , i = 1, 2, . . .. For ease of presentation the following simple change point model is utilized.
Xi ∼
N (µ0 = 0, σ 2 = 1)
i c∗ .
8
Sven Knoth
Usually, z0 is set to µ0 = 0. 2. Variance-adjusted control limits EWMA chart (vacl) – also known as time-varying control limits EWMA chart (which is a more general phrase as one can see in the next paragraphs) with more complications in evaluating the scheme. The related stopping time Lvacl is the same like our L in (2). As for the fcl EWMA chart, z0 is set to µ0 = 0. 3. FIR EWMA chart (fir) – first introduced in Lucas & Saccucci (1990) as a coupling of two one-sided EWMA schemes with appropriate choice of z0 (= µ0 +
c∗ 2
=
c∗ 2
frequently) in (1). More precisely, let Znu and Znl
denote the EWMA statistics of the upper and lower scheme, respectively, where frequently z0u = −z0l ≥ 0. Then o n ª © Lfir = inf n ∈ N : max Znu , −Znl > c∗ .
Actually, the FIR EWMA chart is a univariate scheme as the previous ones. The following link between both sequences Znl and Znu can be observed. With ∆0 = z0u − z0l ≥ 0
Znl = Znu − (1 − λ)n ∆0 , n £ ¤o / − c∗ + (1 − λ)n ∆0 , c∗ . Lfir = inf n ∈ N : Znu ∈
Thus, the FIR EWMA chart is equivalent to a univariate EWMA scheme with one fixed and one varying limit. 4. FIR EWMA chart with variance-adjusted control limits (fvacl) – introduced in Rhoads et al. (1996). By using the findings in the pre-
Fast initial response features for EWMA Control Charts
9
vious paragraph the scheme can be written as follows. n Lfvacl = inf n ∈ N : p p ¤o £ Znu ∈ / − c∗ 1 − (1 − λ)2n + (1 − λ)n ∆0 , c∗ 1 − (1 − λ)2n . A natural choice of z0 might be µ0 +
c∗ 2
p
1 − (1 − λ)2 =
c∗ 2
p
λ (2 − λ),
i. e. the half distance from µ0 to the first upper control limit. 5. FIR adjusted variance-adjusted control limits EWMA chart (fadj) – presented in Steiner (1999). n ³ ´o p Lfadj = inf n ∈ N : |Zn | > c∗ 1 − (1 − λ)2n 1 − (1 − f )1+a(n−1) . The quantities a and f are further scheme parameters, where Steiner ¡ ¢ set a = − 2 log(1 − f ) − 1 /19 (log with base 10) and finally preferred f = 0.5 (→ a = 0.3). The parameter z0 is chosen as for fcl and vacl EWMA chart, that is, equal to µ0 = 0. 6. Stationary EWMA chart (stat) – simple idea, which was sometimes utilized without introducing a new EWMA scheme. The only difference to the fcl scheme is a separate treatment of the first observation. p X1 λ/(2 − λ) ,n = 1 Zn = , (1 − λ)Zn−1 + λXn , n > 1 © ª Lstat = inf n ∈ N : |Zn | > c∗ . var(Zn ) = λ/(2 − λ) ∀n ∈ N . Thus, the scheme has no (head-start) value z0 , possesses fixed-width control limits, and is variance stationary.
10
Sven Knoth
Naturally, there are further modifications. E. g., the coupling of two onesided EWMA charts with one reflecting border (cf. Yashchin (1989) for this EWMA scheme type) allows the usage of head-starts as well. However, the corresponding combined scheme looks more complicated than all of the above schemes and it is rather difficult to assess its performance without using Monte Carlo simulation studies or twodimensional Markov chain approaches. Further modifications like double EWMA-charts or combined EWMA-Shewhart-charts, e. g., were initially introduced in order to provide better chart performance about a whole range of mean shifts. These and other ”non-FIR” EWMA-charts are not considered for the sake of clarity of the comparison study.
4 Comparison study
Note that the following computations are based on the results in Knoth (2002). Essentially, recursions of the density function of the EWMA statistics Zn are calculated using Gauss-Legendre quadrature (with 100 roots) until approaching the steady-state (at least approximately). For details and a list of references dealing with similar ideas confer to Knoth (2002). There is only one assumption, which the above EWMA charts have to fulfill: asymptotic homogeneous transition kernels, i. e. asymptotic constant control limits in terms of the current paper. In all schemes under consideration this condition is fulfilled.
Fast initial response features for EWMA Control Charts
11
Recall that the in-control mean µ0 is set to 0. The smoothing constant λ is chosen as 0.1, which provides considerably fast detection of small shifts for all schemes. The head-start parameters in the FIR schemes are set to z0u = c∗ 2
and z0u =
c∗ 2
p
λ (2 − λ) for the fir EWMA chart (Lucas & Saccucci 1990)
and the fvacl EWMA chart (Rhoads et al. 1996), respectively. The remaining scheme parameters in case of Steiner’s EWMA chart (fadj) modification are chosen as mentioned above. Finally, the last free scheme parameter, the critical value c, is determined in order to provide an in-control ARL E∞ (L) of 500. Thus, the following critical values in Table 1 have to be plugged in.
Table 1 Critical values providing in-control ARL E∞ (L) = 500 for λ = 0.1
EWMA scheme
fcl
vacl
fir
fvacl
fadj
stat
c
2.8143
2.8239
2.8415
2.8858
2.9131
2.8215
First, we compute the (out-of-control) Average Run Lengths (ARL) E1 (L) and the steady-state ARLs D as performance measures for a change point m = 1 and m À 1, respectively. In Table 2 we observe that the values in the first and the last column (fcl and stat) provide the largest ARLs, while the values are decreasing for vacl → fir → fvacl → fadj, i. e. Steiner’s approach has the best out-of-control behavior for m = 1. Otherwise, for large m, the fixed-width limits schemes (fcl and stat) and the vacl EWMA chart perform the best. However, the differences between the schemes are smaller when measuring the long run performance.
12
Sven Knoth
Table 2 Out-of-control ARL E1 (L) (upper entry) and steady-state ARL D (lower entry) for different shifts µ1 , in-control ARL E∞ (L) = 500
EWMA scheme µ1 0.5
1.0
1.5
2.0
3.0
4.0
fcl
vacl
fir
fvacl
fadj
stat
31.3
28.8
24.8
22.9
21.6
29.3
30.6
30.9
31.4
32.8
33.6
30.8
10.3
8.21
6.98
5.46
4.78
8.69
10.1
10.2
10.3
10.5
10.7
10.2
6.08
4.17
3.90
2.52
2.19
4.56
5.99
6.01
6.06
6.17
6.24
6.01
4.36
2.66
2.75
1.60
1.45
2.91
4.31
4.32
4.35
4.42
4.47
4.32
2.87
1.51
1.81
1.09
1.07
1.57
2.85
2.86
2.87
2.91
2.94
2.85
2.19
1.12
1.34
1.01
1.01
1.13
2.20
2.20
2.21
2.24
2.26
2.20
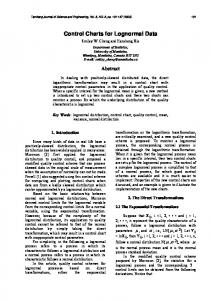
Now, we look at 1 < m ¿ ∞, i. e. the short or mid run behavior. Hence, we consider the conditional delays Dm = Em (L − m + 1|L ≥ m). In Figure 1 Dm is plotted for m = 1, 2, . . . , 40. Remember that the smaller Dm the faster a change point at time point m can be detected. For m = 1 and m = 40 we observe the same order between the schemes as in Table 2 for the ARL and the steady-state ARL, respectively. If we look at Steiner’s scheme fadj, however, then we notice, that it is the best one for m = 1 and
Fast initial response features for EWMA Control Charts
13
11 10 9
Dm
8 7
fcl vacl fir fvacl fadj stat
6 5 4 0
5
10
15
20
25
30
35
40
m
Fig. 1 Conditional delays Dm = Em (L − m + 1|L ≥ m) , m = 1, 2, . . . , 40 for EWMA schemes with λ = 0.1, in-control ARL E∞ (L) = 500, out-of-control mean µ1 = 1
m = 2, second best for m = 3, third for m = 4, and finally the worst scheme for m ≥ 10. Otherwise, the fir EWMA scheme provide for a considerable broad range (4 ≤ m ≤ 25) the best performance. Remember that the fir EWMA chart is a special case of fadj (f = 0), so that by decreasing f (which is one of three parameters of Steiner’s scheme) one can improve Steiner’s scheme. If we decrease f , however, then the performance for m = 1 becomes worse. Furthermore, the schemes with the best long run behavior, fcl, vacl, and stat, need the most time among all schemes for detecting early changes. While for the standard fcl and for the stat EWMA chart (exception m = 1) Dm is nearly constant, the vacl scheme detects faster changes before m = 17 and m = 23 than fcl and stat EWMA schemes, respectively.
14
Sven Knoth
Eventually, we conclude that Steiner’s modification provides the best sensitivity for m = 1 , the fir EWMA chart for 1 < m ¿ ∞, and the stat and the fixed-width limits EWMA schemes for large m. Note that the worst case behavior of an EWMA scheme is influenced by the overall largest width of the continuation region of the chart. That is, regarding the critical values in Table 1 one has to be aware, that now the fcl EWMA chart is the best scheme and Steiner’s fadj is the worst one. The modifications of EWMA schemes influence the in-control behavior of the scheme too. Higher sensitivity for early changes also increases the probability of early false alarms. It is surprising that neither Rhoads et al. (1996) nor Steiner (1999) mentioned the high probability of early false alarms. It is very simple to compute P∞ (L = 1), where even these values are quite high. In Figure 2 and Table 3 the related values P∞ (L = n) of the PMF are drawn. The most sensitive schemes, fvacl and fadj, possess with P∞ (L = 1) = 11 % Table 3 Probabilities for early false alarms – E∞ (L) = 500
EWMA scheme
fcl
vacl
fir
fvacl
fadj
stat
P∞ (L = 1)
0.0000
0.0047
0.0003
0.1125
0.1452
0.0048
P∞ (L = 2)
0.0000
0.0040
0.0038
0.0217
0.0435
0.0025
P∞ (L = 3)
0.0000
0.0034
0.0068
0.0109
0.0190
0.0022
P∞ (L ≤ 10)
0.0063
0.0293
0.0551
0.1742
0.2391
0.0238
and = 14 %, and P∞ (L ≤ 10) = 17 % and = 24 %, respectively, very large false alarm probabilities in the beginning of the observation process. Oth-
Fast initial response features for EWMA Control Charts
0.008
15
fcl vacl fir fvacl fadj stat
0.007 0.006
P∞( L=n )
0.005 0.004 0.003 0.002 0.001 0 0
5
10
15
20
25
30
35
40
n
Fig. 2 In-control PMF P∞ (L = n) for EWMA schemes with λ = 0.1, in-control ARL E∞ (L) = 500
erwise, the related values of the fixed-width limits EWMA scheme are very small. Note that the stat EWMA scheme provides values close to a true geometric distribution. Moreover, for n = 1 the vacl and the stat EWMA scheme are equivalent, so that both values P∞ (L = 1) nearly coincide (the small difference is due to different critical values). Similar results are published in Margavio, Conerly, Woodall & Drake (1995), where the fixed-width and the variance adjusted control limits EWMA schemes are evaluated by using the false alarm rate P∞ (L = n | L ≥ n) for different time points n. These authors include a further EWMA scheme with constant false alarm rate as an illustration. While for this special scheme a lot of different critical values have to be computed (for λ = 0.1 about 15 values), our stat EWMA scheme provides a nearly constant false alarm rate (for n > 1) with
16
Sven Knoth
a very simple setup. Additionally, the consideration of the detection rate Pm (L = m | L ≥ m) could be useful. Finally, we want to mention the surprising shape of the PMF graph of the fir EWMA chart (see Figure 2). The peak is located at n = 4 and not – as one might expect after looking at the other schemes with FIR features – at n = 1. For larger λ only, say λ = 0.4 and larger, the peak is at n = 1 at last.
5 Conclusion According the comparison study, a good compromise between early detection power and low early false alarm rate is the vacl EWMA scheme, i. e. the EWMA control chart with variance adjusted control limits (cf. MacGregor & Harris (1990) and Chandrasekaran et al. (1995)). Thus, Roberts’ original EWMA scheme seems to be the most appropriate one. The so-called stat EWMA scheme, however, provides the most balanced performance. Note that the above study is based on the most ”natural” choices of the scheme parameters. Further tuning these constants may lead to different conclusions. Anyway, in the light of simplicity of the scheme setup our conclusions seem to be reasonable and justified.
References Chandrasekaran, S., English, J. R. & Disney, R. L. (1995). Modeling and analysis of EWMA control schemes with variance-adjusted control imits, IIE Trans-
Fast initial response features for EWMA Control Charts
17
actions 277: 282–290. Crowder, S. V. (1987). A simple method for studying run-length distributions of exponentially weighted moving average charts, Technometrics 29: 401–407. Fris´en, M. & Wessman, P. (1999). Evaluations of likelihood ratio methods for surveillance. Differences and robustness, Commun. Stat.–Simula. 28(3): 597– 622. Hunter, J. S. (1986). The exponentially weighted moving average, Journal of Quality Technology 18: 203–210. Knoth, S. (2002). EWMA schemes with non-homogeneous transition kernels, submitted to Sequential Analysis . Lucas, J.-M. & Crosier, R. B. (1982). Fast initial response for CUSUM qualitycontrol schemes: Give your CUSUM a head start, Technometrics 24(3): 199– 205. Lucas, J. M. & Saccucci, M. S. (1990). Exponentially weighted moving average control schemes: Properties and enhancements, Technometrics 32: 1–12. MacGregor, J. F. & Harris, T. J. (1990). Discussion of: Exponentially weighted moving average control schemes: Properties and enhancements (by Lucas & Saccucci). Margavio, T. M., Conerly, M. D., Woodall, W. H. & Drake, L. G. (1995). Alarm rates for quality control charts, Stat. Probab. Lett. 24: 219–224. Montgomery, D. C. (1991). Introduction to Statistical Quality Control, 2nd ed. John Wiley & Sons, New York, NY. Rhoads, T. R., Montgomery, D. C. & Mastrangelo, C. M. (1996). Fast initial response scheme for exponentially weighted moving average control chart, Quality Engineering 9: 317–327.
18
Sven Knoth
Roberts, S. W. (1959). Control-charts-tests based on geometric moving averages, Technometrics 1: 239–250. Robinson, P. B. & Ho, T. Y. (1978). Average run lengths of geometric moving averages by numerical methods, Technometrics 20: 85–93. Steiner, S. H. (1999). EWMA control charts with time-varying control limits and fast initial response, Journal of Quality Technology 31(1): 75–86. Waldmann, K.-H. (1986). Bounds for the distribution of the run length of geometric moving average charts, J. R. Stat. Soc., Ser. C, Appl. Stat. 35: 151–158. Woodall, W. H. (1983). The distribution of the run length of one-sided CUSUM procedures for continuous random variables, Technometrics 25: 295–301. Yashchin, E. (1989). Weighted cumulative sum technique, Technometrics 31: 321– 338.