The Norwegian Computing Center. Fault. Facies. Volumetric fault zone modeling using fault facies. Department of. Earth Science. Department of. Mathematics ...
Fault Facies
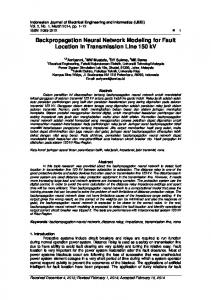
Tveranger, J.1) , Cardozo, N.1) , Kjeldaas, G.C.1) , Nøttveit, H.1) and Røe, P.2) + Fault Facies Facies project team
Volumetric fault zone modeling using fault facies
1) 2)
Center for Integrated Petroleum Research, University of Bergen, Norway The Norwegian Computing Center
Department of Earth Science Department of Mathematics
Impressions
Descriptions of deformed rock volumes
Uncertainty?
Business end of structural geology
Very uncertain fault zone properties
Fault impact on reservoirs
Displacement of stratigraphy (seismic/subseismic scale)
Modification of the initial properties and structures inside a volumetrically expressed fault envelope
Zonation (e.g. core, damage zone) Recurring structural features (fractures, lenses, membranes) Changes in petrophysical properties
Hangingwall damage zone
Fault core
Footwall damage zone
Background fracturing
Fossen et al.
Fault modeling practice
Seismic interpretation – fault plane/fault sticks
Grid displacement (except sub-seismic faults)
Impact on fluid flow is included in the simulation model using transmissibility coefficients across grid splits. These can be derived from:
History matching of model using production data Specialized software applications (HAVANA™, Juxtaposition™, TransGen™, a.o.) calculating permeability across fault planes as a function of lithology and displacement
Problematic features
Petrophysical modelling
Communication between nonnonjuxtaposed cells
3D fluid flow inside fault envelope
Drilling hazards
Severe limitations for explicit representation of the geology of the fault zone!
Shortcomings Observations
Model representation
Seismic scale faults exhibit complex architectures
Faults as planes with displacements of model grid
Fault related changes in rock properties occur throughout a volume of host rock (fault envelope)
Fault related spatial property changes in volume surrounding faults commonly not included
Flow through faults is a result of how these petrophysical changes are distributed in the fault affected rock volume
Fluid flow through faults approximated as 2D effect. Flow along faults and between reservoir zones with no juxtaposition can only be modeled deterministically (i.e. ”best guess” guess”)
Consequences for simulation model • Actual 3D flow inside and through fault zones is not captured • In-place volumes may be overestimated • Fault sealing is simplified by handling fault zones as homogenized at any given position along the fault plane • Communication along faults can not be forecast as the fault description does not include a Perm Z description. It can only be set ad hoc using history matching (no predictive value) •Discrepancy between observed well behavior and modeled behavior is often assigned to fault impact (makes it impossible to distinguish between effects caused by the sedimentary model and the structural model) – contribution of model components (sedimentological and structural) to overall model uncertainty can not be properly evaluated
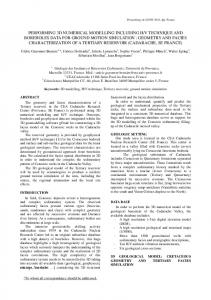
Model scales & modeled elements Tectonic features
Sedimentary features Vertical scale (m)
Vertical scale (m) 1000
1000
100
100
Interpreted fault displacements from seismics
Seismic scale
1
Geological model
0.1
beds
0.1
0.01
0.01 laminae 0.001 0.001
0.01
0.1
1 10 100 Horizontal scale (m)
Adapted from Pickup & Hern (2002)
1000
10000
Sim.model Fault zone elements
0.001 0.001
FF
Geological model
lenses
1
10
membranes
paraSim.sequences model
Sub-seismic scale
fractures/slip surfaces
10
Fault zone widths
0.01
0.1
1
10 100 1000 10000 Horizontal scale (m) (Read as thickness for fault zone elements)
Reservoir model scale is not inherently adapted for fault zone modeling; Current practice skips scales. Present fault modeling is largely dictated by software limitations Using facies as building blocks for fault zone architectures may be a means to bridge the gap and enable industrial reservoir models to incorporate more detailed geological descriptions of fault zone properties FF=Fault Facies: Informally defined as any feature or body of rock with properties derived from tectonic deformation
The Fault Facies project; aims
Develop a method for explicit representation of fault structure in reservoir models
Concept and technical solution
Feasibility/compatibility
Test methodology and identify performance critical elements in model setup
Identify strengths and limitations of the method
R&D cooperation CIPR, NR, Roxar, University of Bergen, the University Centre on Svalbard and industry
30 senior researchers post docs and PhD students + 8 master students
Sub-projects comprising basic and applied research in
structural geology reservoir engineering mathematics software development rock physics reservoir modelling
Fault Facies
Fault zone models Required elements
Volumetric representation of fault envelope (i.e. FZ grid) in reservoir model
Description and classification system for elements occurring inside fault envelope and their petrophysical properties under given sets of boundary conditions
Conditioning factors for position and distribution of fault facies inside the fault envelope; room for complex displacement trends
UpUp-scaling methods
Sedimentary facies
Fault Facies with petrophysics
Deformation boundary conditions
As for sedimentary facies, fault facies can be applied on any model scale defined by the user; facies definitions can be adapted to the available data and purpose of the model
Approach
Develop an improved method for fault modeling within the framework of existing industrial modeling tools in order to ensure an easy incorporation of the new method into standard industrial modeling workflows and practices
Grid design and Software adaptation
Fault rock properties
TECHNICAL FRAMEWORK
FAULT FACIES DATABASE
Geo-modeling and simulation
Scope of study limited to normal faults in siliciclastic rocks
Strain modeling
CONDITIONING PARAMETERS
Grid design IRAP-RMSTM, HAVANATM, ECLIPSETM
HAVANA
Conventional grid
Define and extract fault zone Perform stretching Refine grid (optional) Merge with original
Fault Facies Grid
Can be used as integral part of or add-on to any RMS model
Fault facies grids are XY regularized corner point grids: no need to adapt grid stringently to interpreted fault planes No/few deformed cells in grid
Deterministic element of interpreted fault plane position eliminated; position of maximum displacement inside fault zone determined by strain modelling
Moves uncertainty from position of max displacement to margin of fault zone
Fault facies in geo-modelling
All techniques used for modeling of sedimentary facies can be applied to the FF grid Indicator simulation Object based modeling Petrophysical properties Trend functions Conditioning parameters
Modelling of fault facies can be performed at any scale and any level of detail as defined by user and available data
PermZ
PermX
PermY
“Grey matter” model with anisotropic permeability field in fault zone
Differentiated properties for fault rocks from surrounding formations
Highly detailed FF model with fault rock lenses
Geological input Outcrop analogues Empirical databases
Stochastic modelling approach
Define case specific elements
Statistic models
FF types FF properties
Strain modelling tools
Geometry Dimensions Frequency distribution Petrophysical properties
Trends and conditioning parameters
Displacement distribution inside fault envelope Strain distribution Intra-facies petrophysical property trends
Adapted from Fredman et al submitted
Geological input Fault facies petrophysical props
Petrophysical trend patterns
100 000,00
10 000,00
Tveranger et al in prep 10 000,00
Chile Tayieba mines
Tinyperm
1 000,00
Wadi Kahboba Wadi Isaila Bartlett fault 100,00
Permeability
1 000,00
Horizontal Perm
100,00
Vertical perm
Navajo SST
10,00
10,00
1,00 0,0
1,0
Host rock
2,0
3,0
4,0 Category
5,0
Fault facies
6,0
1,00 0,00
7,0
5,00
10,00
15,00
20,00
25,00
Distance from fault
1 000,00
100,00
Even very simplified input and data with high variability help to constrain the model
10,00
Permeability
V/H 1,00 0,00
Distance between DB's 5,00
10,00
15,00
0,10
0,01
0,00 Distance from fault
20,00
25,00
DBdist/(V/H) (V/H)/DBdist
Strain modeling using HavanaTM
Cardozo et al submitted
Used as tool for testing conditioning methodology + Operates on structured corner point grids User defined width of fault zone Yields comparable results to more advanced tools FAST Displacement formula can be easily modified Restrictions as to mechanical layering
Conditioning the distribution of fault facies
Original model with FF grid
Database derived or user defined functions
Strain modelling tool
Displacement function
Strain distribution
Sedimentary facies F1
User defined facies and properties
Fault facies intensities
F1
F12
F11
F2
F22
F21
F2
X
Adapted from Fredman et al submitted
Fault Facies vs. Strain distribution
=
FF model workflow Conventional geo modelling
Gridding
Fault facies modelling loop Fault zone
FF-Gridding
Facies
FF-Facies
Petrophysics
Petrophysics
FF intensity parameters
Fault trans.calc. Combine grids
Flow simulation
Conventional rendering
Fault zone with fault facies
Simulation
Host rock Facies Sand Shale
Log(Kx) Log(Ky) Log(Kz) Poro 5.0 ± 0.5 5.0 ± 0.5 2.0 ± 0.5 0.20 ± 0.02 1.5 ± 0.7 1.5 ± 0.7 0.5 ± 0.3 0.05 ± 0.03
For details see Soleng et al. 2007
Fault Facies Sand 1 Sand 2 Sand 3 Sand 4 Shale 1 Shale 2 Shale 3 Shale 4
Illustration case Synthetic model 2200m x 2200mX 300 m Cell dimensions 20 X 20 X 20 Single fault 0-100 m displacement One injector in HW one producer in FW Rate controlled prod. and inj. Simulation time 5600 days FF grid 120 m wide Two Host rock facies Eight fault facies 100 model realizations
Log(Kx) 5.0 ± 0.7 4.3 ± 0.5 3.2 ± 0.5 2.0 ± 0.5 1.5 ± 0.7 1.4 ± 0.5 0.0 ± 0.5 -1.4 ± 0.5
Log(Ky) 5.0 ± 0.7 2.5 ± 0.5 1.5 ± 0.5 0.8 ± 0.5 1.5 ± 0.7 0.5 ± 0.5 -0.8 ± 0.5 -2.0 ± 0.5
Log(Kz) 2.0 ± 0.3 4.1 ± 0.5 3.0 ± 0.5 1.8 ± 0.5 0.5 ± 0.3 1.2 ± 0.5 -0.1 ± 0.5 -1.6 ± 0.5
Poro 0.20 ± 0.03 0.20 ± 0.05 0.15 ± 0.04 0.10 ± 0.03 0.05 ± 0.03 0.03 ± 0.012 0.02 ± 0.008 0.01 ± 0.007
Water cut vs. time
FF model Fault zone 12 cells wide 30 cells high
Upscaled FF model 1 Fault zone 6 cells wide 15 cells high
Upscaled FF model 2 Fault zone 1 cell wide 15 cells high
Conventional model With trans. mult. No fault zone For details see Soleng et al. 2007
Oil production rate vs. time
GOR vs. time
Strengths and limitations of FF modeling; status
Strengths Geo-realistic rendering of structural elements in fault zone in geo and simulation models Method integrated into standard reservoir modeling workflows Flexible - Can be used on any scale and adapted to available data and user requirements Allows well conditioning of model Uncertainty handling using standard stochastic facies modeling methods Potential for modeling and forecasting fluid flow inside fault envelope Provides a clear separation between deformed and undeformed parts of the reservoir Potential for Improved uncertainty evaluation Improved risk assessment when drilling faults
Current limitations Incomplete databases on fault facies descriptions and properties Systematic empirical links between strain distribution and fault facies need to be established Insufficient knowledge about up-scaling methods to be used on volumetrically rendered fault rocks Sensitivity mapping of parameters and assessment of artifacts in FF type models still incomplete CPU cost for large, high detailed models
Upcoming activities
Geophysical conditioning and seismic signature of fault facies models models (pilot study)
Fault zone properties (continued from FF I) Expand existing FF databases through lab and field studies Characterization of Fault Facies of different reservoir rocks
Fault process studies Strain modelling Havana, Trishear, (DEM), Fault zone evolution, Stress modelling Deformation impact on porosity and permeability
Reservoir modelling and simulation Workflows and software development Virtual reality Analogue models, case studies and synthetic tests Strain & fluid flow MPFA Adaptive gridding vs regular cornerpoint grids – impact on fluid flow CO2/leakage (case studies?)
UpUp-scaling techniques for FF
Full field test model
Emerald Resolution 75X75X3 m Stratigraphic thickness 129 m Model 6.2 X 9.5 km
Thank you for your attention SEE ALSO: Fachri et al. Poster, this conference : Sensitivity of fluid flow to faulted siliciclastic reservoir configurations & Presentations by Braathen, Nøttveit and Schueller, This conference
Department of Earth Science Department of Mathematics