3282
IEEE TRANSACTIONS ON ANTENNAS AND PROPAGATION, VOL. 58, NO. 10, OCTOBER 2010
Frequency-Dependent FDTD Simulation of the Interaction of Microwaves With Rocket-Plume Kiyoshi Kinefuchi, Ikkoh Funaki, Member, IEEE, and Takashi Abe
Abstract—The ionized exhaust plumes of solid rocket motors may interfere with RF transmission under certain flight conditions. To understand the important physical processes involved, we measured microwave attenuation and phase delay due to the exhaust plume during sea-level static firing tests for a full-scale solid propellant rocket motor. The measured data were compared with the results of a detailed simulation performed using the frequency-dependent finite-difference time-domain ((FD)2 TD) method. The numerically derived microwave attenuation was in good agreement with experimental data. The results revealed that either the line-of-sight microwave transmission through ionized plumes or the diffracted path around the exhaust plume mainly affects the received RF level, which depends on the magnitude of the plasma-RF interaction.
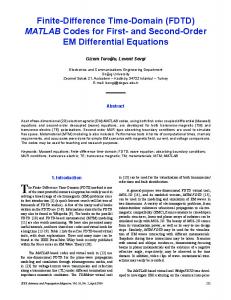
Fig. 1. Plume RF interaction in rocket flight. Solid rocket motor plume impedes microwave transmission.
Index Terms—FDTD, microwave, plasma, rocket.
I. INTRODUCTION XHAUST plumes from solid propellant rocket motors interfere with microwave transmission, as shown in Fig. 1, and such interference can result in failure of telecommunications, which could affect telemetry, command procedures, or the radar link between a vehicle and the ground-based antennas. This effect has been addressed in many papers [1]–[6] and is thought to be caused by the high-density plasma in the high-temperature exhaust of the motor, since solid propellant grains include low-ionization-energy elements such as sodium and potassium as impurities, which contribute significantly toward high-density plasma generation [7], [8]. Nevertheless, a satisfactory estimate of the attenuation level is still not agreed upon, though it is very necessary because exhaust plume RF interference can result in failure of launch vehicle telecommunications. With current technology, however, it is impossible to simulate the RF interference caused by the plume with simulations that take into account the details of all relevant processes. The reasons for this are as follows: (1) The plume plasma properties, plasma density, and electron collision frequency, all of which affect RF transmission, obey nonequilibrium ionization processes, which are affected by aluminum and aluminum oxide particles, alkali metal impurities, and chemical reactions
E
Manuscript received September 07, 2009; revised February 18, 2010, April 01, 2010; accepted April 02, 2010. Date of publication July 01, 2010; date of current version October 06, 2010. K. Kinefuchi is with the Department of Aeronautics and Astronautics, University of Tokyo, Tokyo 113-8656, Japan (e-mail:
[email protected]). I. Funaki and T. Abe are with the Institute Space and Astronautical Science, Japan Aerospace Exploration Agency, Kanagawa 229-8510, Japan (e-mail:
[email protected];
[email protected]). Color versions of one or more of the figures in this paper are available online at http://ieeexplore.ieee.org. Digital Object Identifier 10.1109/TAP.2010.2055796
Fig. 2. Antenna setup in the experiment.
of the propellant. Because such processes are not well understood, a satisfactory estimate of the plasma properties using theoretical solutions is difficult. (2) During a rocket flight, the microwave transmission path includes three-dimensional propagation through the plasma as well as diffraction and reflection. The numerical calculations for such microwave transmissions, in which all effects are taken into account, are not practical because numerous calculations are required. To develop a technique for estimating the attenuation level under real flight conditions, it is necessary to understand first of all the essence of the physics underlying the interactions. For this purpose, it is appropriate to investigate the interactions between the plume and microwaves in a static firing test. This is because the essence of the interaction mechanism is included in a simple plume-RF interaction configuration. Hence, in this study, we investigated the microwave transmission behavior during sea-level static firing tests conducted for a full-scale solid rocket motor. This was done by measuring the
0018-926X/$26.00 © 2010 IEEE
KINEFUCHI et al.: FREQUENCY-DEPENDENT FDTD SIMULATION OF THE INTERACTION OF MICROWAVES
3283
Fig. 3. Microwave attenuations and S-band phase delay measurement system in the experiment.
microwave attenuation and phase delays at three frequencies by using a simple antenna setup. For detailed investigation of EM field distribution around the plume, frequency-dependent finitedifference time-domain ((FD) TD) method would be extremely useful; however, it has not as yet been applied to rocket plume RF interactions. Accordingly, we first describe the (FD) TD method that we used for computational analyses of microwave transmissions during rocket motor firing, in order to achieve a more detailed understanding of this process. Then, we report on the experimental and numerical results, including approximately estimated plume plasma properties. Finally, the mechanisms of plume-microwave interference during the ground static firing test are discussed with the (FD) TD simulation results.
Fig. 4. Picture of experiment during motor firing.
II. EXPERIMENTAL SETUP AND RESULTS The microwave attenuation experiments were conducted during static firing tests on a full-scale solid rocket motor [9]. Three microwave frequencies generally used in space communications were selected: S-band, 2.3 GHz; C-band, 5.6 GHz; and X-band, 8.5 GHz. Horn-type antennas were adopted for both the transmitter and receiver in order to achieve high directivity. The motor was positioned horizontally, and the antennas were placed on the motor test site facing each other across the motor plume, as shown in Fig. 2. The heights of the antennas were adjusted such that they were positioned along the center of the axis of the motor nozzle. Fig. 3 shows the system for measuring microwave attenuation and phase delay. The microwaves with each of the three frequencies were received and finally downconverted to 10 kHz and then recorded on a digital data recorder with a sampling rate of 48 kHz. The attenuation was evaluated by comparing the received microwave levels before and during the motor firing. For the phase delay measurement, the S-band signal from the oscillator was divided and its phase was periodically varied by using a phase shifter. The phase-delayed signal was combined with the signal received by the receiver antenna and the synthesized signal was recorded. The phase delay data were obtained by analyzing the waveform or hum of the recorded signal. A picture taken during the experiment is shown in Fig. 4. Fig. 5 shows plots of the received microwave voltage ratio for the three frequencies (not in the dB scale), the S-band phase
Fig. 5. Experimental results: microwave attenuations, phase delay and chamber pressure (S-band, 2.3 GHz; C-band, 5.6 GHz; X-band, 8.5 GHz).
delay, and the combustion chamber pressure (non-dimensionaland ized by the maximum chamber pressure of the motor). are the microwave voltages received before and during firing, respectively. In this paper, the term “attenuation” is defined as . It can be seen in Fig. 5 that low-frequency microwaves are highly attenuated during the initial 90 s. This frequency dependence of attenuation is in accordance with the characteristics attributable to the plane wave-slab plasma interaction theory [10], [11]. In addition, there is an apparent relationship between the
3284
IEEE TRANSACTIONS ON ANTENNAS AND PROPAGATION, VOL. 58, NO. 10, OCTOBER 2010
voltage ratios and the chamber pressure because the plasma density distribution in the plume changes with decreasing chamber pressure [9], [12]. For approximately 20 s before the end of the firing (90–110 s in Fig. 5), it is observed that large attenuations and large phase shift appear and that the frequency dependence of attenuation changes.
TABLE I INPUT PLUME PLASMA PROPERTIES FOR (FD) TD CALCULATION
III. FREQUENCY-DEPENDENT FDTD The solid rocket motor exhaust plume includes plasma that causes RF interference. Although there are some efficient methods to solve the interaction between plasma and radio waves [13], we would like to clarify detailed microwave fields and propagation characteristics and to expand the developed method to the actual rocket flight configuration as a next step. Therefore, in order to analyze microwave transmission through such plasma, we have developed the (FD) TD method calculation code [14], [15]. The electric field update equation for the plasma region is expressed as (1) where
where is the electron collision frequency, is the electron is the time step size. The two plasma plasma frequency, and properties ( and ) are required for the (FD) TD simulation so that they are estimated by using the measured voltage and applying the plane wave-slab plasma interacratios tion theory [10], [11] as follows:
(2)
where is the microwave frequency, is the speed of light, and is the distance the wave travels in the plasma. Both (1) and (2) are based on Drude dispersion model. On deriving these equations, thermal particle motion is ignored to assume a cold plasma, which is to say that the thermal electron speed is much less than the speed of light. Applying this equation to the experimentally derived voltage ratios, the spatially mean plasma properties in the plume can be calculated. In order to estimate them,
Fig. 6. FDTD calculation model for rocket plume microwave interaction.
the experimentally derived voltage ratios for two microwave frequencies at least are required because variables to be found from and . We obtained voltage ratios for three (2) are two, microwave frequencies in the experiment. Therefore, the early period and the middle period values were determined by using the received voltage ratios of all the three frequencies and minimizing the error between measured and calculated voltage ratios. On the other hand, the values for the last period were calculated by using only the C-band and X-band voltage ratios since (2) is not appropriate for the S-band. The reason for this treatment will be given later. We assumed and the rocket nozzle exit diameter are approximately identical based on following two reasons: (1) Microwaves mainly take the shortest course to the receiver through the center of the plume, i.e., travel on the LOS (Line-Of-Sight). This consideration will be proved to be correct except in the last period of S- and C-band transmission as explained in the next section. (2) The plume diameter almost equals the nozzle exit diameter of the motor (1.7 m) under atmospheric conditions. In Fig. 5, the attenuation of each frequency changes dynamically with time; hence, the firing period is subdivided into three periods: the early period (10–20 s), the middle period (40–50 s) and the last period (95–105 s). The measured voltage ratios were averaged for each period before substituting to (2) in order to reduce the received noise mainly generated by the flow turbulence in the plume [7]. The estimated plasma properties in each period are summarized in Table I. The (FD) TD simulation model for microwave-rocket plume interaction is shown in Fig. 6. The simulation is two-dimensional and the shape of horn antennas and the ground asphalt are included in the model for the calculation. The plasma properties ( and ) in Table I were inputted for the plume region. The plume diameter in the calculation was the same as the nozzle exit diameter and the plasma distribution was spatially uniform, in accordance with the method used for estimating the values
KINEFUCHI et al.: FREQUENCY-DEPENDENT FDTD SIMULATION OF THE INTERACTION OF MICROWAVES
Fig. 7. Example of received signals at the receiver antenna for S-band before firing and in the early period.
shown in Table I. Although the plasma actually has a nonuniform distribution in the plume, this effect to the microwave propagation is supposed to be small. This is because, in the present configuration, microwaves travel on the LOS in almost all cases. In fact, we can expect that under this condition, the total attenuation in the plume for the nonuniform distribution case is the same as the one for the uniform distribution case. In order to confirm this expectation, we conducted (FD) TD simulation with nonuniform plasma distribution [16]. The result showed that the nonuniform effect to the EM field around the plume is negligible as expected when microwaves travel mainly on the LOS. Furthermore, afterburning layer effect due to mixing with surrounding air at the plume boundary is negligible because the antennas were located near the nozzle exit where the layer has not developed significantly [9]. The Mur second-order absorbing boundary condition is applied to the four sides of the computation space. The size of simulation region is 21 12 m, which is large enough to neglect the effect of the boundary reflection. The simulation grid is square and for the entire grid , where is the microwave wavelength. The time step is selected to satisfy the Courant criterion. The calculations were conducted for the 3 frequencies (S-, C-, and X-band) and 4 periods (before firing, early period, middle period, and last period). These 12 FDTD simulations were separately performed from the start of the microwave radiation at the transmitter through the receiving at the receiver.
3285
Fig. 8. Numerical S-band E distribution before firing and contour legend.
Fig. 9. Numerical S-band E distribution in the early firing period.
Fig. 10. Numerical S-band E distribution in the middle firing period.
IV. CALCULATION RESULTS An example of received signals at the receiver antenna for S-band before firing and in the early period is shown in Fig. 7. The origin of x-axis corresponds to the start of microwave radiation from the transmitter and the microwave reaches at the receiver about 48 ns. The received levels keep constant after receiving. The voltage ratios were found using these constant values. Figs. 8–11 show the calculation results for the S-band wave transmission ( distribution) before firing, in the early period, in the middle period, and in the last period, respectively. In these figures, the absorbing boundaries are not displayed for the sake of simplicity. The color distribution of these figures was adjusted to facilitate observation of interference fringes. The same color distribution is used for all the figures, therefore
Fig. 11. Numerical S-band E distribution in the last firing period.
the contour legend is shown only in Fig. 8. In Figs. 9 to 11, we can note that the radiated wave interferes with the exhaust plume located at the center of the calculation region. There are interference stripes above the plume, and between the plume
3286
IEEE TRANSACTIONS ON ANTENNAS AND PROPAGATION, VOL. 58, NO. 10, OCTOBER 2010
Fig. 12. Comparison of the voltage ratio between the experimental results and the FDTD results.
Fig. 13. S-band E distribution on the transmitter-plume core-receiver line.
and the ground. These stripes are caused by diffraction around the plume and reflection from the ground asphalt. When we compare these results with the calculation results without the ground, the effect of the ground reflection on the received level is found to be almost negligible. A summary of the comparison of experimental and numerical results for all three frequencies is shown in Fig. 12. The experimental and numerical results show good agreement. Hence, the calculation accuracy is good enough to allow a discussion of the detailed processes associated with microwave transmission. The S-band electric field distributions of the early period and the last period on the line running through the transmitter, the plume core and the receiver are shown in Fig. 13. The attenuation level of the S-band when it passes through the plume is much greater in the last period than in the early period. In the last period, the microwave level slightly increases behind the plume. This level recovery is caused by the wave bypassing around the plume, which is the result of diffraction. The plume diffraction effect increases as plume attenuation gets stronger. In the last period, the microwave hardly penetrates the plume and the diffraction effect becomes stronger due to a large attenuation so that the diffraction effect dominates the level of the received signal. In the case of the early period, however, recovery by diffraction was hardly observed, as shown in Fig. 13, because the plasma penetration path is dominant.
Fig. 14. X-band E distribution on the transmitter-plume core-receiver line.
On the other hand, in the case of the X-band, there is no level increase behind the plume in the calculation results as shown in Fig. 14 so it can be assumed that the magnitude of the diffraction is smaller for the higher frequency case. This is because the higher frequency waves are associated with high directivity and low interference with plasma. The difference in the frequency dependence of attenuation in the last period (90–110 s in Fig. 5), would be caused by appearance of the diffraction path. The phase delay of the S-band gradually increased in the last period in the experiment, as shown in Fig. 5. Generally, phase of microwaves advances through plasma, while diffraction effect elongates the wave path length and causes phase delay. Therefore, the phase delay observed in the experiment was caused by the diffraction around the plume. A quantitative discussion regarding the phase shift on the basis of experimental data and (FD) TD results would be difficult because of the following two reasons: (1) The experimental data includes relatively large erdegrees). (2) The plume size, plasma distriburors (about tion, and so on were approximated in the (FD) TD simulation, as explained in Section IV. The latter approximation strongly affects the phase shift, especially in the diffraction case, because it is very sensitive to the diffraction path length around the plume. Hence, in order to discuss the propagation mode, we estimated the phase advance by applying the plane wave-slab plasma interaction theory [9], [10]. The equation expressing the phase advance through the plasma is
(3)
Fig. 15 shows the comparison of the phase advance as determined by the theory and the FDTD results. The values in the early period and the middle period agree well; hence, it can
KINEFUCHI et al.: FREQUENCY-DEPENDENT FDTD SIMULATION OF THE INTERACTION OF MICROWAVES
3287
ACKNOWLEDGMENT This study was supported by many staff members of Japanese rocket motor testing and development. The authors would like to express their gratitude to all those who contributed to the testing. They are indebted to T. Kato, S. Tachikawa and H. Ogawa of the Institute Space and Astronautical Science for their valuable cooperation. REFERENCES
Fig. 15. Comparison of the phase advance according to the plane wave-slab plasma interaction theory and the FDTD results.
be concluded that the microwaves travel straight toward the receiver through the center of the plume in these periods. However, the values in the last period are different except for the X-band. This is because the phase delays of the S-band and the C-band in the last period were caused by not only propagation through the plume but also diffraction around it. Only the X-band shows good agreement even in the last period, which indicates that almost all of the X-band penetrated the plume, even in the last period. We used the voltage ratios of the C-band and the X-band to estimate the plasma properties shown in Table I in the previous section, because the S-band did not penetrate the plume in the last period and bypassed it. Diffraction would also affect the C-band transmission in the last period so that the plasma properties in that period would have some uncertainty. However, the uncertainty would be small because the (FD) TD results and experiment show good agreement as seen in Fig. 12. We can conclude that the estimated plasma properties shown in Table I are accurate enough for practical purposes. V. CONCLUSION For estimating plume plasma properties and understanding the essence of rocket plume RF interference, experiments involving the interaction between rocket exhaust and microwave transmission were conducted during a full-scale solid rocket firing test. Microwave transmission analysis using the (FD) TD approach was applied. The attenuation predicted by the (FD) TD calculations agrees well with the experimental results. The (FD) TD results indicated some interactions such as microwave attenuation through the plume and diffraction around the plume. Furthermore, the (FD) TD calculations revealed that when a higher plasma density is achieved in the plume, microwaves hardly penetrate the plume and bypass it, in other words, the diffraction effect becomes dominant. The diffraction effect changes the microwave path length to the receiver and causes the phase delay observed in both the experimental data and the numerical (FD) TD calculation results. In the low plasma density case, however, the penetration path becomes dominant and the plane wave-slab plasma interaction theory is useful for estimating the attenuation.
[1] T. Abe, K. Fujita, H. Ogawa, and I. Funaki, “Microwave telemetry breakdown caused by rocket plume,” in Proc. 31st AIAA Plasmadynamics and Lasers Conf., Denver, 2000, pp. 2000–2484. [2] D. E. McIver, Jr., “The radio frequency signal attenuation problem of rocket exhaust,” in Proce. NASA Conf. on Communicating Through Plasmas of Atmospheric Entry and Rocket Exhaust, 1964, pp. 167–179, Langley Research Center. [3] W. A. Wood and J. E. DeMore, “Microwave attenuation characteristics of solid propellant rocket exhaust products,” in Proc. AIAA 6th Solid Propellant Rocket Conf., WA, 1965, pp. 65–183. [4] F. A. Vicente, E. C. Taylor, and R. W. Phelps, “Analysis of flame effects on measured electromagnetic propagation date,” J. Spacecraft, vol. 4, no. 8, pp. 1069–1075, 1967. [5] F. P. Boynton and P. S. Pajasekhar, “Plume RF Interference Calculations for Space Shuttle,” 1978, NASA-CR-161099. [6] L. D. Smoot, “Causes of ionization in rocket exhausts,” J. Spacecraft, vol. 12, no. 3, pp. 179–183, 1975. [7] L. D. Smoot, “Rocket exhaust plume radar attenuation and amplitude/ phase noise,” J. Spacecraft, vol. 4, no. 6, p. 774, 1975. [8] E. L. Capener, J. Chown, J. E. Nanevicz, and L. A. Dickinson, “Studies on ionization phenomena associated with solid propellant rockets,” in Proc. Solid Propellant Rocket Conf., WA, 1965, pp. 65–182. [9] K. Kinefuchi, I. Funaki, H. Ogawa, T. Kato, S. Tachikawa, T. Shimada, and T. Abe, “Investigation of microwave attenuation by solid rocket exhausts,” in Proc. 47th AIAA Aerospace Science Meeting & Exhibit, FL, 2009, pp. 2009–1386. [10] J. Lawton and F. J. Weinberg, Electrical Aspects of Combustion. Oxford: Clarendon Press, 1969. [11] J. A. Blevins, R. A. Frederick, Jr., and H. W. Coleman, “An assessment of microwave measurement techniques in rocket exhaust applications,” in Proc. AIAA 32nd Aerospace Science Meeting & Exhibit, NV, 1994, pp. 94–0671. [12] L. D. Smoot and D. L. Underwood, “Prediction of microwave attenuation characteristics of rocket exhausts,” J. Spacecraft, vol. 3, no. 3, pp. 302–309, 1966. [13] J. R. Wait, “EM scattering from a vertical column of ionization in the earth-ionosphere,” IEEE Trans. Antennas Propag., vol. 39, no. 7, pp. 1051–1054, 1991. [14] R. J. Luebbers, S. Hunsberger, and K. S. Kunz, “A frequency- dependent finite-difference time-domain formulation for transient propagation in plasma,” IEEE Trans. Antennas Propag., vol. 39, no. 1, pp. 29–34, 1991. [15] J. L. Young, “A full finite difference time domain implementation for radio wave propagation in a plasma,” Radio Sci., vol. 29, pp. 1513–1522, 1994. [16] K. Kinefuchi, I. Funaki, T. Shimada, and T. Abe, “Numerical prediction of microwave-rocket plume interaction,” in Proc. Asian Joint Conf. on Propulsion and Power, Miyazaki, Japan, 2010, pp. 2010–144.
Kiyoshi Kinefuchi was born in Kanagawa, Japan, in 1978. He received the B.S. degree from the Tokyo Institute of Technology, Tokyo, Japan, in 2001 and the M.S. and Ph.D. degrees from the University of Tokyo, in 2003 and 2009, respectively, all in aerospace engineering. He has been an Engineer at the Space Transportation Mission Directorate, Japan Aerospace Exploration Agency, where he developed launch vehicles since 2003. His research interests include microwave propagation, plasma physics, thermo-fluid dynamics, and these applications for aerospace development.
3288
IEEE TRANSACTIONS ON ANTENNAS AND PROPAGATION, VOL. 58, NO. 10, OCTOBER 2010
Ikkoh Funaki (M’00) received the B.E. degree from Kyoto University, Kyoto, Japan, in 1990 and the M.E. and Ph.D. degrees from the University of Tokyo, Tokyo, Japan, in 1992 and 1995, respectively. During 1995 and 2001, he was a part-time Lecturer and then a Research Associate with the Institute of Space and Astronautical Science, Japan Aerospace Exploration Agency, Kanagawa, Japan, where he engaged himself in developing the microwave discharge ion engines. In 2001, he was a Lecturer with the University of Tsukuba, Tsukuba, Japan. In 2003, he joined the Department of Space Transportation Engineering, Institute of Space and Astronautical Science, Japan Aerospace Exploration Agency, where he is currently an Associate Professor. His current research interests are electric and other advanced spacecraft propulsion systems, plasma application in space, and space plasma physics.
Takashi Abe is a Professor with the Department of Space Transportation Engineering, Institute of Space and Astronautical Science, Japan Aerospace Exploration Agency, Kanagawa, Japan.