2 School of Engineering and Built Environment, Glasgow Caledonian University, Glasgow G4 0BA, UK. ABSTRACT. A novel approach to the modeling of sub- ...
FDTD Modeling of Fast Transient Currents in High Voltage Cables X. Hu1, A. J. Reid2, W. H. Siew1 and M. D. Judd1 1 2
Department of Electronic and Electrical Engineering, University of Strathclyde, Glasgow G1 1XW, UK School of Engineering and Built Environment, Glasgow Caledonian University, Glasgow G4 0BA, UK
ABSTRACT
1 INTRODUCTION
A novel approach to the modeling of sub-nanosecond partial discharge (PD) phenomena in high voltage cables is presented to illustrate the capabilities of the finitedifference time-domain (FDTD) simulation method for modeling transients and their effects measured at a distance. FDTD modeling computes the three-dimensional electric and magnetic fields throughout the simulation volume. This numerically intensive process has the advantage that time-varying quantities such as voltages and conducted currents can be recorded at any position within the model. For modeling PDs in cables, a current source is introduced within the insulating medium and its time-domain waveform defined using digitally sampled data from an actual PD current pulse measurement. High frequency current transformers (HFCTs) are commonly used for on-site detection and location of PD in HV distribution cables. The HFCT itself cannot be modeled directly using FDTD because its geometrical detail is too small for the FDTD mesh. However, a hybrid model can be implemented by recording magnetic field values on path enclosing a conductor, applying Ampere’s circuital law to determine the PD current and applying the responses of real HFCTs that have been characterized experimentally. The method for simulating localized insulation breakdown is presented, showing how this can be used to launch a PD pulse into a cable model and predict the output response of an HFCT some distance away. This process is illustrated through a parametric study of variations in the PD source parameters and by comparison of the data with the measured propagation properties of PD signals in an 11 kV EPR-insulated cable sample. Examples are also given in which the FDTD software is used to model time-domain reflectometry measurements that can be useful for locating damage within the same type of HV cable. Similar techniques could be applied to much larger insulation breakdown currents, for example, in gas switches.
Partial discharge (PD) is indicative of local defects within electrical insulation. If left to develop it could result in final breakdown of the insulation system. PD involves acoustic, optic, electric and chemical processes, any of which can be used to detect it. In terms of the electric process, PD will result in fast transient currents flowing through the insulation media and the currents can be captured via a PD sensor, such as a high frequency current transformer (HFCT) that is clamped around the earth termination of a cable. PD measurement using HFCTs has been widely carried out for power cables to monitor their insulation condition. Both PD detection and location can be realized. However, PD current pulses propagating along a cable from a PD source to a detection point undergo significant attenuation and distortion [1]. This can make it difficult to interpret the PD measurement results. To investigate the relation between the PD currents excited at PD sources and the PD measurement results from HFCTs in lab is challenging, since some defect types cannot easily be reproduced experimentally. Exploring this problem through modeling can potentially provide useful insight. The finite-difference time-domain (FDTD) method is a numerical electrodynamics method which was first applied to the modeling of PDs transient processes in 2000 [2]. Since then, researchers have used FDTD in studies including the modeling of PD in GIS [3], [4], PD in transformers [5], [6] and other electromagnetic problems in power systems [7] – [9]. FDTD has also been used to model PD in power cables, as reported by Pommerenke and colleagues: the sensitivity of directional coupling sensors used to couple PD signals from cable joints was evaluated in [10]; frequency dependent properties of a cable semiconducting layers were accounted for in FDTD simulations [11]; and PD propagation influenced by surrounding media for cables with different screen design was investigated in [12]. However, no comparable work has been seen on modeling HFCT-based PD measurement for cables. This may be due to the fact that too much fine detail is required for creating a physical representation of an HFCT (many turns of thin wire) in an FDTD model. In this paper, we propose a hybrid framework for applying FDTD modeling to HFCT-based PD measurement for high voltage cables. The principles of this approach could also be used in modeling PD-like transients in other high voltage and power devices.
Index Terms — Partial discharge, FDTD, Power cable, HFCT, Transfer functions
978-1-4673-1225-7/12/$31.00 ©2012 IEEE
260
2 FDTD METHOD
1. Measure ‘original’ PD pulses
FDTD is a computational electrodynamics modeling technique that can cover a wide frequency range in a single simulation. This makes FDTD particularly good for modeling broadband signals like a PD pulse. FDTD is based on numerically approximating and solving Maxwell’s equations. By gridding a finite region with a sufficient number of electric (E) and magnetic (H) field cells, Maxwell’s equations are solved in a time and space interleaved manner so that timedomain electromagnetic fields throughout the simulated region will be available. The cable’s semiconducting layers were represented using a 3-pole Debye model to simulate the frequency dependent material properties. Commercial software XFdtd and a Dell work station with Xeon CPU of 2.67 GHz and 12 GB RAM have been employed to carry out the FDTD modeling reported in this research.
3. Record magnetic fields
2. FDTD modelling of PD
5. Convert into HFCT’s output
4. Derive currents
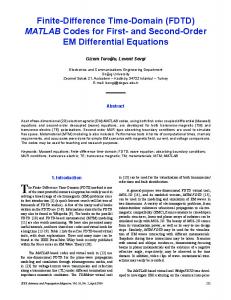
Figure 1. Framework for PD modeling in a high voltage cable. Step 1 is by experiments. Step 2-3 is FDTD modeling in XFdtd. Step 4-5 involves measurement of the HFCT’s complex transfer function and post processing to work out its voltage output.
measured respectively to construct the transfer function’s low frequency part and high frequency part. The FFT of the current data derived at step 4) was then multiplied by the HFCT’s transfer function and an inverse FFT was applied to determine the HFCT’s time-domain PD pulse output voltage. An illustration of the whole modeling diagram is shown in Figure 2. The cable model was based on the same 11 kV EPR cable sample from which the measured PD current pulses were obtained. The HFCT was a 5 V/A, 50 kHz – 20 MHz model according to its datasheet, but the measured transfer function indicated upper frequency limit was up to at least 50 MHz. The computed HFCT’s voltage output had some oscillation after the first pulse. The first pulse’s width at half magnitude was widened compared to that of the current pulse on the outer conductor because of the limited bandwidth of the HFCT used. In another test (not shown here) using a 5 V/A HFCT with a bandwidth up to 1.2 GHz, the current pulse waveform was preserved better (no oscillation) with only some magnitude decrease compared to the result from an ideal 5 V/A HFCT (with unlimited bandwidth).
3 MODELLING FRAMEWORK Direct output results from XFdtd are electric and magnetic field vectors at the gridding points throughout the simulated volume. However, it is PD-induced currents flowing on a cable’s outer conductor that actually pass through an HFCT’s aperture and determine its output voltage waveform. Since including the HFCT in the FDTD model has been ruled out for practical reasons, a hybrid approach to modeling of PD measurement for high voltage cables using HFCTs was developed. Figure 1 illustrates this approach, which includes five steps: 1) ‘Original’ PD current pulses were measured by ‘direct measurement’ method [13]. A needle was inserted through but kept isolated from the cable outer conductor to create a defect within a cable sample. The end of the needle was connected with a coaxial cable going to an oscilloscope using a 50 ohm input impedance. The cable was energized and PD current pulses resulting from the needle (like a protrusion defect extended from the outer conductor) were recorded. One of the recorded PD pulses will be shown later. 2) An FDTD cable model was created and one of the recorded PD waveforms from step 1) was used to define the excitation current as a data file within the model. Simulations were then carried out to characterize the effects of attenuation and distortion resulting from PD propagation along the cable. 3) A sensor loop was created out of point sensors around the outer conductor of the FDTD cable model. The point sensor is used to record magnetic fields at a certain point of a model. 4) The recorded magnetic fields from these point sensors were used to derive currents flowing on the outer conductor by using Ampere’s law. It should be noticed that it has to be the correct vector component at each point so that the numerical integration does sum the contributions to H around a closed loop. 5) An HFCT’s complex transfer function was obtained by simultaneously measuring the HFCT’s input and output and then dividing the FFT (fast Fourier transform) of the input by the FFT of the output. Step response and pulse response were
4 PARAMETRIC STUDY Using the same EPR cable model as that in the previous section, simulations were carried out to investigate induced current pulses on the cable’s outer conductor for different PD sources. As shown in Figure 3, two scenarios were considered. For both scenarios, PD was represented by a current source with a parallel impedance of 1 MΩ in XFdtd and the current was flowing in the radial direction in accordance with the radial electric field to which the insulation is subjected. Simulations were carried out for each PD source specification. Current pulses induced on the cable’s outer conductor were recorded and magnitudes of the pulses were plotted in Figure 4(a) against the PD source’s radial position and Figure 4(b) against the PD source’s length. Figure 4(a) shows that the magnitude of the current pulse on the outer conductor was generally decreasing with the PD source moving from the inner conductor towards the outer conductor. This result agreed with that reported in [14], which showed that, for excitation of the TEM mode, a PD source with constant path length would excite less propagating signal as it moved from the inner to outer conductor within a coaxial structure. Although [14] was concerned with PD in GIS, the
261
3&4. Current on outer conductor
1. PD source current
FFT 2. FDTD cable model
IFFT 5(b). HFCT’s voltage output 5(a). HFCT’s transfer function
Figure 2. Illustration of the whole modeling process. PD source current pulse was obtained by ‘direct measurement’ on an 11kV EPR cable sample. The FDTD cable model was for the same cable used in the ‘direct measurement’. Magnetic fields H were recorded by the sensor loop (red box around the extended outer conductor). The current pulse was derived by numeric integration of H around the closed loop. The HFCT’s complex transfer function was used - 5(a) shows its magnitude. Multiplying FFT of the current pulse with the HFCT’s transfer function and performing the inverse FFT gave the HFCT’s output voltage. Table 1. Magnitude ratio between TDR input and reflection
size: defect:
wire cylinder crush
3.5 mm
3.0 mm
2.5 mm
2.0 mm
1.5 mm
1.0 mm
3.0 2.0 1.5
524 73 -
917 147 73
1692 256 -
3492 458 256
564
results are related since both a cable and the GIS have coaxial conductors. Figure 4(b) shows that the current pulse magnitude increases with increasing length of the PD source. It should be mentioned that results for the PD radial positions of 13.5, 14, 18 and 18.5 mm and the PD lengths of 0.5, 1, 1.5, and 2 mm were investigated but are not plotted in Figure 4(a) and (b). Magnitudes of the current pulses from these PDs were much smaller than for the ones shown in Figure 4, which requires further investigation. Note that these PD sources generating unusual results were all within the semiconducting layers, at least to some extent.
Figure 5) extending from a cable’s outer conductor were considered. Table 1 shows the magnitude ratios between TDR input and reflection that were obtained for different defect sizes. A practical TDR test could probably resolve a reflection coefficient of 1000:1, so defects with a ratio higher than 1000:1 were considered undetectable.
6 DISCUSSION AND CONCLUSIONS A framework for modeling PD measurement in high voltage cables was proposed, which makes it possible to have some more insights into each stage of the measurement process. A parametric study shows the potential of determining coupling sensitivity between PD source currents and the corresponding PD currents on the cable earth conductor. Modeling of TDR measurement may help predict what kinds of mechanical defect sizes are measurable. FDTD’s capability in modeling fast transient currents can be summarized as follows: x FDTD simulation is well suited to the modeling of transient electrical phenomena because both E and H fields are available in the time-domain throughout the simulation space. x Discharges in insulating media can be represented as current sources, allowing the model to be used to infer a
5 MODELLING OF TDR MEASUREMENT Time-domain reflectometry (TDR) is a long-established method for fault location in cables. TDR is based on detecting impedance variation along a cable’s axial direction. If there is a mechanical defect somewhere along the cable it will alter the cable impedance at the defect region to be different from the inherent characteristic impedance. Therefore some of an incoming wave’s energy will be reflected by the defect due to impedance mismatch. Simulations were carried out to see TDR responses from different defects in cables, which may help suggest what kinds of defect sizes are measurable. Three conducting defects (a wire, a cylinder and a ‘crush’ shown in
262
systems in which the discharge or breakdown current cannot be measured directly for practical reasons.
semiconducting layers
ACKNOWLEDGMENT
insulation layer
EPSRC funding through grant EP/G029210/1 is gratefully acknowledged.
length
REFERENCES r=13.5mm R=19mm
[1]
inner conductor outer conductor [2]
(a) (b) Figure 3. Cross-section view of variations in PD source parameters. (a) A 0.5 mm PD source moving from inner towards outer. (b) A PD extending from the inner conductor, with PD length increasing from 0.5 mm until 5.5 mm short-circuiting the inner and outer conductor.
[3]
[4]
[5]
[6] (a) [7]
[8]
[9] (b) Figure 4. Peak magnitudes of the current pulses induced on the outer conductor by the PD source variations defined in Figure 3. (a) Radial movement of 0.5 mm PD source. (b) Lengthening PD source current path.
[10]
[11]
[12] Figure 5. Three kinds of conducting defects within the cable insulation. The three defects were simulated respectively, with various lengths. [13]
transfer function to a sensor some distance away. The converse should also be feasible, namely, that measurement of the sensor output may allow the model to infer the time-domain variation of an otherwise inaccessible measurand by using the computed reverse transfer function. x This capability could be applied to the study of other
[14]
263
S. Boggs, A. Pathak, and P. Walker. “Partial discharge XXII: High frequency attenuation in shielded solid dielectric power cable and implications thereof for PD location,” IEEE Electrical Insulation Magazine, 12(1):9–16, Jan/Feb 1996. M. D. Judd, “Using finite difference time domain techniques to model electrical discharge phenomena,” 2000 Annual Report Conference on Electrical Insulation and Dielectric Phenomena, Victoria, BC, Canada, 2000, vol.2, pp.518-521. S. Sakaguchi, M. Oyama, "Application of Maxwell solvers to PD Propagation. III. PD propagation in GIS," IEEE Electrical Insulation Magazine, vol.19, No.1, pp.6-12, Jan.-Feb. 2003. T. Hoshino, S. Maruyama, T. Sakakibara, “Simulation of propagating electromagnetic wave due to partial discharge in GIS using FDTD,” IEEE Trans. on Power Delivery, vol.24, No.1, pp.153-159, January 2009. A. J. Reid, M. Stewart, M. D. Judd, “FDTD modeling of UHF partial discharge sensor response,” International Conference on Sustainable Power Generation and Supply, 6-7 April 2009, pp.1-4. L. Yang, M. D. Judd, G. Costa, “Simulating propagation of UHF signals for PD monitoring in transformers using the finite difference time domain technique [power transformers],” 2004 Annual Report Conference on Electrical Insulation and Dielectric Phenomena, 17-20 Oct 2004, pp.410- 413. M. D'Amore, M. S. Sarto, "Theoretical and experimental characterization of the EMP-interaction with composite-metallic enclosures," IEEE Trans on Electromagnetic Compatibility, vol.42, No.2, pp.152-163, May 2000. B. U. Musa, W. H. Siew, M. D. Judd, "Computation of Transient Electromagnetic Fields Due to Switching in High-Voltage Substations," IEEE Trans. on Power Delivery, vol.25, No.2, pp.1154-1161, April 2010. K. Yamamoto, S. Yanagawa, K. Yamabuki, S. Sekioka, S. Yokoyama, "Analytical Surveys of Transient and Frequency-Dependent Grounding Characteristics of a Wind Turbine Generator System on the Basis of Field Tests," IEEE Trans on Power Delivery, vol.25, No.4, pp.30353043, Oct. 2010. D. Pommerenke, R. Jobava, R. Heinrich, “Electromagnetic Finite Difference Time Domain (FDTD) Modelling of Partial Discharge Coupling Applied to High Voltage Cables and Cable Joints,” 8th International Conference on Dielectric Materials, Measurements and Applications, Edinburgh, UK, Sep 2000, pp.497-502. R. Jobava, R. Heinrich, D. Pommerenke, W. Kalkner, A. Gheonjian, "Efficient FDTD simulation of fields in coaxial cables with multilayered insulation partially formed by dispersive layers of extremely high permittivity," Proceedings of the 7th International Seminar / Workshop on Direct and Inverse Problems of Electromagnetic and Acoustic Wave Theory, 2002, pp.91- 94. R. Papazyan, P. Pettersson, D. Pommerenke, "Wave propagation on power cables with special regard to metallic screen design," IEEE Trans. on Dielectrics and Electrical Insulation, vol.14, No.2, pp.409-416, April 2007. A. J. Reid, M. D. Judd, B. G. Stewart, and R. A. Fouracre. Partial discharge current pulses in SF6 and the effect of superposition of their radiometric measurement. Journal of Physics D: Applied Physics, 39:4161--4177, September 2006. M. D. Judd, O. Farish, B. F. Hampton, "The excitation of UHF signals by partial discharges in GIS," IEEE Trans on Dielectrics and Electrical Insulation, vol.3, No.2, pp.213-228, Apr 1996.