Proc. SPIE Conference Smart Structures and Materials 2003: Smart Systems and Nondestructive Evaluation for Civil Infrastructures, Vol. 5057, pp. 467-477, San Diego, CA, 2003
Full scale testing results of structural damage detection using long gage fiber Bragg gratings and modal analysis Sean Calvert*a, Joel P. Conte**b, Babak Moavenib, Whitten L. Schulza, Raymond de Callafonc a Blue Road Research; bDept. of Structural Engineering, cDept. of Mechanical & Aerospace Engineering, University of California, San Diego ABSTRACT Blue Road Research and the University of California have been collaborating over the past three years to develop a system employing fiber Bragg grating strain sensors and modal analysis to provide real-time, quantitative information on the structure’s response to a dynamic input (such as a seismic event), and a fast prediction of the structure’s integrity. This research, being funded by the National Science Foundation, has several publications showing its strong progress1-5. This year marks a significant step forward in this effort, with the successful completion of a full-scale test performed on a longitudinal carbon shell girder being tested as part of the planned I5/Gilman Advanced technology Bridge in California, USA. Keywords: Macroscopic strain, dynamic strain measurements, system identification, modal analysis, structural damage detection
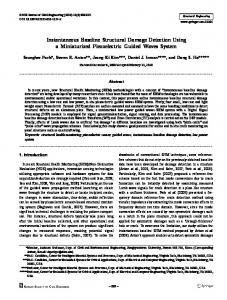
1. I-5/GILMAN ADVANCED TECHNOLOGY BRIDGE The I-5/Gilman Advanced Technology Bridge currently in planning consists of a 137m (450 ft) long cable-stayed bridge supported by a 59m (193 ft) high A-frame pylon (Figure 1). This bridge utilizes fiber reinforced polymer composite materials. In order to validate the design and evaluate the performance of the I-5/Gilman Advanced Technology Bridge, a Validation Test Program was conducted in the Charles Lee Powell Structural Research Laboratory at the University of California San Diego. The objectives of this prototype test program were to evaluate the manufactured FRP components at the material level, through coupon testing and other non-destructive techniques on the members, and at the element level on full-scale component, connection, and system tests6.
Figure 1. Elevation of I-5/Gilman Advanced Technology Bridge6 *
[email protected]; phone 1 503 667-7772; fax 1 503 667-7880; http://www.bluerr.com; Blue Road Research, 376 NE 219th Ave, Gresham, OR 97030-8419 **
[email protected]; phone 1 858 822-4545; fax 1 858 822-2260; http://kudu.ucsd.edu; University of California, San Diego, 9500 Gilman Drive, La Jolla, CA 92093-0085
Prefabricated carbon/epoxy shells filled with concrete form the longitudinal girders for the I-5/Gilman Advanced Technology Bridge. These cylindrical girder shells are 0.91m (3 ft) in diameter, 9.75m (32 ft) long, and to achieve ductile connection and system behavior, they are spliced together with mild steel reinforcement. The interfacial shear resistance between the girder and the deck is provided by shear stirrups embedded in the concrete core and protruding the composite shell through two rows of 51mm (2 in) diameter holes drilled along the top edge of the girder, see Figure 8. In regard to the longitudinal girder test program, a carbon shell specimen was cut into two equal halves, spliced together with mild steel reinforcement, and filled with concrete. The objectives of this test were to (1) determine the constructability of the steel-spliced girder and (2) demonstrate adequate ductility of the splice connection. Figure 2 shows the four point bend test setup of the spliced girder. 9.75m (32') 8.53m (28')
0.61m (2')
Gap
1.22 m (4')
76 mm (3")
0.254 m (10") 0.91m (3') Spiral Ø10" #4 Pipe
1.22 m (4')
0.349 m (13.75") 3.66 m (12')
Roller Fixture
Pin Fixture
2.74m (9')
3.05 m (10')
2.74m (9')
Figure 2. Schematic of test setup for girder test: Side elevation6
2. INSTRUMENTING THE FULL-SCALE LONGITUDINAL GIRDER The damage identification algorithm used in this program utilizes measurements of the structure’s response to a dynamic event. Fiber Bragg grating strain sensors were used to obtain these high-speed measurements. The advantages of fiber Bragg strain sensors over accelerometers is that they can directly measure the structures deflection at high speeds, resulting in a cleaner measurement than accelerometer data, which must be numerically integrated twice to obtain a deflection. The further advantage of the fiber grating sensor is its ability to provide longer gage lengths through special packaging2. This longer gage length (up to 1.5 meters) provides for a macroscopic measurement that is less susceptible to local stress/strain concentrations and provides a more representative measurement of the overall structure’s deflection. This test utilized four fiber grating strain sensors with 1 meter gage lengths. The fiber optic sensors (FOS) were surface mounted utilizing brackets1 with a pair of sensors located on the top and bottom at mid-span, and the remaining two on the bottom at approximately 1/3 the length on either side of mid-span (Figure 3 and 4). The sensors are pre-strained in their long-gage packages in order to measure compression as well as tension. In addition to the optical strain sensors, eight accelerometers were attached to the structure for verification purposes. Seven of these accelerometers were approximately equally spaced along the bottom edge of
the girder and one was mounted on the moving mass of the electro-dynamic shaker to measure the dynamic force applied to the structure. The technical characteristics of the accelerometers are: PCB model 393 A03, amplitude range: ± 5 g pk, frequency range (10%) 0.3 – 4000 Hz, resolution 5 × 10 −6 g pk, voltage sensitivity 1000 mV/g, excitation voltage 18 to 30 VDC. 336" Shaker
89"
50"
57"
77"
49"
Vertical Hammer Impact Locations
FOS#4
3
2
1
4
Elastic Pad Under Loading Fixture FOS#1
24"
64.3"
39.4"
FOS#2
44.6"
39.4"
FOS#3
72.6"
39.4"
36.3"
Figure 3. Locations of fiber optic sensors (FOS) and vertical hammer hits along the girder.
Figure 4. Long-gage fiber grating sensor surface mounted with brackets along bottom edge of girder.
24"
3. DEMODULATION SYSTEM The high-speed requirements of the test (approximately 1kHz) dictated the use of a high-speed fiber Bragg grating demodulation system. The system used employs a spectral filter to convert the spectral information from the Bragg grating into an amplitude-based signal measured by high-speed photodetectors. The unique challenge for this particular test was that the high-speed macro-strain measurement was in conjunction with the relatively large girder deflections from the four-point bend test. Of the two current options of spectral filters for the high-speed demodulation system, the chirped grating filter provides a wide measurement range at the expense of sensitivity, and the tunable grating filter provides high sensitivity with a more limited measurement range (Figure 5).
Figure 5. Comparison of spectral filters in the high-speed demodulation system. The chirped grating (left) provides a wide dynamic range and a lower sensitivity (change in amplitude per wavelength shift), while the tunable filter (right) provides high sensitivity with a lower dynamic range capability.
In order to maximize the sensitivity of the optical measurement, the tunable filter was chosen. This dictated a compromise in the testing; the sensors were removed during the quasi-static large deflection bending of the girder and replaced for the small displacement high-speed (dynamic) tests. As explained in Section 4, the dynamic tests were performed between sequences of quasi-static loading-unloading cycles. The four channel demodulation system is shown in Figure 6. A single broadband light source was used to illuminate all four grating sensors. To reduce the number of connections required, a coupler module was constructed that directed the input from the light source to each of the sensors and in turn directed the spectral reflections from the sensors to the spectral filters and the detectors.
Broadband light source
FBG 1
FBG 2
FBG 3
FBG 4 Tunable grating filters Figure 6. Four channel, high-speed fiber Bragg grating demodulation system
4. TESTING Testing of the composite longitudinal bridge girder was divided into two parts, namely quasi-static unidirectional cyclic loading (i.e., load-unload cycle), and the dynamic tests. After each of several sequences of quasi-static loading-unloading cycles, dynamic tests were performed in an attempt to track (through changes of the dynamic signatures) the damage developing in the structure. Prior to each set of dynamic tests, the “saddles” that apply the actuator loads to the girder were removed so that the beam would vibrate in its simply supported boundary conditions. Two methods were used to excite the structure dynamically, namely a computer-controlled electrodynamic shakera, and an impact hammerb. Each sequence of dynamic tests consisted of a set of forced vibration tests using a 50 lbs force electro-dynamic shaker shown in Figure 7, followed by a set of free vibration tests using an impact hammer shown in Figure 8. The forced vibration tests using the shaker consisted of a set of sixteen (Gaussian) white noise excitations followed by three (linear) sine sweeps in the frequency ranges [12 - 22 Hz], [38 - 48 Hz], and [93-103 Hz], which contain the first three beam natural frequencies. The free vibration tests using the impact hammer with integrated load cell consisted of three “vertical” impact tests at each of four locations along the top edge of the girder. From the fifth sequence of dynamic tests, which corresponds to damage state 4, a single “horizontal” impact test at each of four locations along the beam was performed.
a
The technical characteristics of the electro-dynamic shaker used in these experiments are: Manufacturer: APS Dynamics Inc., Model 113, Frequency range: 0 to 200 Hz, Maximum dynamic force: 42 lb.
b
The impact hammer used for these experiments has the following characteristics: Model PCB 086 C50, amplitude range 0-22 KN, mass 12 lbs, frequency range 0.5 kHz.
Figure 7. Electro-dynamic shaker strapped to the girder
Figure 8. Impact hammer test on the girder
5. DATA ANALYSIS AND RESULTS The beam’s response to dynamic excitation was measured by eight accelerometers and four fiber Bragg grating sensors for several damage states. As illustrative samples of measured data, accelerometer and fiber Bragg grating response time histories are shown in Figures 9 and 10, respectively. Dynamic characteristics of the beam such as modal frequencies, modal damping ratios, and vibration mode shapes and/or modal macro-strain vectors3, were identified from the accelerometer and fiber Bragg grating data using both non-parametric and parametric system identification methods. Each type of method was used for both accelerometer and fiber Bragg grating data. A finite element model of the structure was developed and used to validate the identified vibration natural frequencies and mode shapes of the undamaged structure (damage states 0 and 1). In reference to non-parametric system identification, transfer functions between input excitation and output measurements for both accelerometers and fiber Bragg grating sensors were estimated as the output to input ratio in the frequency domain for each input – output pair. The frequencies corresponding to the peaks in the transfer functions were identified as natural frequencies of the beam. A large ensemble of transfer functions was obtained by considering the two types of dynamic excitations and the multiple realizations of each type. Table 1 reports the mean and coefficient of variation of the ensemble of estimated natural frequencies obtained through non-parametric identification for the first four modes of vibration and damage states 0 to 6. It is observed that the coefficients of variations are very small, indicating that the estimated natural frequencies are precise. Two parametric system identification techniques were used, namely ARX model identification and state space realization. The modal parameters of the beam obtained from identified ARX and state space models are very close. The benefit of state space realization lies in its capability to isolate individual modes for their accurate identification using low-order models. State space models were estimated by first forming a Hankel matrix on the basis of the impulse response data (from hammer hit)7-8. Subsequently, the rank of the Hankel matrix was inspected by a Singular Value Decomposition. On the basis of a standard realization algorithm, a 12th order multivariable model with state space matrices A, B, C, and D, of a linear model was constructed that describes the dynamic behavior of the composite girder in terms of acceleration response measurements at locations along the bottom of the girder7-8. A 10th order multivariable state space model was constructed based on the measurements of the fiber Bragg grating sensors. The estimated modal frequencies, damping ratios, and vibration mode shapes of the girder were extracted from the identified state space matrix A based on either accelerometer measurements or fiber Bragg grating measurements. The modal frequencies and damping ratios estimated from the accelerometer measurements are given in Table 2 for the first four vibration modes at seven damage states. Damage states 0 and 1 characterize the state of the girder before the start of the quasi-static loading experiment and thus represent the undamaged state of the beam. The same modal parameters identified from fiber Bragg grating measurements are shown in Table 3 for damage states 1 through 5. It is noted that the modal identification results obtained from accelerometer data and fiber Bragg grating sensor data are in excellent agreement. The agreement is not as good for the modal damping ratios as for the modal frequencies. However, in system identification, it is well known that the estimation error is inherently significantly larger for damping ratios than for modal frequencies. The parametric system identification results in Tables 2 and 3 are also in very good agreement with the non-parametric results in Table 1. The first four mode shapes identified using accelerometer measurements (seven accelerometers along bottom of the girder) are plotted in Figure 11 for damage states 1, 3, 4, and 5. It is observed that the mode shapes do not vanish at the supports, which is probably due to the fact that the support structures are not rigid relative to the high stiffness of the girder. The first four modal macro-strain vectors3 identified using fiber Bragg grating sensor measurements are shown in Figure 12 for damage states 1, 3, 4, and 5. The fiber Bragg grating sensors are numbered as shown in Figure 3. As the damage level of the girder increases, the modal frequencies decrease as shown in Tables 1 through 3, and the mode shapes and modal macro-strain vectors exhibit changes. These changes in identified modal parameters (or modal features) can be used for the purpose of structural damage identification (i.e., damage detection, localization, and quantification). Application of damage identification techniques to this set of experimental data is underway.
Force [N]
15000 10000
Input Force
5000 0 −5000 −0.01
0
0.01
0.02
0.03
0.04
0.1 0
0.05
channel a2
−0.1 −0.2
Acceleration [g]
−0.2
0
0.2
0.4
0.6
0.8
0.2
channel a5
0 −0.2 −0.2
0
0.2
0.4
0.6
0.8
0.2
channel a8 0 −0.2 −0.2
0
0.2
0.4
0.6
0.8
Time [sec]
Figure 9. Input force and acceleration response histories at three channels for the first hammer hit at location 1 for damage state 1.
2
FOS # 1 0 −2 2
2.2
2.4
2.6
2.8
3
3.2
3.4
3.6
3.8
4
Macro−strain [micrometer]
2
FOS # 2
1 0 −1 2
2.2
2.4
2.6
2.8
3
3.2
3.4
3.6
3.8
4
FOS # 3
2 0 −2 2
2.2
2.4
2.6
2.8
3
3.2
3.4
3.6
3.8
2
4
FOS # 4
0 −2 2
2.2
2.4
2.6
2.8
3
3.2
3.4
3.6
3.8
Time [sec]
Figure 10. Macro-strain response histories for the first hammer hit at location 1 for damage state 1.
4
Table 1. Mean value and coefficient of variation of modal frequencies from non-parametric identification. 1st Mode Frequency
Damage State
State 0 State 1 State 2 State 3 State 4 State 5 State 6
2nd Mode Frequency
3rd Mode Frequency
4th Mode Frequency
Mean Frequency [Hz]
Coeff. of Variation [%]
Mean Frequency [Hz]
Coeff. of Variation [%]
Mean Frequency [Hz]
Coeff. of Variation [%]
Mean Frequency [Hz]
Coeff. of Variation [%]
17.12 17.07 16.16 15.57 15.31 15.19 14.43
0.1663 0.1980 0.1918 0.0955 0.0000 0.0000 0.6478
44.54 44.41 40.43 39.55 39.37 39.43
1.74508 1.73050 2.43322 1.45688 1.42461 1.65150
98.19 98.20 89.39 86.96 84.82 84.37 81.34
1.33168 1.18115 1.03051 1.40159 1.26747 1.17181 2.72796
167.85 168.00 158.82 153.56 143.63 143.43 142.91
0.56886 0.54627 0.53127 0.66549 1.17886 0.65503 0.78442
Table 2. Modal frequencies and damping ratios obtained through state space realization using accelerometer data for a single hammer hit. Damage State
State 0 State 1 State 2 State 3 State 4 State 5 State 6
Mode 1
Mode 2
Mode 3
Mode 4
Natural Frequency [Hz]
Damping Ratio [%]
Natural Frequency [Hz]
Damping Ratio [%]
Natural Frequency [Hz]
Damping Ratio [%]
Natural Frequency [Hz]
Damping Ratio [%]
17.37 17.37 16.13 15.41 15.20 15.06 14.15
1.47 1.47 1.55 1.51 1.23 1.24 1.39
43.70 43.57 40.96 39.26 39.04 38.95 31.64
3.14 4.86 2.92 2.00 2.22 2.95 3.47
97.62 97.72 89.44 86.98 84.93 84.65 80.28
1.72 1.73 1.97 1.61 2.04 2.79 1.74
167.69 167.84 158.79 153.27 144.10 143.22 142.86
0.78 0.82 0.90 1.42 3.41 0.90 2.12
Table 3. Natural frequencies and damping ratios obtained through state space realization using fiber Bragg grating sensor data for a single hammer hit. Damage State
State 1 State 2 State 3 State 4 State 5
Mode 1
Mode 2
Mode 3
Mode 4
Natural Frequency [Hz]
Damping Ratio [%]
Natural Frequency [Hz]
Damping Ratio [%]
Natural Frequency [Hz]
Damping Ratio [%]
Natural Frequency [Hz]
Damping Ratio [%]
17.37 16.09 15.34 15.10 15.02
1.58 1.63 1.48 1.48 1.29
43.64 40.67 38.95 38.27 38.72
3.81 2.27 1.39 2.80 2.58
97.24 88.93 86.74 84.87 82.78
1.57 2.16 1.69 1.51 3.19
167.46 158.46 152.81
0.89 0.97 0.91
143.19
0.95
0.8 dam. state 1 dam. state 3 dam. state 4 dam. state 5
0.6 0.4 Mode 1
0.2 42
86.5
127
177.5
0.2
210
249.875
294
210
249.875
294
210
249.875
294
210
249.875
294
Mode 2
0 −0.2 42
86.5
127
177.5
0.5
Mode 3
0 −0.5
42
86.5
127
177.5
0.5 Mode 4 0 −0.5 42
86.5
127
177.5
Distance from left support [in]
Figure 11. The first four vibration mode shapes identified from accelerometer data for impact test at various damage states.
−3
Damage State 5
Damage State 4
Damage State 3
Damage State 1
Mode 1
x 10
−3
Mode 2
x 10
−3
Mode 3
x 10
0.02
2
5
2
0
0
0
0
−0.02
1
2
3
4
−2
−3
x 10 1
2
3
4
−5
−3
x 10 1
2
3
4
−2
0.05
5
5
2
0
0
0
0
−0.05
1
2
3
4
−5
−3
x 10 1
2
3
4
−5
−3
x 10 1
2
3
4
−2
0.05
5
5
2
0
0
0
0
−0.05
1
2
3
4
−5
−3
x 10 1
2
3
4
−5
−3
x 10 1
2
3
4
−2
0.05
5
5
5
0
0
0
0
−0.05
1
2
3
4
−5
1
2
3
4
−5
1
2
3
4
−5
Mode 4
x 10 1
−3
2
3
4
x 10 1
−3
2
3
4
x 10 1
−3
2
3
4
1
2
3
4
Fiber Optic Sensor # ( see Figure 3 )
Figure 12. The first four modal macro-strain vectors identified from fiber Bragg grating sensor data for impact test at various damage states.
6. CONCLUSION The results from this test showed strong agreement between the structural modal parameters inferred from data taken with the accelerometers and fiber grating sensors. This not only further validates the use of long gage length fiber grating sensors in system identification, but also indicates that the modal identification method of detecting structural damage has the potential to accurately diagnose degrading structural members. Quantifying changes in modal parameters with increasing damage is the first step toward complete damage identification. At this point, the algorithm is able to reveal a clear change in the vibration properties of a large structure tested in its nonlinear range in laboratory conditions. Further developments in signal modeling and analysis will enable the location of the damage to be obtained as well as a quantified measure of the state of damage at that location.
ACKNOWLEDGEMENTS This work was partially funded by the National Science Foundation, Grant No.’s 9961268 and DMI-0131967. The authors would like to thank the National Science Foundation for their continued support of this important research. The authors are also grateful to Professor Vistasp Karbhari, UCSD, and to Dr. Sikorsky of Caltrans for allowing them to perform the dynamic tests used in this research, and to Mike Frazer for his help in acquiring the data.
REFERENCES 1. 2. 3.
4. 5. 6. 7. 8.
Schulz W., J. Conte, E. Udd, and M. Kunzler, “Structural Damage Assessment Via Modal Property Identification Using Macro-Strain Measurements with Fiber Bragg Gratings as an Alternative to Accelerometers”, Proceedings of OFS-15, Portland, Oregon, USA, May 2002. W.L. Schulz, J.P. Conte, E. Udd, "Long Gage Fiber Optic Bragg Grating Strain Sensors to Monitor Civil Structures", Proceedings of SPIE, Vol. 4330, p. 56, 2001. Conte, J. P., and Liu, M., "Use of Long-Gage Fiber Optic Sensors for Earthquake Response Monitoring and Non-Destructive Evaluation of Structures," CUREE Publication No. CKIII-04, CUREE-Kajima Joint Research Program - Phase III, 2001. W. Schulz, J. Conte, E. Udd, J. Seim, “Static and Dynamic Testing of Bridges and Highways using Long-Gage Fiber Bragg Grating Based Strain Sensors”, SPIE Proceedings, Vol. 4202, p. 79, 2000. W.L. Schulz, J.P. Conte, E. Udd, J.M. Seim, “Seismic Damage Identification using Long Gage Fiber Bragg Grating Sensors”, Second Workshop on Advanced Technologies in Urban Earthquake Disaster Mitigation, Kyoto Japan. July 2000. Brestel, D., L. Van Den Einde, L. Zhao, V.M. Karbhari, and F. Seible, "Test Report for Continuous and Splice Connection Longitudinal Girders for the I-5/Gilman Advanced Technology Bridge," TR-2002/06, August 2002. B.L. Ho, R.E. Kalman, “Effective construction of linear state-variable models from input/output functions”, Regelungstecknik, Vol. 14, 1966. H.P. Zeiger, J. McEwen, “Approximate linear realizations of given dimension via Ho's algorithm”, IEEE Trans. on Automatic Control, Vol. 19, page 153, 1974.