recovery is crucial for correct diagnosis and monitoring response to therapy, applications such as the use of PET in. Intensity-Modulated Radiation Therapy ...
FUZZY VERSUS HARD HIDDEN MARKOV CHAINS SEGMENTATION FOR VOLUME DETERMINATION AND QUANTITATION IN NOISY PET IMAGES M. Hatt1, N. Boussion1, Member IEEE, F. Lamare1, Student Member IEEE, C. Collet2, F. Salzenstein3, C. Roux1, Fellow, IEEE, Y. Bizais1, C. Cheze-Le Rest1, D. Visvikis1, Member IEEE 1
Laboratoire de Traitement de l’Information Médicale (LaTIM), U650 INSERM, Brest, France. 2 Ecole Nationale Supérieure de Physique de Strasbourg (ENSPS), ULP, Strasbourg, France. 3 PHysique et Applications des SEmi-conducteurs (PHASE), ULP, Strasbourg, France. ABSTRACT
Accurate volume contouring in PET is crucial for quantitation in numerous oncology applications. The objective of our study was to compare the performance of two algorithms for automatic lesion volume delineation that permit noise modelling and have not previously been applied to PET data; namely the Hidden Markov Chains (HMC) model and a novel version: Fuzzy HMC. Both models take into account noise, voxel’s intensity and spatial correlation, in order to classify a voxel as “background” or “functional volume”. In comparison to HMC which only models uncertainty, the novelty of the fuzzy model consists of the inclusion of an estimation of imprecision. The performance of both models was compared using synthetic images. Results demonstrate that FHMC performs better than HMC in both activity concentration accuracy as well as functional volume determination under different imaging conditions. 1. INTRODUCTION Positron Emission Tomography (PET) has been long established as a powerful tool in oncology and in particular in the area of diagnosis. Newer applications include the use of PET in radiotherapy planning [1] and response to therapy studies [2]. Whereas accurate activity concentration recovery is crucial for correct diagnosis and monitoring response to therapy, applications such as the use of PET in Intensity-Modulated Radiation Therapy (IMRT) treatment renders equally vital the accurate shape and volume determination of lesions. Different volume of interest (VOI) determination methodologies have been proposed that can be classified as manual or automatic. On one hand, manual segmentation methods to delineate boundaries are laborious and subjective [2]. On the other hand, automatic segmentation of objects of interest in PET [3, 4] is no trivial task because of low spatial resolution, partial volume effects (PVE) [5], respiratory movements [6], low contrast ratios, as well as noise resulting from the statistical nature of radioactive decay and the reconstruction process. The most widely used method to semi-automatically determine VOIs
in PET is thresholding, either adaptive, using a priori Computed Tomography (CT) knowledge [7], or fixed threshold [2] using values derived from phantom studies (from 30 to 75% of maximum value) [1, 7]. Such thresholding techniques however lead to variable VOIs determination, as shown in recent clinical studies [8]. Numerous works have addressed automatic lesion detection from PET datasets, including different methods such as edge detection [3] or fuzzy C-Means [4]. The performance of these algorithms greatly depends on the image noise as they do not as such involve noise modeling. In addition, past work has in its majority considered the ability of such automatic methodologies for the detection of lesions but not the accuracy with which the methods are capable for VOI and/or activity concentration determination. Furthermore, these algorithms often involve user-dependent initializations, pre- and post-processing, or additional information like CT or expert knowledge. Hidden Markov Models (HMM) are automatic segmentation algorithms allowing noise modelling. They have been only used in PET in the form of Hidden Markov Fields (HMF) [9]. Hidden Markov Chains (HMC) is a faster model and can offer competitive results [10]. The objectives of this study were to (a). develop a new fuzzy HMC (FHMC) model, and (b). compare the performance of the classical HMC in comparison to the FHMC model for both activity concentration and VOI determination in PET imaging. Different imaging conditions in terms of statistical quality, as well as lesion size and contrast were considered in the evaluation phase. 2. MATERIAL AND METHODS 2.1. Fuzzy Hidden Markov Chain model The HMC model is an unsupervised methodology that takes place in the Bayesian framework [10]. Let T be a finite set corresponding to the voxels of an image. We consider two random processes Y = (Yt )t∈T and
X = ( X t )t∈T . Y represents the observed image, and X represents the “hidden” segmentation map. X takes its
values in
Ω = {1,..., K } and Y takes its values in
g ( x1 = 0, x2 = 0) = α1
.
g ( x1 = 1, x2 = 1) = α 2
We assume that a Markov process can model the prior distribution of X . The segmentation problem consists in estimating X = x from the observation Y = y . Such a recovery can be achieved thanks to the Bayes formula:
P (X = x | Y = y) =
P ( X t = xt | X 1 = x1 , ..., X t −1 = xt −1 ) = P ( X t = xt | X t −1 = xt −1 ) for 1 < t ≤ T
(1.2)
The distribution of X is then defined by the distribution of X 1 , called initial probabilities π i for each class ωi and the
aij [10]. As X and Y are 1D vectors in
the HMC context, a spatial transformation is needed to process 3D VOIs. For the best preservation of the spatial correlation between voxels we use the extended HilbertPeano space-filling curve [10]. The idea behind the implementation of the fuzzy model is the following: only a finite number of homogeneous (or “hard”) classes are considered in HMC whereas FHMC considers two hard classes and a finite number of fuzzy levels I i . This model allows the coexistence of voxels belonging to one of two hard classes and voxels belonging to a “fuzzy level” depending on its membership to the two hard classes. FHMC adds an estimation of imprecision, while HMC only models uncertainty. A redefinition of mathematical expression of the segmentation and estimation processes using density and continuity notions is necessary. One way to achieve this extension is to simultaneously use Dirac and Lesbegue measures at the class chain level. Hence we consider in the fuzzy model that X now takes its values in [0,1] instead of {1,..., K } . Let δ 0 and δ1 be the Dirac measures at 0 and 1, and
ζ the Lesbegue measure on ]0,1[ .
Using ν = δ 0 + δ1 + ζ as a measure on [ 0,1] , the distribution
of X can be defined using a conjoint density g for
( X t , X t +1 ) that is defined as follows: let
g ( x1 = 1, x2 = 0) = γ 2 g( x1 = ε1, x2 = ε 2 ) = β × f g (ε1, ε2 )
P(Y = y | X = x) P(X = x) (1.1) P(Y = y)
Many applications of HMM with unsupervised estimation have been successful considering different type of images [10]. It was shown that HMC can offer segmentation results similar to the ones resulting from HMF, despite using a simpler spatial relationship model [10]. Furthermore, HMC need far shorter computational times, as quantities of interest can be computed directly on the chain, whereas HMF algorithm needs iterative Monte-Carlo like estimations procedures [10] that are time consuming. X is a Markov chain if:
transition matrix
g ( x1 = 0, x2 = 1) = γ 1
( X i = x1 , X j = x2 ) ∈ [ 0,1] × [ 0,1]
with (ε1, ε 2 ) ∈ ]0,1[ × ]0,1[
(1.3)
The limit conditions that we impose yield the following condition: α1 + α 2 + γ 1 + γ 2 + β iλ = 1 with λ being a constant depending on the form of the parameterized function f g , that we define as:
f g (ε1 , ε 2 ) = 1- | ε1 -ε 2 | (1.4) The values of α1 , α 2 , γ 1 , γ 2 , β must be estimated in the unsupervised case. We can now express the distribution of X using g ((1.3) and (1.4)) as:
P ( X t +1 ∈ I j , X t ∈ I i ) = ∫ ∫ g (u , v)d (ν ⊗ν )(u , v) (1.5) I j Ii
We can compute (1.5) using a quantization of the interval [0,1] into N equidistant values: 0, 1 ,..., i ,...,1 . Once N N this is achieved, the estimation and segmentation steps are similar to the ones of the HMC context. We use Iterative Conditional Estimation (ICE) procedure [10] in order to estimate parameters of the a priori model ( π i and aij ) as well as the noise parameters for each class and fuzzy level (mean and variance). This is achieved as in the classical HMC context by simulating posterior realizations and computing empirical values of the parameters to estimate [10]. We also adapted the Maximum Posterior Mode (MPM) [10] criterion to the fuzzy context, using the loss function, and
Lt ( xt , xˆt ) = xt − xˆt where xt is the real class
xˆt is the one affected by the segmentation process.
2.2. Test images and analysis
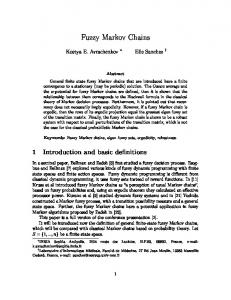
Synthetic images of spheres were generated using Gaussian blur to model the Point Spread Function (PSF) of a PET system, while Gaussian noise of variable variance was introduced to model statistical and reconstruction-induced noise. The activity placed in the spheres was homogeneous. Different sphere diameters (10, 17, 28 and 37 mm) and two different voxel sizes (2 × 2 × 2mm3 and 4 × 4 × 4mm3) were considered. Variable intensities of the Gaussian noise were used to simulate statistical noise (coefficients of variation (COV) of 20, 40 and 80% considering the mean lesion and background intensity levels). Two different signal-to-
Volume computation errors (%)
Volume determination (2 mm)
background (S/B) ratios were considered: 5:1 and 10:1. Visual examples of synthetic images are given in figure 1. At the second level of evaluation simulated images were obtained considering the same phantom geometry using GATE and a model of the Phillips Allegro PET scanner [11]. Images were reconstructed using the OPL-EM algorithm [12]. Three different image statistical quality levels were considered (60, 40 and 20 million simulated true coincidences). Images were segmented in two classes (‘functional volume’ and ‘background’) with HMC and with two hard classes and two fuzzy levels for FHMC. As the goal of our study has been to evaluate the accuracy of the two algorithms in terms of volume and activity concentration estimation, we assume that the lesion has been previously detected and automatically placed in a window well encompassing the VOI in all three dimensions. Volumes for the spheres were computed based on the segmentation results. In the case of FHMC, different “functional volumes” were calculated depending on the inclusion of the voxels belonging to different “fuzzy” levels. 3. RESULTS
Our results demonstrate that VOI determination using FHMC was systematically closer to the true ‘functional volume’ using the first fuzzy level voxels added to these of the hard class. Similarly, quantitation results were always better by selecting only the voxels belonging to the hard class, without any voxels belonging to the fuzzy domain. Therefore for FHMC these were the volumes considered during the comparison with the HMC for the different image configurations outlined in section 2.2. In the case of the HMC the volumes calculated using all voxels contained in the segmented lesions were used in the comparison, as HMC being a binary segmentation with two ‘hard’ classes, does not offer a choice in the voxels selection. Figures 2 and 3 illustrate a comparison of volume and activity concentration quantitation results as a function of lesion size, image noise and contrast ratio for the synthetic images. For each sphere and segmentation algorithm there are three results representing the three different levels of
3D Fuzzy Markov
3D Hard Markov
1
10mm
17mm 28mm Ratio 5:1
37mm
10mm
17mm 28mm Ratio 10:1
37mm
Fig. 2: Volume determination errors (2 mm voxel size).
Quantitation (2 mm)
3D Fuzzy Markov
3D Hard Markov
0 1
Quantitation error (%)
(a) (b) Fig. 1: (a) ratio 5:1, medium noise and 2 mm. (b) ratio 10:1, strong noise and 4 mm.
100 90 80 70 60 50 40 30 20 10 0 -10
-10 -20 -30 -40 -50 -60
10mm
17mm 28mm Ratio 5:1
37mm
10mm
17mm 28mm Ratio 10:1
37mm
Fig. 3: Quantitation errors (2 mm voxel size). noise considered, with the first result being that for the larger noise. As expected, FHMC globally performs better than HMC for both VOI determination and quantitation applications. Similar conclusions were drawn considering the 2mm3 and 4mm3 voxel sizes, although absolute errors were higher by up to 10% depending on lesion size for the 4mm3 configurations. Overall volume estimation results were more accurate than the estimation of activity concentrations. FHMC performed well for both tasks with errors 1cm irrespective of contrast ratio, level of noise or lesion size. The larger errors were observed for the smaller lesion of 10mm in combination with the 4mm3 voxel size. On the other hand results for the HMC were greatly dependent on noise levels and the lesion size varying from 20-50% and 20%-100% for the activity quantitation and volume determination respectively. Considering the simulated images, FHMC was also better in comparison to HMC, with a similar trend to the results of the synthetic images in terms of lesion size, noise and contrast dependencies. On the other hand the absolute accuracy in comparison to the synthetic image results was worse by 5-10%, the magnitude of differences depending inversely proportional to the lesion size. 4. DISCUSSION
The differences between HMC and FHMC segmentation results are striking, except for certain difficult
configurations (lowest ratio, strongest noise, smallest sphere) for which none of the models gave satisfying results. For the other configurations, the gain is important (30% 80%) and 3D FHMC is the best choice for both volume determination and activity concentration quantitation applications in PET. Based on these results FHMC can be used (including voxels of the first fuzzy level) to provide a relatively accurate functional VOI estimation, in cases where HMC segmentation fails. This is thanks to the addition of a fuzzy measure rendering the segmentation process able to better distinguish voxels of foreground and background. Therefore, while HMC has a tendency to include all voxels with intensity high enough into the “functional volume” class, FHMC leads to “finer” segmentation maps. In addition, FHMC may be used (considering only hard class voxels) to quantify lesion activity concentrations with equally high levels of accuracy. The performance of FHMC was robust for both tasks considered throughout different lesion sizes, contrast ratios and noise levels. However, both algorithms failed to give satisfactory results (