Genetic Parameter Estimation for Casein in Brown Swiss 1
2
S. Ghiroldi1, C. Nicoletti1 and A. Rossoni1,2 Italian Brown Cattle Breeders’ Association, Loc. Ferlina n°204, 37012 Bussolengo (VR) Italy
tel +390456760135 Fax +390457156655 email:
[email protected] VSA Department, University of Milan, Veterinary Medicine via Celoria n° 2, 20133 Milan Italy
Abstract The most part of Italian Brown Swiss milk goes to cheese so casein is fundamental. The trait currently used in selection is protein content tested in routine milk recording (test-day protein content). Now is possible to determine casein content on each cow by Fourier Transform Infrared Spectroscopy (IR). This allows to analyse casein routinely for each test day. In this study, 1022 milk samples have been collected from 46 herds in 3 Italian provinces, in winter and in summer. Casein percentage for 289 out of the 1022 samples have been analysed also using the reference method for casein (Kjeldahl). The first step was to match the results obtained by IR and by reference method. In order to verify the possibility to employ casein in selection directly, heritability and genetic parameters between traits studied were estimated. The average value for casein percentage tested with IR method was very similar to the one obtained by the reference method (2.72% vs. 2.71%) with correlation of 0.97 Variability coefficients also show limited differences (11.33% vs. 12.12%). Heritability estimated by casein kilogram is 27%, comparable with other productive traits and is therefore possible to obtain a good response to selection. Keywords: Casein, Genetic Parameters, Dairy cattle, milk components, Brown Swiss
This allows to analyse casein routinely for each test day.
Introduction Italy is famous for typical cheeses. The most part of Italian Brown Swiss milk production goes to cheese. In this production, casein is fundamental since it is strictly tied to some important cheese making parameters.
Pederson et al. (1991) estimated a daily casein yield heritabilities from 0.26 to 0.10 in three different breeds. Also Ikonen found a heritability estimates of 0.35 for casein percent.
A study carried out by P. Mariani and his co-operators in 2002 showed that a 0.37% variation of casein content corresponds to a variation of one kilogram of Parmigiano Reggiano every hundred kilos of milk in the cheese yield in 24 hours.
The aim of this study is to evaluate the efficiency of the automatic method and the possibility of using the trait “casein production” in selection schemes .
Material and Methods
Another study (Pedersen et al., 1991) showed the importance of content of casein in milk for cheese production.
In this study, 1022 milk samples have been collected from 46 herds in 3 Italian provinces, in winter and in summer. Milk samples have been collected at the same time as milk recording. Samples have been analized for casein percentage by the automatic method (IR) and total protein percentage by means of the infrared analyser (FIL-IDF 141C:2000).
One trait used currently in selection is protein content tested in routine milk recording (test-day protein content). Now is possible to determine casein content on each cow by Fourier Transform Infrared Spectroscopy (IR). 125
By using the automatic method, concentration is determined according to a calibration curve supplied by the producing company that was tested at a preliminary phase to make it suitable for local milk features.
The casein index was calculated as the proportion of casein percentage on protein percentage (Mariani-Zanzucchi-SummerVecchia, 1995) in order to analyse the connections between the two traits as well as the variation of their ratio.
Casein percentage for 289 out of the 1022 samples have been analysed also using the reference method for casein (Kjeldahl).
In order to verify the possibility to employ casein in selection directly, genetic parameters between traits studied were estimated with the following model:
This method calculates such parameter as the difference between the total nitrogen content and non-casein nitrogen, determined by Kjeldah, on the filtered matter after precipitation with acetic-acetated acid buffer (FIL-IDF 29:1964).
yijkl= µ + htdi + pagej + dimk + al + eijkl where: yijkl µ htdi
Cows were randomly chosen among those registered in the Herdbook and each cow had to be tested only once in order to avoid repeated values in the dataset.
al
examined trait general average fixed effect of the ith herd_test-day (i=1 to 46) fixed effect of the jth parity per age at calving (j=1-16) fixed effect of the kth class of days in milk (k=1-8) additive random genetic effect of
eijkl
animal l residual random effect
pagej
The first step was to match the results obtained by IR and the results obtained by reference method. For this aim Pearson correlation and regressions between both methods have been calculated.
dimk
After having considered the obtained results, it was decided to carry on with the study using date obtained with the automatic method.
Days in milk were grouped into 8 classes of fourty days each one. Npage was the interaction of number of parity (first, second and other parities) and age at calving into 13 classes.
After the editing of data, 216 records were excluded from the estimation to genetic parameters for various reasons (e.g. days in milk greater than 305 day, false information on pedigree, etc.).
The (co)variance components were estimated by VCE5 REML package (Kovac et al., 2002).
Consequently samples utilized were 806 with data for milk yield, casein yield, casein percent, protein yield and protein percent (Table 1).
The pedigree included 5 generations of relatives. The total number of animals in estimation was 4428.
Table 1. Descriptive statistics data set. Variable Average Dev std Milk yield 27.59 7.89 Casein (kg) 0.74 0.20 Protein (kg) 0.97 0.26 Casein (%) 2.72 0.27 Protein (%) 3.53 0.36 Casein 76.76 2.58 index
CV 28.60 27.44 27.26 9.87 10.19
Min. 8.40 0.24 0.34 2.03 2.57
Results and Discussion
Max 52.00 1.46 1.88 3.51 4.72
The average value for casein percentage tested with IR method was very similar to the one obtained by the reference method (2.72% vs. 2.71%) with 0.97 of correlation. Variability coefficients also show limited differences (11.33% vs. 12.12%).
3.36 62.67 89.94
126
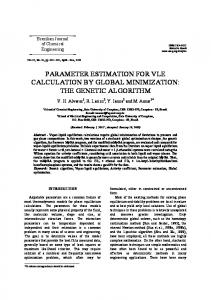
y = 0,9015x + 0,2794
3
0.8
2.95
3,20
2.9
3,00
2.85
Casein (kg)
0.75
0.7
2,60
2.75
0.65
2.7
2,40
0.6 2.65
2,20
2.6 0.55
2,00 2,00
2.55
2,20
2,40
2,60 2,80 CASEINE Kjeldahl
3,00
3,20
3,40 2.5
0.5 20
70
120
170
220
270
Days in Milk
Figure 1. Plot of percent of casein with Kjeldahl and infrared analyser method.
Figure 2. Lsmeans of lactation stage on casein % and casein yield.
Figure 1 shows the linear regression between the Kjeldahl method an infrared analysis. There is low dispersion of data around the regression line.
Among those, the percent of casein decreases during the first period of lactation and increases afterwards. Casein yield was high at the beginning of lactation and then declined for the rest of lactation (Figure 2).
Casein index has an average of 76.76% with a minimum of 62.67% and a maximum of 89.93%. The average variability coefficient is 3.36%.
Heritability estimated by casein kilograms is 27%, comparable with other productive traits (Table 2).and is therefore possible to obtain a good response to selection.
The results obtained show that the average casein percentage over the total protein is in line with the coefficient used for the conventional casein estimate.
Table 2. Estimates of Heritability with standard errors for studied traits.
On the contrary, the variability coefficient and the variation range of the casein index shows how casein and protein percentages do not have a constant ratio in every subject of the population.
Milk (kg) Casein (kg) Protein (kg) Casein (% ) Protein (%)
For example, among our samples there are two cows with equal protein percentage (3.6%), but with remarkably different casein percentages (2.25% vs. 2.89%).
Heritability Std. Err. 0.31 0.07 0.27 0.07 0.30 0.07 0.22 0.07 0.23 0.07
As expected, the trait casein kg has a high phenotypic correlation with protein Kg (98.95%). In table 3 estimates of genetic correlation for the traits considered in the analysis are presented.
The analysis of fixed effects showed similar results to those found in bibliography (Ikonen, 2004).
127
kilogram
2.8
2,80
Percent
CASEINE IR
Casein (%)
3,40
Some estimations have large standard errors, so the results obtained need to be confirmed by a wider pool of data.
There is very high genetic correlation between protein kilogram and casein kilogram (0.99) and there is a quite lower correlation between protein percent and casein percent (0.92).
Some Italian regions are using the infrared method routinely, so we will have a larger dataset in a near future.
Table 3. Estimates of genetic correlation with standard errors for traits studied. Genetic Correlation Kg Casein - kg Milk Kg Casein - kg Protein Kg Casein - % Casein % Casein - kg Milk % Casein - kg Protein % Casein - % Protein
Values 0.956 0.992 -0.115 -0.391 -0.123 0.925
Std. Err. 0.019 0.003 0.220 0.120 0.200 0.030
References Mariani, P., Summer, A., Formaggioni, P. & Malacarne, M. 2002. La qualità casearia del latte di differenti razze bovine. La razza bruna n. 1/2002 Mariani, P., Zanzucchi, G., Summer, A. & Vecchia, P. 1995. Variabilità dell’indice di caseina e distribuzione degli scarti tra caseina calcolata (proteina grezza x 0.77) e caseina Kjeldahl in 1065 campioni di latte individuale. Scienza e tecnica lattiero casearia 46,(2), 69-81. Ikonen, T., Morri, S., Tyriseva, A.M., Ruottinen, O. & Ojala, M. 2004. Genetic and Phenotipic correlations between milk coagulation properties, Milk production traits, somatic cell count, casein content, and ph of milk. J. Dairy Sci. 87, 458-467 Kovac, M., Groeneveld, E. & Garcia-Cortes, L.A. 2002. VCE-5, package for the estimation of dispersion parameters. Congress paper of 7th WCGALP August 2002 Montpellier, France Joint IDF/ISO/AOAC International Standard (www.fil-idf.org) Pedersen, J. & Lykke, T. 1991. Production of casein by Red Danish, Danish Friesian and Danish Jersey cattle breeds. Book of abstract, 42nd Annual meeting of the EAAP.
Conclusion Results of this study suggest the evident resemblance between the two analysis methods used to test caseins content in milk (IR method and reference method). In fact, the two methods lead to very similar results and show that the use of IR method for caseins analysis is reliable and, unlike the reference method, can be used for routine analysis of milk recording samples. Working on data showed the casein index can vary between cows. This underlines the importance to know the real milk casein content for every subject. The conclusions we reached let us suppose the possibility of making direct selection for the ”casein production” trait with good results, since the heritability of this trait. Nonetheless, it is to notice that, since the analysis was made on reduce size of data and to a limited geographic area.
128