Genie Pro: Robust Image Classification using Shape, Texture and Spectral Information Simon Perkins *a, Kim Edlunda, Diana Esch-Moshera, Damian Eadsa, Neal Harveya, Steven Brumbya a Los Alamos National Laboratory, Space and Remote Sensing Sciences, Los Alamos, NM 87545, USA ABSTRACT We present Genie Pro, a new software tool for image analysis produced by the ISIS (Intelligent Search in Images and Signals) group at Los Alamos National Laboratory. Like the earlier GENIE tool produced by the same group, Genie Pro is a general purpose adaptive tool that derives automatic pixel classification algorithms for satellite/aerial imagery, from training input provided by a human expert. Genie Pro is a complete rewrite of our earlier work that incorporates many new ideas and concepts. In particular, the new software integrates spectral information; and spatial cues such as texture, local morphology and large-scale shape information; in a much more sophisticated way. In addition, attention has been paid to how the human expert interacts with the software: Genie Pro facilitates highly efficient training through an interactive and iterative “training dialog”. Finally, the new software runs on both Linux and Windows platforms, increasing its versatility. We give detailed descriptions of the new techniques and ideas in Genie Pro, and summarize the results of a recent evaluation of the software. 1. INTRODUCTION The task of turning raw satellite imagery into semantically meaningful maps and overlays is a key area of remote sensing activity. Image analysts, in communities ranging from environmental monitoring to intelligence, have the job of transforming satellite imagery into maps of terrain classifications, crop types, road networks, buildings, and so on, typically in a form that can be placed within a GIS database for use by other people. To be most useful, these maps must be continually kept up to date as new imagery arrives, which in turn requires that the analysts perform their mapping tasks as quickly as possible, while still ensuring an adequate degree of accuracy. As satellite imagery becomes available in ever increasing volumes, at ever increasing resolutions, and with ever greater numbers of spectral bands, it is clear that we urgently require sophisticated automated or semi-automated tools for helping analysts derive maps quickly enough to keep up with the data deluge. Genie Pro is one such tool. Imagery comes in many different varieties, from panchromatic imagery with just a single band, through to hyperspectral imagery with hundreds of spectral bands. Currently available commercial imagery has resolutions that vary from pixel sizes of several kilometers down to under a meter. Mapping tasks also come in many different forms. The task of mapping roads, for instance, is quite different from the task of mapping pine forest extents. However, despite this diversity, there is a broad range of mapping tasks that have a lot in common. Ultimately, most mapping tasks can be seen as variations on the “pixel labeling” problem: given an image with one or more spectral bands, assign a label to every pixel in that image representing the category of the scene under that pixel. Once we have an accurate pixel labeling, it is then relatively straightforward to derive vector overlays suitable for storing in a GIS database. Genie Pro is designed to be a general purpose semi-automated mapping tool that can be used for many different mapping tasks on many different kinds of imagery, and its central function is to assign labels to pixels. Accurately assigning a label to a given pixel requires making use of the information in the image in a highly data- and task-specific way. Identifying water in a hyperspectral image might be accomplished using a fairly straightforward spectral algorithm, for instance; while identifying roads in panchromatic imagery is clearly going to require the use of spatial context and shape information. Even tasks that are superficially similar may require very different approaches: finding roads in a desert is very different to mapping urban streets. Trying to equip Genie Pro with explicit information about all these different kinds of targets and data sources would be impractical, so instead, Genie pro is an adaptive tool. *
[email protected]
Out of the box, it knows very little about crops, roads and different kinds of imagery, but it has the ability to learn from examples provided by an image analyst. A large amount of effort in Genie Pro goes into making this learning process as efficient and painless as can be achieved, and making as much use of the information provided as possible. A typical Genie Pro session goes something like this: 1. 2. 3. 4.
5.
The image analyst loads a satellite image into the Genie Pro display. The image analyst sparsely “marks up” the image using simple raster-based painting tools, indicating the locations of a few examples of different targets of interest. The analyst hits the “Train” button, and Genie Pro attempts to use the training markup to derive a general pixel classifier. After a short time, the analyst applies the resulting pixel classifier to the rest of the image and inspects the results. If the classifier has made some mistakes, the analyst has the option of adding more training data and continuing training, or of manually correcting the results by hand. Once the analyst is happy with the pixel labeling, a corresponding vector layer can be generated and exported to the GIS of his or her choice.
The remainder of this paper describes this training interaction in more detail and discusses how Genie Pro attempts to derive an effective pixel classifier in a general-purpose way for varied tasks and data types.
2. BACKGROUND 2.1. Performance Issues in Pixel Classification The performance of human analysts performing a mapping task provides a gold standard against which we can assess the performance of our software. While we do not know exactly how humans go about deciding which pixels belong to different categories when analyzing an image, we can be reasonably sure that they make use of at least the following visual cues: • • • • • •
Spectral content / color of the pixel concerned. Spectral content / color of nearby pixels. Texture properties of the local pixel neighborhood. Local shape characteristics, e.g. if it’s long and thin it might be a road. Higher level shape characteristics, e.g. if it looks locally like a road, but is very straight and ends suddenly at both ends, then it might be an aircraft runway. Proximity and spatial relationship to other identified objects and regions.
Different cues are going to be more useful on some problems and on some kinds of data than others. In addition, many of these categories are very broad. In existing image processing research, “Texture Properties”, for instance, covers a huge variety of measurable quantities, ranging from simple standard deviations of local intensity, through to “texture directionality” measures, texel descriptions, Markov Random Field statistics, co-occurrence matrices, and so on. 1 These measures are considerably further complicated when we start looking at multi- and hyperspectral imagery, when we not only have to decide what texture measure is appropriate, we also have to decide what spectral channels or combination of channels they should be applied to. In order to make a software tool that is as general purpose as possible, we should have the ability to make use of as many of these visual cues and attributes as is necessary. But attempting to build an adaptive system that considers every possible measure that can be derived from image processing an image is doomed to failure. Not only is it unlikely to be computationally feasible, but in addition, the huge number of parameters that have to be fit in such a scenario would almost certainly lead to severe “overfitting” problems. Any reasonable system is therefore going to have to make choices as to which attributes to focus its attention on. But how can it do this in a general way?
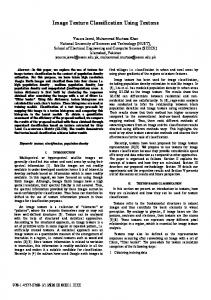
2.2. Usability Issues in Pixel Classification An issue that any adaptive system has to face is how to get hold of reliable training data. In Genie Pro, that data has to come from an image analyst, in the form of “training markup”. But marking up images is a tedious job. If the system is not able to make efficient use of training markup, then the analyst may well feel that their time would be better spent just creating a map by hand. After interacting with analysts in the field, we have come to the conclusion that in many cases, providing user-friendly and efficient manual “cleanup tools” is an essential adjunct to trying to achieve the best automatic delineation of features of interest. Analysts often prefer a tool that does 90% of the job quickly and leaves a few bits that need manually correcting; to one that maybe gets 99% of the job done, but requires much more extensive training. Finally, as with any image analysis software, issues of platform compatibility, file formats and integration into existing workflows are extremely important in practice. It is no use having the best mapping tool ever, if it doesn’t understand the image file format used by the analyst. 2.3. Previous Work Over the last six years, we have developed a very flexible and general purpose approach to pixel classification that can be applied to a great variety of different targets in different kinds of imagery. The first product of this approach was the GENIE pixel classification tool. 2 GENIE was soon followed by a similar tool called AFREET, which differed in details but followed the same basic approach. 3 For simplicity, we will describe AFREET here, but virtually everything that is said applies to GENIE as well. The essential idea behind AFREET and related tools is that, rather than decide in advance what kinds of attributes and measures will be useful in classifying pixels, we give our system a “toolbox” of image processing operations with which it can extract those image attributes it determines to be most useful. More specifically, AFREET uses an evolutionary algorithm to explore a space of possible “attribute extractors” that derive numerical values from pixel local neighborhoods. The numerical values from a given pixel neighborhood can then be combined together in a conventional machine learning framework to produce a final predicted label for the pixel at the center of each neighborhood. Attribute extractors are themselves composed of simpler image processing operations joined together in small image processing pipelines. This flexible structure allows the attribute extractors to derive numerical measures that describe a very varied array of image characteristics: from spectral characteristics, through texture properties and on to local morphological properties and spatial context. Different tasks and different kinds of imagery will require different attribute extractors, but the user of the system does not have to know any of the details. In effect we are gaining an enormous amount of flexibility in our pixel classifier structure, at the expense of the extra computational effort required by the evolutionary algorithm to explore different possible extractors for the task at hand. In a typical AFREET classifier we compute anywhere from three to ten numerical attributes for each overlapping pixel neighborhood in an image. Each numerical attribute is produced as the output of a single attribute extractor. As described above, these attributes represent spectral and spatial qualities of the corresponding neighborhoods. So, for each pixel in the image, we have a vector containing between three and ten numerical values. Note that for a given pixel classifier, we always use the same attribute extractors on every pixel in the image, so all the vectors are the same length for a given image and classifier. In order to produce a final predicted label, we feed these numbers into a simple discriminant function. Typically we take a linear combination of the numerical attributes and apply a threshold.† The weights used in the linear combination and the threshold are obtained either by calculating the Fisher Discriminant direction and performing a 1D search for an optimal threshold, 4 or by using a linear Support Vector Machine. 5 In practice the Fisher Discriminant works considerably faster and gives comparable results to the SVM. Figure 1 illustrates the basic structure of the AFREET classifier.
†
A single linear combination followed by a threshold is sufficient for the two class case, where for instance, pixels are to be classified as “target of interest” vs. “background”. AFREET can also handle more than one class using multiple sets of weights and thresholds. In this paper we will consider only the two class case, but the extension to multiple classes is straightforward.
Input Image Neighborhood
Attribute Extractor
Output Pixel Label Image Threshold
Attribute Extractor
Linear Comb.
Attribute Extractor
Figure 1: Structure of basic AFREET classifier. Details of the evolutionary algorithm used to optimize the attribute extractors can be found in Perkins et al. 3 but the essential idea is that we initialize each attribute extractor randomly, and find the best linear combination of the computed attributes that maximizes the match between the predicted label values and the label values supplied by the user in the training markup. Then we make a random change to a single attribute extractor and recompute the linear combination. If the match between user-supplied and predicted labels improves then we keep the change, otherwise we discard it. As this process is repeated many times, the attribute extractors tend to converge on those that are best suited for the imagery and classification task at hand. AFREET and GENIE were successfully used in real problems of interest to our sponsors, but as time went on, it became clear that they could be improved considerably. In particular, GENIE was written as “research code” and suffered from problems of portability and maintainability. In addition, a number of new ideas had been suggested and we needed a new tool in which to implement these ideas. So it was decided to embark on a complete rewrite that incorporated the best elements of GENIE and AFREET, with a particular view to creating a piece of software that could be used reliably in an operational scenario, and that could be used as a testbed for new ideas and concepts. This new tool is called Genie Pro.
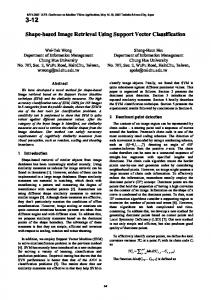
3. GENIE PRO IN DETAIL 3.1. The Genie Pro Processing Pipeline One of the major limitations of the basic architecture shown in Figure 1 is that it embodies a “short, fat processing pipeline”. The individual attribute extractors can contain several processing steps, but the extractors all work independently of one another. In contrast, human designed processing pipelines tend to be considerably “longer and narrower”, with multiple processing stages. The output of one stage feeds into the input of the next stage in a way that is impossible to achieve in the basic AFREET classifier. It was realized that we might be able to considerably improve performance by adding multiple stages to the processing pipeline and specializing each stage for different tasks. In particular, experiments showed that a second stage of “shape-based morphological” processing often produced considerably cleaner results than could be achieved with the original AFREET or GENIE architectures. Further testing showed that a final layer of “connected components shape filtering” could also greatly reduce the false alarm rate. The new Genie Pro processing pipeline is shown in Figure 2. The circles marked “Spectral / Texture Operations” and “Grayscale Morphology Operations” represent sets of attribute extractors as before, but this time each set is specialized for a specific task, as will be described later.
Spectral / Texture Operations
Grayscale Morphology Operations
Linear Comb.
Raw Image
Initial Class Probabilities
Spectral / Texture Attributes
Threshold + Shape Filtering
Linear Comb.
Final Class Labels
Initial Class Labels
Morphological Attributes
Figure 2: Genie Pro processing pipeline. We will now describe the various components of this pipeline in more detail. 3.2. Spectral and Texture Attribute Extraction The first processing stage of the new pipeline is identical to that show in Figure 1 with one exception: the operators that are used in the attribute extractors in this stage are constrained to be simple spectral and textural operators. No complicated morphological operations can appear here. This means that the image processing computational load of this stage is often considerably reduced from Figure 1 since many morphological operators are among the most expensive image processing operations. Figure 3 shows the structure of a typical first stage with three attribute extractors. The four squares at the bottom of the Figure represent a four-band input image. The labeled boxes above those represent primitive image processing operations, and the three squares at the top represent the three attribute values calculated for every overlapping pixel neighborhood in the image.
NormDiff AbsDif
Smooth
Gabor
StdDev
NormDiff
Figure 3: Spectral and texture attribute extraction.
Once we have obtained attribute values for each pixel in the image, the values are combined in a weighted linear combination to produce a single grayscale image, in which high values correspond to pixels that are likely to contain the feature of interest, and low values correspond to pixels that are unlikely to contain that feature. Note that we do not threshold the output at this stage to obtain discrete class labels – to do so at this stage would reduce flexibility. Semantically, the spectral / texture processing stage can be thought of as a “material identification” stage, since materials can often be identified by these kinds of attributes. For instance, asphalt may show up fairly readily as a smooth black material in color imagery. However, if we’re trying to find roads, for instance, then asphalt may be seen in many other places, such as on roof tops. In addition, for imagery with few spectral bands, many materials will have very similar spectral and textural signatures. So, in general the spectral / texture provides a “first cut” – it highlights regions that might be the feature of interest but the result is likely to contain many false alarms. 3.3. Local Morphological Attribute Extraction In order to eliminate many of those false alarms, the single grayscale image from the output of the first stage of processing is then passed to the second processing stage. Recall that regions of high intensity in this image indicate pixels that are spectrally and texturally similar to those in the target features identified in the training data. In the second stage we extract morphological and local shape characteristics of neighborhoods in this grayscale image in an attempt to further eliminate false alarms. Figure 4 shows the basic structure of this processing stage. Note its similarity to the first stage, except that this time the input is provided by the output of the first stage rather than coming direct from the image under analysis. In addition, the operators used by the attribute extractors in this stage are primarily morphological operations: operators such as morphological openings and closings with various different shaped structuring elements.
AbsDif f
Close
OpenClose
Open
Figure 4: Morphological attribute extraction. Again we obtain a new set of grayscale images, one corresponding to each of the morphological attribute extractors in this stage. The pixel values in these grayscale images are again combined together using a linear combination to produce a grayscale image in which high value pixels correspond to regions that are likely to contain the feature of interest.
3.4. Thresholding and Shape Filtering The final stage of Genie Pro consists of thresholding the grayscale image to obtain discrete labels, and performing an optional shape-filtering step. An initial threshold is chosen automatically so as to maximize the match between the predicted labels and the training labels supplied by the user. The user may then adjust the threshold manually to obtain a more visually acceptable result. However, there are some features that it is hard to distinguish between on the basis of spectral / texture and local morphological attributes. For instance, distinguishing between a road and an aircraft runway requires us to look at the whole region identified as a road. It may not be possible to find a threshold value that correctly classifies both objects at the same time. To tackle these situations, the user may employ an optional final filter that uses large scale shape information to distinguish difficult features that are spectrally and texturally and that have similar local shape characteristics. In typical usage, the user first manually selects a threshold that is low enough such that all objects of the target class that are to be detected are indeed detected. In ambiguous cases, this will produce a number of false alarms. The user can then select a shape filtering rule that will eliminate these false alarms based on their high level shape characteristics. Unlike earlier processing stages though, this high level shape analysis does not work at the pixel level. Instead it works on “connected components”: regions of pixels of a particular class that are connected together into a single object. A standard two-pass connected components algorithm applied to the threshold results image is used to derive the connected components, and the user may then select from a library of shape filters to reject undesirable false alarms. For example, they may choose a rule that all connected components bigger than 1000 square pixels in size should be rejected, or that objects that are more than five times as long as they are thin should be rejected. 3.5. Learning to Classify Pixels In the description above, we have focused on how the Genie Pro classifier pipeline functions, but we have not yet discussed how we obtain the weights for the linear combinations, or how we determine what goes into the attribute extractors. Much of the training process is described in Perkins et al.3 so here we will summarize the basic concepts while highlighting the differences from the earlier training algorithm. To start with, the user must supply some training markup using the Genie Pro user interface. Figure 5 illustrates some typical markup for a water mapping task. The water has been marked in green, while some examples of non-water have been marked in red. Pixels that have no markup over them are considered “unlabeled” and are not used in training the classifier.
Figure 5: Typical user markup on a small image for the water mapping task. When the user hits the “Train” button, an initial classifier is created by initializing all the attribute extractors to random structures, produced by combining together randomly chosen operators from Genie Pro’s library of image processing
operations. Operators in the spectral/texture stage are restricted to spectral and textural operations, while those in the morphological stage are limited to morphological operations. The raw image is first run through the spectral/textural attribute extractors to extract a small number of “attribute planes”, representing vectors of attribute values at each pixel location. Genie Pro then computes coefficients for a linear combination of these attributes using the Fisher discriminant technique4 that maximizes the separation, in attribute space, of the pixels labeled as “water” and “non-water”. Applying this linear combination to the attribute planes results in a single grayscale image in which high intensity regions correspond to regions that are most like the pixels marked as water. Several steps of the evolutionary algorithm described in Perkins et al.3 are then performed. Roughly, this involves making random changes to the attribute extractors, recomputing the Fisher discriminant, and then seeing whether the new output matches the user-supplied labels better than before. If the new feature extractors produce a better result, the change is kept, otherwise the change is undone. After a preset number of cycles of the evolutionary algorithm, we turn to optimizing the second stage. The grayscale image output by the first stage is fed into the initially random feature extractors in the morphological stage and a second set of morphological attribute planes are computed. As before, these are fed into a linear combination, whose weights are computed using the Fisher discriminant algorithm, to produce a “cleaned up” grayscale plane in which high values correspond to regions that are spectrally, texturally and morphologically similar to the pixels identified in the user markup. The evolutionary algorithm is now used to optimize the attribute extractors in the morphological phase, exactly as before. The spectral/texture attribute extractors are left untouched, and so we do not need to recompute the output of the first stage. The evolutionary algorithm is run for a preset number of cycles, using the same algorithm as before. After optimizing the morphological stage, we return to optimizing the spectral/texture stage again. The optimization continues in this fashion, alternating between several cycles optimizing the spectral/texture stage, and several cycles optimizing the morphological stage. Optimization continues until the user hits the “Stop” button and reviews the results. At this stage, the user can apply the classifier to arbitrary areas of the image (including the entire image), and can adjust the final threshold and shape filter options in order to obtain a visually appealing classification. 3.6. Putting the Classifier to Use All information related to the trained classifier, including attribute extractor structure, linear combination weights, threshold values and shape filter options; are stored in a “solution object” which can be stored in a file and retrieved at a later date. A previously trained classifier can be applied to other images of the same basic type (i.e. the same sensor, same ground resolution and same post-processing) to produce pixel classifications. The user can experiment with threshold values in the new images, and can even further train the classifier with additional training data if desired. In many cases the classifier produced by Genie Pro will get most of the image labeled correctly but will make some mistakes. These glitches can be cleaned up at this stage by the user, using simple manual raster editing tools provided by Genie Pro. Since Genie Pro is fundamentally a pixel classifier, its basic output is in the form of a labeled raster image. Rasters are expensive to store and manipulate, and so it is usual to transform the labeled regions identified by Genie Pro into vector overlays. Genie Pro provides a number of standard vectorization tools, including an outline vectorizer suitable for delineating large regions; a centerline vectorizer suitable for delineating long thin regions such as roads; and a centroid vectorizer, suitable for identifying the centers of small objects. These vector overlays can be saved to files in the standard shapefile format and imported into other GIS systems.
3.7. Implementation Details Genie Pro is written entirely in C++ for speed and compatibility. The graphical interface uses the Qt toolkit from Trolltech, Inc. 6 which provides a cross-platform windowing environment. The code is written in a portable fashion and compiles and runs on both Windows and Unix-like environments, such as Linux. 4. EVALUATION 4.1. Evaluation Criteria Genie Pro is a complex software tool that is intended for use on a wide variety of tasks with different kinds of data. Precise evaluation is further complicated by the fact that Genie Pro is an interactive tool, and that to get the most out of it, the user must develop certain skills, including knowing how much markup to provide, and knowing what options to provide to the system. Nonetheless, we can define at least three key areas in which Genie Pro should perform well: •
• •
Speed: From a practical viewpoint, we are interested in the total time elapsed between the instant that new raw imagery arrives at the analyst; and the moment at which the analyst obtains a sufficiently accurate vector overlay representing the feature of interest. The time will include the time to load in and display the imagery; the time to provide training markup; the training time itself; the time taken to apply the resulting classifier to the entire image; any time required to manually correct the results; and the time to produce the vector overlay. Accuracy: Producing a vector overlay quickly is no use if the delineation of the feature of interest is not of sufficiently high quality. Many organizations that carry out mapping tasks specify certain maximum error tolerances that are acceptable in valid overlays. User-Friendliness: A tool may produce accurate results in a short time, but be so tedious to use that analysts quickly grow tired of it. Fortunately, many enhancements to the user-friendliness of the software are tightly correlated to enhancements in the speed and quality of the output produced by the software.
4.2. Sponsor Evaluation Genie Pro’s development has largely been sponsored by a US government agency with an interest in turning satellite imagery into maps. The sponsor has recently completed a sophisticated evaluation of Genie Pro in a simulated operational scenario. Four software tools were involved in the evaluation: Genie Pro; Feature Analyst from VLS, Inc.; 7 eCognition from Definiens Imaging; 8 and Neural Fusion from BAE Systems. 9 Four image analysts were also involved in the evaluation. Each analyst tackled the same set of mapping tasks with each of the tools. The order in which each analyst used each tool was varied so as to avoid learning effects. The primary evaluation criterion was total time elapsed to produce a vector overlay, as defined above. The overlays had to meet or exceed the accuracy criteria laid down by the sponsor organization. Finally, the analysts were informally asked to rate each of the tools in terms of user-friendliness and usefulness. The detailed results of this evaluation are not yet publicly available, but in summary, Genie Pro was rated as the best performing tool, as measured by total elapsed time on the mapping task. Feature Analyst was a close second. On the user-experience questionnaire, both Genie Pro and Feature Analyst scored highly. Note that the version of Genie Pro used in this evaluation lacked many of the advanced features described in this paper, so we would anticipate an even better result if the evaluation was to be carried out now.
5. CONCLUSIONS Genie Pro is a sophisticated semi-automatic tool used primarily for deriving vector overlays from satellite or aerial imagery data. It is specifically intended to be applicable to a wide variety of tasks, and to be effective on a range of imagery types. It makes use of spectral, texture and shape information in an extremely flexible framework. It runs on a variety of different computer platforms and understands many different image formats natively. In an evaluation carried out by our sponsor, Genie Pro was the top performer in a comparison with several other similar commercially available tools.
REFERENCES 1
M. Tuceryan and A.K. Jain, “Texture Analysis”, Handbook of Pattern Recognition and Computer Vision, pp. 235-276, World Scientific Publishing, 1993. 2 S. Perkins, J. Theiler, S.P. Brumby, N.R. Harvey, R.B. Porter, J.J. Szymanski and J.J. Bloch, GENIE: A Hybrid Genetic Algorithm for Feature Classification in Multi-Spectral Images, Proc. SPIE 4120, pp. 52-62, 2000. 3 S. Perkins, N.R. Harvey, S.P. Brumby and K.Lacker, Support Vector Machines for Broad Area Feature Extracion in Remotely Sensed Images, Proc. SPIE 4381, 2001. 4 C. Bishop, Neural Networks for Pattern Recognition, Oxford University Press, 2nd edition, 1995. 5 C. Burges, A Tutorial on Support Vector Machines for Pattern Recognition, Data Mining and Knowledge Discovery, 2(2), pp. 955-974, 1998. 6 http://www.trolltech.com 7 http://www.featureanalyst.com 8 http://www.definiens-imaging.com 9 http://www.alphatech.com