ABSTRACT. Brain cancer is one of the most common and deadly disease in the world. Detection of the brain tumor in its early stage is the key to its cure.
International Journal of Computer Applications (0975 – 8887) Volume 30– No.11, September 2011
Texture and Shape based Classification of Brain Tumors using Linear Vector Quantization Neelam Marshkole, Bikesh Kumar Singh, A.S Thoke National Institute of Technology Raipur, C.G (India)
ABSTRACT Brain cancer is one of the most common and deadly disease in the world. Detection of the brain tumor in its early stage is the key to its cure. Early diagnosis of the brain tumor is very important. With the development in Artificial Intelligence (AI) and Soft Computing Techniques, Computer-Aided Diagnosis (CAD) attracts more and more attention for brain tumor diagnosis. Accuracy and efficiency are two major issues in designing CAD systems. In the brain Magnetic Resonance Imaging (MRI), the tumor may appear clearly but for further treatment, the physician also needs the quantification of the tumor area. The computer and image processing techniques can provide great help in analyzing the tumor area. In this paper features based on shape and texture of image were tested for analysis and classification of brain tumors. After feature extraction, linear vector quantization is used to classify brain tumor in to malignant & benign types. MATLAB ® 7.01 image processing toolbox and ANN toolbox have been used to implement the algorithm. The results show that texture and shape features can be effectively used for classifying brain tumor with high level of accuracy.
General Terms Pattern Recognition, Medical Image Processing.
Keywords Medical image, shape, texture, malignant, benign, tumor.
1. INTRODUCTION Image processing techniques are playing important role in analyzing Anatomical structures of human body. Image acquisition techniques like magnetic resonance imaging (MRI), X-Ray, ultrasound, mammography, CT-scan are highly dependent on computer technology to generate digital images. After obtaining digital images, image processing techniques can be further used for analysis of region of interest. A tumor is a mass of tissue that serves no useful purpose and generally exists at the expense of healthy tissues. Malignant brain tumors do not have distinct borders. They tend to grow rapidly, increasing pressure within the brain and can spread in the brain or spinal cord beyond the point where they originate. They grow faster than benign tumors and are more likely to cause health problems. Benign brain tumors, composed of harmless cells, have clearly defined borders, can usually be completely removed, and are unlikely to recur. A benign tumor is basically a tumor that doesn't revert and doesn't spread to other parts of the body. Benign tumors tend to grow more slowly than malignant tumors and are less likely to cause health problems. In brain MR images, after appropriate segmentation of brain tumor, classification of tumor in to malignant and benign is
difficult task due to complexity and variations in tumor tissue characteristics like its shape, size, gray level intensities and location [1]. Feature extraction is an important issue for any pattern recognition problem. Most of the reported work is dedicated to tumor segmentation or tumor detection [1-5]. This paper presents a hybrid approach to classify malignant and benign tumors using fusion of texture and shape futures. A CAD system for classification of brain tumor MR images is proposed. Both tumor and non-tumor regions appear with little distinction on an MR image. For accurate classification of brain tumor, computer and image processing techniques can provide great help in analyzing the MR images of brain. MATLAB ® 7.01 image processing toolbox is used for feature extraction and ANN toolbox has been used for classification.
2. OVERVIEW EXTRACTION
OF
FEATURES
A very difficult problem in classification techniques is the choice of features to distinguish between classes. An effective shape descriptor is a key component of content description; since shape is a basic property of an object present in the image itself [6]. Most of existing shape descriptors are usually either application dependent or non-robust, making them undesirable for shape description [7]. In this paper, a Fourier descriptor (FD) and moment invariants are used to overcome the drawbacks of existing shape representation techniques [8, 9, and 10]. Another set of features which we have used to describe a medical image is texture feature. Medical images possess different texture depending upon area of body considered for imaging. Texture refers to visual patterns which have properties of homogeneity and cannot result from the presence of only a single color or intensity. Texture perception has a very important aspect in the human visual system of recognition and interpretation. Two main approaches concerning with texture analysis: statistical modelbased, and spectral measure [9, 11]. We use Haralick‟s texture features [12] such as energy, correlation, inertia, entropy, inverse difference moment, sum average, sum variance, sum entropy, difference average, difference variance, difference entropy, information measure of correlation 1 and information measure of correlation 2. Features are extracted and represented in a single array called as feature vector.
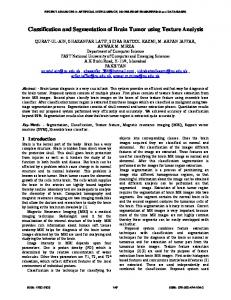
3. EXPERIMENTS AND RESULTS 3.1. Database Preparation 80 brain MRI images consisting of 40 malignant and 40 benign tumors were collected from open source database and some hospitals. Expert radiologists were consulted to confirm whether the tumor is malignant or benign. Figure 1 shows some sample images from the database.
21
International Journal of Computer Applications (0975 – 8887) Volume 30– No.11, September 2011 dimensional feature vector consisting of shape and texture attributes was used for training and testing. LVQ was used for classification of the tumor. Results show that texture and shape features can give satisfactory result in analysis and classification of brain tumors. The performance of the system can be further improved by fusing other shape and texture features like GLRLM texture features etc. Further work is to check the performance of the system by increasing the size of database.
3.2. ROI Extraction Before feature extraction, region of interest (ROI) consisting of tumor region was extracted using MATLAB imtool function for further analysis. Figure 2 shows extracted ROIs from some MRI Images from database.
Figure.2. Extracted ROI consisting of brain tumors before feature extraction
Table 1: Texture features of three malignant tumors from the database Figure.1. Example images from the database S.No
3.3. Determination Feature Vector Feature extraction is the main aspect of any CAD system. In our case the feature vector is a row consisting of shape features such as Fourier Descriptor coefficients and seven moment invariants along with 13 texture features discussed in section 2. The feature vector of each image in the database is stored as .mat file. Table 1 shows texture features of three malignant tumors and Table 2 shows texture features of three benign tumors. It is concluded from table that textures features of both benign and malignant tumors are very close to each other and hence texture feature alone may not give desired classification efficiency. Thus we use shape features along with texture features.
3.4. Classification Quantization
Using Linear Vector
Linear vector quantization (LVQ) is finally used for classifying the pattern of malignant and benign tumors. LVQ is a supervised version of Kohonen learning rule In LVQ each output unit represents a class [13]. One feature vector consisting of shape and texture attributes was generated for each tumor image and save in .mat file in MATLAB environment. Fifty percent of the data was used for training and remaining fifty percent was used for testing. Table 3 shows information about data set used for classification using LVQ. Table 4 shows the classification simulation results using LVQ. The accuracy of 85% is obtained for learning rate of α=0.70.
4. CONCLUSIONS In this paper an automatic method for classification of brain tumors in to malignant or benign using fusion of shape and texture features is proposed. After extracting features, a one
Image id_M1 0.0000*104
Image id_M2
1
Texture Feature Energy
0.0000*104
Image id_M3 0.0000*104
2
Correlation
0.0001*104
0.0001*104
0.0001*104
3
Inertia
0.0323*104
0.0350*104
0.0461*104
4
Entropy
0.0013*104
0.0012*104
0.0012*104
5
Inverse Difference Moment Sum Average
0.0000*104
0.0000*104
0.0000*104
1.0011*104
0.0344*104
0.0355*104
Sum Variance Sum Entropy
0.0611*104
1.4312*104
1.7302*104
0.0008*104
0.0008*104
0.0008*104
Difference Average Difference Variance Difference Entropy Information Measure of Correlation1 Information Measure of correlation 2
0.0012*104
0.0011*104
0.0013*104
0.0181*104
0.0236*104
0.0303*104
0.0005*104
0.0005*104
0.0005*104
-0.0000*104
-0.0000*104
-0.000*104
0.0001*104
0.0001*104
0.0001*104
6 7 8 9 10 11 12
13
22
International Journal of Computer Applications (0975 – 8887) Volume 30– No.11, September 2011 [2] M.Sasikala, N.Kumaravel and L.Subhashini „„Automatic Tumor Segmentation Using Optimal Texture Features‟‟, proceedings of IET 3rd International conference MEDSIP Advances in Medical Signal and Information Processing, 2006.
Table 2: Texture features of three benign tumors from the database S.No
Texture Feature
Image id_B1
Image id_B2
Image id_B3
1
Energy
0.0000*103
0.0000*103
0.0000*103
2
Correlation
0.0009*103
0.0009*103
0.0009*103
3
Inertia
0.1890*103
0.1657*103
0.2618*103
4
Entropy
0.0117*103
0.0114*103
0.0108*103
5
Inverse Difference Moment Sum Average Sum Variance Sum Entropy Difference Average Difference Variance Difference Entropy Information Measure of Correlation1 Information Measure of correlation2
0.0002*103
0.0002*103
0.0002*103
0.1950*103
0.1948*103
0.1765*103
5.8488*103
6.2039*103
3.8211*103
0.0081*103
0.0070*103
0.0073*103
0.0085*103
0.0081*103
0.0092*103
0.1167*103
0.0993*103
0.1776*103
0.0045*103
0.0045*103
0.0046*103
-0.004*103
-0.004*103
-0.003*103
0.0010*103
0.0010*103
0.0010*103
6 7 8 9 10 11 12
13
[3] R.B.Dubey, M.Hanmandlu, S.K.Gupta and S.K.Gupta „„Region Growing for MRI Brain Tumor Volume Analysis‟‟, proceedings of Indian Journal of Science and Technology, Vol.2, pp 26-31, Sep 2009. [4] Rajeev Ratan, Sanjay Sharma and S.K.Sharma „„Brain Tumor Detection Based on Multi-Parameter MRI Image Analysis‟‟, proceedings of ICGST-GVIP Journal, Vol.9,Issue 3rd ,pp 9-17,June 2009. [5] Ming-Ni Wu, Chia-Chen Lin and Chin-Chen Chang „„Brain Tumor Detection Using Color-Based K-Means Clustering Segmentation‟‟ proceedings of 3rd International Conference on International Information Hiding and Multimedia Signal Processing(IIH-MSP 2007), Vol-2, pp 245-250. [6] Muharrem Mercimek, Kayhank Gulez and Tarik Veli Mumcu,”Real object recognition using moment invariants”, proceedings of Journal Sadhana, Vol.30, part-6, pp 765775, Dec 2005. [7] Bikesh Kumar Singh and Aakanksha Wany, “Retrieval of M.R.I Images using Color & Spectral Features”, Proceedings of National Conference Technologia 2010, MPCCET Bhilai (India), Feb 2010. [8] Tomislav Petkovi´c, Josip Krapac,” Technical Report on Shape description with Fourier descriptors” available online at http://ipg.zesoi.fer.hr/project/plastics/fourierdescriptors.pdf. [9] B G Prasad, krishna A N,” Performance Evaluation of Statistical Texture Features for Medical Image Classification”, Proceedings of the National Conference on Emerging Trends in Computing Science “NCETCS (2011)”.
Table 3: Information about data set used for LVQ classification S.No 1. 2. 3
Information Number of instances =80 (Malignant: 40, Benign:40) Number of attributes =111+ class attributes. (Texture attributes:13, shape attributes:98) Classes: 02 ( Class 1: Malignant, Class 0: Benign) Table 4: Classification result using LVQ
S. No 1 2 3
Training Vectors 32 (40%) 40(50%) 40(50%)
α 1 1 0.7
Test Vectors 48(60%) 40(50%) 40(50%)
Time (sec) 13.9 12.55 16.64
Recognized Vectors 33 31 34
Efficie ncy 69% 78% 85%
[10] Rafael C.Gonzalez , Richards E.Woods ,Steven L. Eddins “Digital Image processing Using matlab”, McGrawHill,2nd Edition (2010). [11] J. Smith and S. Chang. Automated Binary Texture Feature Sets for Image Retrieval. Proceedings of IEEE International Conference on Acoustics, Speech, and Signal Processing, Volume 4, pages 2239-2242 (May 1996). [12] R. Haralik, K. Shanmugan, and I. Dinstein, “Texture features for image classification,” IEEE Trans. on System, Man and Cybernetics, vol. 3, pp.610–621, 1973. [13] S. N. Sivnandam, S. Sumathi, S.N. Deepa. “Introduction to Neural Networks Using MATLAB 6.0”, McGraw-Hill Edition (2010).
5. REFERENCES [1] Xiao Xuan, and Qingmin Liao „„Statistical Structure Analysis in MRI Brain Tumor Segmentation‟‟, proceedings of Fourth International Conference on Image and Graphics, pp 421-426, 2007.
23