Jul 16, 2003 - rejected as general-purpose segmentation algorithms. ... Boruvka's algorithm [4] with dual graph contraction algorithm [30] is used for building ...
Technical Report
Pattern Recognition and Image Processing Group Institute of Computer Aided Automation Vienna University of Technology Favoritenstr. 9/183-2 A-1040 Vienna AUSTRIA Phone: +43 (1) 58801-18351 Fax: +43 (1) 58801-18392 {yll,krw}@prip.tuwien.ac.at E-mail: URL: http://www.prip.tuwien.ac.at/
July 16, 2003
PRIP-TR-81
Hierarchical Image Partitioning with Dual Graph Contraction 1
Yll Haxhimusa and Walter Kropatsch
Abstract We present a hierarchical partitioning of images using a pairwise similarity function on a graph-based representation of an image. This function measures the difference along the boundary of two components relative to a measure of differences of the components’ internal differences. This definition tries to encapsulate the intuitive notion of contrast. Two components are merged if there is a low-cost connection between them. Each component’s internal difference is represented by the maximum edge weight of its minimum spanning tree. External differences are the smallest weight of edges connecting components. We use this idea for building a minimum spanning tree to find region borders quickly and effortlessly in a bottom-up way, based on local differences in a specific feature. Keywords. Hierarchical graph-based image partitioning, irregular graph pyramids, minimum weight spanning tree, topology preserving contraction.
1 This
report has been supported by the Austrian Science Fund under grants P14445-MAT and P14662-INF
Contents 1 Introduction 1.1 Related Work . . . . . . . . . . . . . . . . . . . . . . . . . . . . . . . . . .
2 4
2 Minimum Weight Spanning Tree 2.1 Bor˚ uvka’s Algorithm . . . . . . . . . . . . . . . . . . . . . . . . . . . . . .
6 8
3 Dual Graph Contraction (DGC) 10 3.1 Contraction Kernels . . . . . . . . . . . . . . . . . . . . . . . . . . . . . . . 11 3.2 Equivalent contraction kernels . . . . . . . . . . . . . . . . . . . . . . . . . 13 4 Minimum Spanning Tree with DGC
14
5 Hierarchy of Partitions 16 5.1 Building a Hierarchy of Partitions . . . . . . . . . . . . . . . . . . . . . . . 17 5.2 Construct Hierarchy of Partitions . . . . . . . . . . . . . . . . . . . . . . . 18 6 Experiments on Image Graphs
21
7 Conclusion and Outlook
26
1
1
Introduction
Wertheimer [54] has formulated the importance of wholes (Ganzen) and not of its individual elements as: “Es gibt Zusammenh¨ange, bei denen nicht, was im Ganzen geschieht, sich daraus herleitet, wie die einzelnen St¨ ucke sind und sich zusammensetzen, sondern umgekehrt, wo - im pr¨agnanten Fall - sich das, was an einem Teil dieses Ganzen geschieht, bestimmt von inneren Strukturgesetzen dieses seines Ganzen” 1 , and introduced the importance of perceptual grouping and organization in visual perception. Low-level cue image segmentation cannot and should not produce a complete final “good” segmentation. The low-level coherence of brightness, color, texture or motion attributes should be used to come up sequentially with hierarchical partitions [50]. Mid and high level knowledge can be used to either confirm these groups or select some further attention. A wide range of computational vision problems could make use of segmented images, were such segmentation rely on efficient computation. For instance motion estimation requires an appropriate region of support for finding correspondence. Higher-level problems such as recognition and image indexing can also make use of segmentation results in the problem of matching. It is important that a grouping method has following properties [11]: • capture perceptually important groupings or regions, which reflect global aspects of the image, • be highly efficient, running in time linear in the number of image pixels, • creates hierarchical partitions [50]. In a regular image pyramid (for an overview see [32]) the number of pixels at any level l, is r times higher than the number of pixels at the next reduced level l + 1. The so called reduction factor r is greater than one and it is the same for all levels l. If s denotes the number of pixels in an image I, the number of new levels on top of I amounts to logr (s). Thus, the regular image pyramid may be an efficient structure for fast grouping and access to image objects in top-down and bottom-up processes. However, regular image pyramids are confined to globally defined sampling grids and lack shift invariance [2]. Bister et.al. [2] concludes that regular image pyramids have to be rejected as general-purpose segmentation algorithms. In [41, 23] it was shown how these drawbacks can be avoided by irregular image pyramids, the so called adaptive pyramids, where the hierarchical structure (vertical network) of the pyramid was not “a priori” known but recursively built based on the data. Moreover in [37, 39, 3, 7, 18] was shown that irregular pyramid can be used for segmentation and feature detection. 1
“There are wholes (Ganzen), the behaviour of which is not determined by that of their individual elements, but where the part-processes are themselves determined by the intrisinic nature of the whole” [55]
2
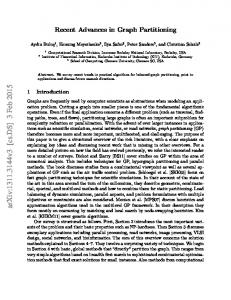
Each level represents a partition of the pixel set into cells, i.e. connected subsets of pixels. The construction of an irregular image pyramid is iteratively local [38, 22, 1, 20]: • the cells have no information about their global position. • the cells are connected only to (direct) neighbors. • the cells cannot distinguish the spatial positions of the neighbors. This means that we use only local properties to build the hierarchy of the pyramid. On the base level (level 0) of an irregular image pyramid the cells represent single pixels and the neighborhood of the cells is defined by the 4 (8)-connectivity of the pixels. A cell on level l + 1 (parent) is a union of neighboring cells on level l (children). This union is controlled by so called contraction kernels (decimation parameters, see Section 3). Every parent computes its values independently of other cells on the same level. This implies that an image pyramid is built in O[log(image diameter)] time. For more in depth on the subject see the book of Jolion [24] and of Rosenfeld [47]. Neighborhoods on level l + 1, are derived from neighborhoods on level l. Two cells c1 and c2 are neighbors if there exist pixels p1 in c1 and p2 in c2 such that p1 and p2 are 4-neighbors, Figure 1(a). We assume that on each level l + 1 (l ≥ 0) there exists at least one cell not contained in level l. In particular, there exists a highest level h . In general the top of the pyramid can have one vertex, i.e. an apex. In this technical report we represent the levels as dual pairs (Gl , Gl ) of plane graphs Gl and its dual (plane) graph Gl , Figure 1(b). That is why we use the 4-connectivity. The vertices of Gl represent the cells and the edges of Gl represent the neighborhood relations of the cells on level l, depicted with square vertices and dashed edges in Figure 1(b). The edges of Gl represent the borders of the cells on level l, depicted with solid lines in Figure 1(b), possibly including so called pseudo edges needed to represent the neighborhood relation to a cell completely surrounded by another cell. Finally, the vertices of Gl , the circles in Figure 1(b), represent meeting points of at least three edges from Gl , solid lines in Figure 1(b). The sequence (Gl , Gl ), 0 ≤ l ≤ h is called (dual) graph pyramid. Moreover the graph is attributed, G(V, E, attrv , attre ), where attrv : V → R+ and attre : E → R+ . We use a weight for attre measuring the difference between the two end points. The aim of this technical report is to built in minimum weight spanning tree (MST ) of an image by combining the advantage of regular pyramids (logarithmic tapering) with the advantages of irregular graph pyramids (their purely local construction and shift invariance). The aim is reached by using the selection method for contraction kernels proposed in [20] to achieve logarithmic tapering, local construction and shift invariance. Bor˚ uvka’s algorithm [4] with dual graph contraction algorithm [30] is used for building in a hierarchical way a minimum weight spanning tree (of the region) and at the same time to preserve topology. The topological relation seems to play an even more important role for vision tasks in natural systems than precise geometrical position. We use the idea of building a minimum weight spanning tree to find region borders quickly and effortlessly 3
Gl
(a)
(b)
Gl
Figure 1: a) Partition of pixel set into cells. b) Representation of the cells and their neighborhood relations by a dual pair (G, Gl ) of plane graphs. in a bottom-up ’stimulus-driven’ based on local differences in a specific feature like in an preattentive vision. See the book of Jolion [24] for an extensive overview of the pyramid framework for early vision. The plan of the technical report is as follows. In order to make the reading of this technical report easy we recall some of the basic notion as follows. In Section 2 we recall the main idea of the minimum weight spanning tree and in Subsection 2.1 we recall Bor˚ uvka’s MST algorithm. The dual graph contraction algorithm is explained in Section 3 and then Bor˚ uvka’s algorithm is re-defined in Section 4, so that we can construct an image graph pyramid, and, at the same time the minimum spanning tree. In Section 5 we give the definition of internal and external contrast and the merging decision criteria based on these definitions. The algorithm for building the hierarchy of partitions is introduced in this section. Section 6 reports on experimental results.
1.1
Related Work
A graph-theoretical clustering algorithm consists in searching for a certain combinatorial structure in the edge weighted graph, such as a minimum spanning tree [11, 13, 18], a minimum cut [56, 50, 16] and, among these methods a classic approach to clustering (the complete linkage clustering algorithm [34]) reduces to a search for a complete subgraph i.e. the maximal clique [42]. Hierarchical structures for description of the data for clustering purposes have been studied very early in [34], or for image segmentation in [21]. Image pyramids are a powerful tool for early vision, see the books of Jolion [24] and of Rosenfeld [47] for an extensive overview of the topic. However, the regular image pyramids are confined to globally defined sampling grids and lack shift invariance. Bister et.al. [2] concludes that regular image pyramids have to be rejected as general-purpose segmentation algorithms. In [41, 23] it was shown how these drawbacks can be avoided by irregular image pyramids, the so called adaptive pyramids, where the hierarchical structure (vertical network) of the pyramid was not “a priori” known but recursively built based on the data. Meer [39] in his “consensus vison” used the concept of irregular pyramid to produce an image segmentation. Moreover in [37, 7, 3, 7, 18] was shown that irregular pyramid can be used 4
for segmentation and feature detection. The clustering community [27] has produced agglomerative and divisive algorithms; in image segmentation the region-based merging and spliting algorithms exist. Early graphbased methods [59] use fixed thresholds and local measures in computing a segmentation, i.e the minimum spanning tree (MST ) is computed. The segmentation criterion is to break the MST edges with the largest weight. The idea behind is that edges in the MST reflect the low-cost connection between two elements. The work of Urquhart [52] attempts to overcome the problem of fixed threshold by normalizing the weight of an edge using the smallest weight incident on the vertices touching that edge. The methods in [11, 13, 18] uses an adaptive criterion that depend on local properties rather than global ones. Recently the works [11, 40, 13, 18] have the minimum spanning tree as the base algorithm. Gestalt grouping factors, such as proximity, similarly, continuity and symmetry, are encoded and combined in pairwise feature similarity measures [56, 50, 46, 44, 57, 53, 49, 58, 13]. Other method of segmentation is that of splitting and merging region based on how well the regions fulfill some criterion. Such methods [9, 43] uses a measure of uniformity of a region. Authors in [11, 13, 18] use, in contrast, in a graph-based method a pairwise region comparison rather than applying a uniformity criterion to each individual region. It has been demonstrated that complex grouping phenomena can emerge from simple computation on these local cues [19, 35]. The use of Markov Random Field (MRF ) has been used for image restoration and segmentation [17]. However the use of MRF to image segmentation usually leads to NP hard problems. The graph-based approximation method for MRF problems [5] yields practical solution, if the number of labels for the pixel is small, which limits these methods for use in segmentation. The methods based on minimum cuts in graph are designed to minimize the similarity between pixels that are being split [56, 50, 16]. Wu and Leahy in [56] define a cut criterion, but it was biased toward finding small components. Shi and Malik [50] developed the normalized cut criterion to address this bias, which takes into consideration selfsimilarity of regions. These cut-criterion methods capture the non-local properties of the image, in contrast with the simple graph-based methods such as breaking edges in the MST . It also produce divisive hierarchical tree, the dendogram. However they provide only a characterization of such cut rather than of final segmentation as is provided by Felzenszwalb [11]. Shi and Malik [50] developed an approximation method for computing the minimum normalized cut, the error in these approximation in not well understood (it is closely related to spectral graph methods, e.g [12]) and this method is computational expensive. The minimal spanning tree and the minimum cut are explicitly defined on edge weighted graph, whereas the concept of a maximal clique is defined on unweighted edge graphs. As a consequence, maximal clique based clustering algorithms work on unweighted graphs derived from the edge weighted graphs by means of some thresholding [27]. Pa5
van and Pelillo [42] generalized the concept of maximal clique to weighted graphs. The maximal cliques are found using the discrete replicator dynamics, which turns out to be an instance of relaxation labeling algorithm [48]. Our method is related to the work in [11, 18] in the sense of pairwise comparison of region similarity. We create a hierarchy of attributed graphs. At each level of the pyramid a region adjacency graph (RAG) is created, in an agglomerative way (by contraction) with the proper topology. A vertex of RAG is a representative of the region in the base level (receptive field), and it is created by taking into consideration the self-similarity of the region.
2
Minimum Weight Spanning Tree
Let G = (V, E) be the undirected connected plane graph consisting of the finite set of vertices V and the finite set of edges E. Each edge e ∈ E is identified with a pair of vertices vi , vj ∈ V . Let each edge e ∈ E be associated with nonnegative unique real weights w(e) = w(vi, vj ). Note that parallel edges, for ex. e1 = (v1 , v2 ) and e2 = (v1 , v2 ) e1 6= e2 , have different weights. First let us give some basic graph theoretical notions taken from [51]. Definition 1 [walk]. A walk in a graph G is a finite alternating sequence of vertices and edges v0 , e1 , v1 , ..., vk−1 , ek , vk beginning and ending with vertices such that vi−1 and vi are the end vertices of the edge ei , 1 ≤ i ≤ k. Definition 2 [trail]. A walk is a trail if all its edges are distinct. A trail is closed if its end vertices are the same. Definition 3 [circuit]. A closed trail is a circuit if all its vertices except the end vertices are distinct. Definition 4 [acyclic graph]. A graph G is acyclic if it has no circuits. Definition 5 [tree]. A tree of graph G is a connected acyclic subgraph of G. Definition 6 [spanning tree]. Spanning tree of graph G is a tree of G containing all the vertices of G. The problem is formulated as construction of a minimum weight spanning tree of G. A deterministic solution to this problem was proposed by Bor˚ uvka [4], Kruskal [33], and Prim [45] as the widely known greedy algorithms in the literature. A better solution to this problem was proposed (depending on the assumptions made) by Karger et.al. in [28] with a randomized algorithm, which solves the problem in linear expected time; Fredman et.al. in [14] with the linear worst case time solution under the assumption that weights 6
are small integers. The solution proposed by Gabow et.al. in [15] solves the problem with the solution’s exact bound O(m log β(m, n)), on a graph with n vertices and m edges. Here β(m, n) = min{i| log(i) (n) ≤ m/n}, where log(i) n is log(log(..(log(n))..)). | {z } i−times
Here we will give two lemmas that provide the basis of the minimum weight spanning tree algorithms, taken from [51], which will help us in proving the correctness of MST algorithm. The weight of the subgraph of G is the sum of edge weights of subgraph, i.e. for T ⊆ G, the weight of a subgraph is : X w(T ) = w(e). (1) e∈T
Theorem 1 Consider a vertex v in a weighted connected graph G. Among all the edges incident on v, let e be one of minimum weight. Then, G has a minimum weight spanning tree that contains e. Proof: Let Tmin be a minimum weighted spanning tree of G. If Tmin does not contain e, then consider the fundamental circuit C of Tmin with respect to e, i.e. created by adding e to Tmin . Let e′ be the edge of C that is adjacent to e and incident to the same vertex v. Clearly e′ ∈ Tmin . Also T ′ = Tmin − e′ + e is a spanning tree of G. Since e and e′ are both incident on v, we have w(e) ≤ w(e′ ), by assumption. But from the fact that Tmin is MST w(T ′) = w(Tmin ) − w(e′ ) + w(e) ≥ w(Tmin ) follows w(e) ≥ w(e′ ). So, w(e) = w(e′ ) and w(T ′ ) = w(Tmin ). Thus T ′ is also a minimum weighted spanning tree. The theorem follows since T ′ contains e. 2 Theorem 2 Let T be an acyclic subgraph of a weighted connected graph G such that there exists a minimum weight spanning tree containing T . If G′ denotes the graph obtained by contracting all the edges of T , and T ′ min is a minimum weight spanning tree of G′ , then T ′ min ∪ T is a minimum weight spanning tree of G. Proof: Let Tmin be a minimum weight spanning tree of G containing T . If Tmin = T ∪ T ′ (Figure 2(a)), then clearly T ′ is a spanning tree of G′ (Figure 2(b)). Therefore, w(T ′ ) ≥ w(T ′ min ).
(2)
′ Since T is an acyclic subgraph of G and Tmin is a minimum spanning tree of G′ , it is easy ′ to see that Tmin ∪ T is also a spanning tree of G. So,
w(Tmin ) w(T ′min ∪ T ) ≥ = w(T ) + w(T ′ ).
(3)
w(T ′ min ) ≥ w(T ′).
(4)
From this we get
7
T2
T1
t2
t1 t3
T3
G′
G a)
b)
Tmin
T′
Figure 2: (a) Tmin = T ∪ T ′ , where T = T1 ∪ T2 ∪ T3 and (b) T ′ after contraction of all edges in T . ′ ′ Combining Equations (2) and (4) we get w(Tmin ) = w(T ), and so w(Tmin ∪ T ) = w(T ′ ∪ ′ T ) = w(Tmin ). Thus Tmin ∪ T is a minimum spanning tree of G. 2
We intend to solve the problem of MST in parallel by using Bor˚ uvka’s algorithm in conjunction with dual graph contraction [30]. We use Bor˚ uvka’s algorithm since it can be used to built MST in parallel [8]. In the next Section 2.1 we give the parallel version of this algorithm.
2.1
Bor˚ uvka’s Algorithm
The idea of the Bor˚ uvka [4] is to do steps like in Prim’s algorithm, in parallel over the graph at the same time. This algorithm constructs a spanning tree in iterations composed of the following steps: Algorithm 1 – Bor˚ uvka’s Algorithm Input: Graph G(V, E). 1: MST := empty edge list. 2: all vertices v ∈ V make a list of trees L. 3: while there is more than one tree in L do 4: each tree T ∈ L finds the edge e with the minimum weight which connects T to G \ T and add edge e to MST . 5: using edge e merge pairs of trees in L. 6: end while Output: Minimum weight spanning tree - MST . First create a list L of trees, each a single vertex v ∈ V . For each tree T of L find 8
3 1
7 13
8
6 11
T3
5
2 10
9
4 12
T2
14
(a)
T1
(b)
MST (c)
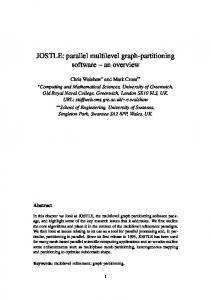
Figure 3: The steps of building MST with Bor˚ uvka’s algorithm. a) Starting graph; b) Edges with minimum weight (solid lines); c) MST (solid line). the edge e with the smallest weight, which connects T to G \ T . The trees T are then connected to G \ T with the edge e. In this way the number of trees in L is reduced, until there is only one, the minimum weight spanning tree. A simple example of steps of Bor˚ uvka’s algorithm is given in Figure 3; (a) the simple attributed graph as input, where each vertex is a tree in L; (b) the edges with the smallest weight (solid lines) incidented on vertices, connect the trees (vertices in this case) to each other creating the trees T 1, T 2 and T 3; (c) each tree in b) finds the edge with the smallest weight to connect to the other tree. The output shown in Figure 3(c) is the MST of the input graph. The proof that this algorithm builds the minimum weight spanning tree is based on the proof of the Kruskal’s MST algorithms given in [51]. Theorem 3 Bor˚ uvka’s algorithm constructs a minimum weight spanning tree of a weighted connected graph G. Proof: Let G be the given nontrivial weighted connected graph. When Bor˚ uvka’s algorithm terminates the selected tree Tmin is a spanning tree. Thus we have to show that Tmin is indeed a minimum weight spanning tree of G by proving that every Ti constructed in the course of Bor˚ uvka’s algorithm is contained in a minimum weight spanning tree of G. Our proof is by induction on i. The subgraph Ti+1 is constructed from Ti by adding an edge of minimum weight with exactly one end vertex in Ti . This construction ensures that all Ti ’s are connected. As inductive hypothesis assume that Ti is contained in a minimum spanning tree of G. If G′ denotes the graph obtained by contracting the edges of Ti and v ′ denotes the vertex of G′ , which corresponds to the vertex set of Ti , then ei+1 is in fact a minimum weight edge incident on v ′ in G′ . Clearly by Theorem 1 the edge ei+1 ′ ′ is contained in a minimum weight spanning tree Tmin of G′ . By Theorem 2, Ti ∪ Tmin is a minimum weight spanning tree of G. More specifically Ti+1 = Ti ∪ {ei+1 } is contained in a minimum weight spanning tree of G and the correctness of Bor˚ uvka’s algorithm follows. 2 It can be easily shown that Algorithm 1 may fail to build MST if the edge weights are not distinct, since the set of selected edges may contain cycles. This problem can be 9
neighborhood graph Gk (Vk , Ek )
face graph � dual -
Gk (Vk , Ek )
dual edge contraction edge contracted ? ? ? dual - G∗ (V , E \ N G∗ (Sk , Ek \ Nk,k+1) � k k k,k+1 ) � eliminates deg(v) < 3 dual face contraction dually contracted ? ? ? Gk+1(Vk+1 , Ek+1 ) � dual - Gk+1 (Vk+1, Ek+1 )
Figure 4: Dual Graph Contraction: (Gk+1 , Gk+1) = C[(Gk , Gk ), (Sk , Nk,k+1)] solved as follows. If there are several edges of minimal weight that touch a vertex v, then choose among them the edge with the smallest random number. This random numbers should be all distinct. Observation 1 In 3rd step of the Algorithm 1, each tree T ∈ L finds the edge with the minimal weight, and as trees becomes larger, the process of finding the edge with the minimal weight for each tree T takes longer.
3
Dual Graph Contraction (DGC)
Taking the Observation 1 into consideration, a contraction of the edge e, which connects T and G \ T in the 4th step of Algorithm 1 will speed up the process of searching for minimum weight edges in the Bor˚ uvka’s algorithm. Since each tree (in level k) after edge contraction will be represented by a vertex (in the level k + 1), the search for the edge with the minimum weight would be a local search. Note that introduction of the edge contraction method introduces the hierarchy of graphs. Kropatsch in [30] and Dey et.al. in [10] introduce a topology preserving edge contraction. First, shortly the dual graph contraction algorithm is given, as in Kropatsch [30], and then re-defined Bor˚ uvka’s algorithm is described in Section 4 so that we can construct minimum spanning tree i.e. a graph pyramid. The irregular (or graph) pyramids are constructed bottom-up level by level by repeatedly contracting the image graph in the base. Dual graph contraction [29, 30] proceeds in two basic steps (Figure 4): • dual edge contraction, and • dual face contraction. 10
The base of the pyramid consist of the pair of dual image graphs (G0 , G0 ). The following decimation parameter hSk , Nk,k+1i determine the structure of an irregular pyramid [30]: a subset of surviving vertices Sk = Vk+1 ⊂ Vk , and a subset of primary nonsurviving edges Nk,k+1 ⊂ Ek . (Secondary non-surviving edges are removed during dual face contraction). Every non-surviving vertex v ∈ Vk \Sk must be connected to one surviving vertex in a unique way. The relation between two pairs of dual graphs,(Gk , Gk ) and (Gk+1 , Gk+1), is established by dual graph contraction with decimation parameters hSk , Nk,k+1i, as expressed by function C[., .]: (Gk+1 , Gk+1) = C[(Gk , Gk ), hSk , Nk,k+1i].
(5)
The contraction of a primary non-surviving edge consists in the identification of its endpoints (vertices) and the removal of both the contracted edge and its dual edge. Figure 5(a) shows the normal situation, Figure 5(b) the situation where the dual edge contraction creates multiple edges, Figure 5(c) and self-loops. Redundancies (lower part) in case Figure 5(c) are decided through the corresponding dual graphs and removed by dual graph contraction. Dual face contraction simplifies most of the multiple edges and self-loops, but not those enclosing any surviving parts of the graph. They are necessary to preserve correct structure [30]. See Kropatsch [29, 30, 31] for more details on graph contraction.
3.1
Contraction Kernels
The connected components 2 CC(s), s ∈ S, of subgraph (S, N) form small tree structures T (s) that collapse into vertex s of the contracted graph: T (s) := (CC(s), N ∩ (CC(s) × CC(s))). Their union contain the primary non-surviving edges N. T (s) is a spanning tree of the connected component CC(s), or equivalently, (V, N) is a spanning forest of graph G(V, E). Definition 7 A decimation of a graph G(V, E) is specified by a selection of surviving vertices S ⊂ V and a selection of primary non-surviving edges N ⊂ E such that following two conditions are fulfilled: 1. Graph (V, N) is a spanning forest of graph G(V, E). 2. The surviving vertices S ⊂ V are the roots of the forest (V, N). The trees T (v) of the forest (V, N) with root v ∈ V are called contraction kernels. The connectivity structure of the contracted graph is established by paths connecting two surviving vertices. 2
Neglected level indices refer to contraction from level k to level k + 1.
11
v v
' v
- f
� v v - f
' $
v
& v
? f
� v v - f
%
Dual Edge Contraction
Dual Edge Contraction
Dual Edge Contraction
PP � PP���
PP � PP���
PP � PP���
v
v
a)
' v
% $
� v v
v
& v
% $
' $ � v v
% $
& %
Dual Face Contraction
Dual Face Contraction
PP � PP���
PP � PP���
' v
� v
% v @ @ @ @ @v
b)
' $ � v
v
%
c)
Figure 5: Dual graph contraction: a) normal case, b) multiple edges, c) self-loops. ❍, Sk ; ■, Vk+1 ; ❍, Vk \Sk ; �, Vk \Vk+1 ; −→ , hSk , Vk \Sk i ∈ Nk,l . 12
w
v
-
T (v) ···
-e
e
e�
T (w) ··· �
w
w
Figure 6: Decomposition of connecting path CP (v, w) Definition 8 Let G(V,E) be a graph with decimation parameters (S, N). A path in G(V, E) is called a connecting path between two surviving vertices v, w ∈ S, denoted CP (v, w), if it consists of three subsets of edges E (Figure 6): • the first part is a possibly empty branch of contraction kernel T (v). • the middle part is an edge e ∈ E \N that bridges the gap between the two contraction kernels T (v) and T (w). We call e the bridge of the connecting path CP (v, w). • the third part is a possibly empty branch of contraction kernel T (w). Connecting paths CP (v, w) in G(V, E) are strongly related to the edges ek+1 = (v, w) ∈ Ek+1 in the contracted graph Gk+1 (Vk+1, Ek+1 ): Two different surviving vertices that are connected by a connecting path in Gk are connected by an edge in Ek+1 . For every edge e′ = (v, w) ∈ Ek+1 there exists a connecting path CPk (v, w) in Gk . Dual edge contraction can be implemented by (1) simply renaming all the non-surviving vertices to their surviving parent vertex, (2) deleting all non-surviving edges N and (3) their duals N.
3.2
Equivalent contraction kernels
The combination of two (and more) successive reductions in an equivalent weighting function allowed Burt [6] to calculate any level of the pyramid directly from the base. Similarly we combine two (and more) dual graph contractions (see Figure 7) of graph Gk with decimation parameters hSk , Nk,k+1i and hSk+1 , Nk+1,k+2i into one single equivalent contraction kernel Nk,k+2 = Nk,k+1 ◦ Nk+1,k+2 (for simplicity Gk stands for (Gk+1, Gk+1 )): C[C[Gk , hSk , Nk,k+1i], hSk+1, Nk+1,k+2i] = C[Gk , hSk+1, Nk,k+2i] = Gk+2
(6)
Furthermore, the structure of Gk+1 is determined by Gk and the decimation parameters (Sk , Nk,k+1). Sk+1 := Vk+2 are the vertices surviving from Gk to Gk+2 . The searched contraction kernels must be formed by edges Nk,k+2 ⊂ Ek . This is true for Nk,k+1 but not for Nk+1,k+2 ⊂ Ek+2 if we would simply overlay the two sets of decimation parameters. An edge ek+1 = (vk+1 , wk+1) ∈ Nk+1,k+2 corresponds to a connecting path CPk (vk+1 , wk+1) in Gk . (If there are more than one connecting paths, one must be selected). By definition 8, CPk (vk+1 , wk+1) consists of one branch of Tk (vk+1 ), one branch of Tk (wk+1), and one surviving edge ek ∈ Ek connecting the two contraction kernels Tk (vk+1), Tk (wk+1). 13
(Gk , Gk )
hSk , Nk,k+1i-
(Gk+1 , Gk+1 )
hSk+1, Nk+1,k+2-i
hSk+1 , Nk,k+2i
(Gk+2, Gk+2 ) 6
Figure 7: Equivalent contraction kernel Definition 9 Function bridge: Ek+1 7→ Ek assigns to each edge ek+1 = (vk+1 , wk+1) ∈ Ek+1 one of the bridges ek ∈ Ek of the connecting paths CPk (vk+1 , wk+1): bridge(ek+1 ) := ek .
(7)
Two disjoint tree structures connected by a single edge become a new tree structure. The result of connecting all contraction kernels Tk by bridges fulfills the requirements of a contraction kernel: [ bridge(ek+1 ) (8) Nk,k+2 := Nk,k+1 ∪ ek+1 ∈Nk+1,k+2
The above process can be repeated on the remaining contraction kernels until the base level 0 contracts in one step into the apex Vh = {vh }, the top of the pyramid.
4
Minimum Spanning Tree with DGC
The dual graph contraction algorithm [29, 30] is used to contract edges and create “super” vertices i.e. to create father-son relation between vertices in subsequent levels (vertical relation) and at the same time to preserve the topology, whereas Bor˚ uvka’s algorithm is used to create son-son relation between vertices in the same level (horizontal relation). In Section 5 we will refine the son-son relation to simulate the pop-out phenomena [25, 26], and to find region borders quickly and effortlessly in a bottom-up ’stimulus-driven’ based on local differences in a specific feature (color). Here we expand Bor˚ uvka’s algorithm with the steps that contract edges, remove parallel edges and self loops (if the topology is not changed), see Algorithm 2. Theorem 4 The equivalent contraction kernel of the apex of the graph pyramid is the minimum spanning tree of the base level. Proof: The top h of the pyramid, consists of an isolated vertex (apex). The set of edges at the base level (input graph) which are contracted so that the apex is arrived, is the equivalent contraction kernel N0,h (see Section 3.2). Since Algorithm 2 builds minimum spanning tree (see Theorem 3) this implies that N0,h = MST . 2 14
Algorithm 2 – Bor˚ uvka’s Algorithm with DGC Input: Attributed graph G0 (V, E). 1: k = 0 2: repeat 3: For each vertex v ∈ Gk find the minimum-weight edge e ∈ Gk incident to the vertex v and mark the edges e to be contracted. 4: determine CCik as the connected components of the marked edges e. 5: contract connected components CCik in a single vertex and eliminate the parallel edges (except the one with the minimum weight) and self-loops and create the graph Gk+1 = C[Gk , CCik ]. 6: k =k+1 7: until all connected components of G are contracted into one single vertex. Output: A graph pyramid with an apex. Each level of the pyramid represents a set of sub trees of the MST . In the first step we find the edges with the minimum weight incidented on every vertex v ∈ Gk . We contract the marked edges (in general a connected component) into a single vertex (the survivor, “super vertex”) using edge contraction and face contraction [30] (applying DGC), and produce the graph Gk+1 . The edges of the graph Gk+1 correspond in fact to paths that connect trees in the level Gk . If there are parallel paths that connect the same trees they are removed except the one with the minimum-weight middle edge (see Figure 6). Self-loops are removed if they do not include a surviving vertex. We repeat this process until we arrive at the apex of the graph pyramid. An example of building MST using DGC for Figure 3 is given in Figure 8. The solid lines represent the marked edges (in general connected components) which are contracted by DGC to create the graph of the next level. The equivalent contraction kernel of the apex in level G3 , i.e. the spanning tree consisting of the edges which are contracted, is the minimum spanning tree of the graph G0 as shown in Figure 8. For a graph G(V, E) where |V | = n and |E| = m follows Theorem 5 Algorithm 2 finds the minimum spanning tree after at most log n iterations each of which involves O(m + n) operations. Proof: In the 3rd step each vertex of Gk chooses one edge that will be contracted in the 5th step. Since the contraction of an edge also eliminates one of its incident end vertices the number of vertices decreases by a reduction factor of at least 2 at every iteration. Thus, the number of iterations cannot exceed log2 n. The selection of CC can be performed in O(n) and contraction of edges in O(m). Hence, The overall running time is O((m + n) log2 n). 2
15
apex
G2
DGC G1
DGC
G0
MST (apex) = N0,2 Figure 8: Building MST with DGC.
5
Hierarchy of Partitions
Hierarchies are a significant tool for image partitioning as they naturally mix with homogeneity criteria. Horowitz and Pavlidis [21] define a consistent homogeneity criterium over a set V as a boolean predicate P over its parts Φ(V ) that verifies the consistency property: ∀(x, y) ∈ Φ(V ) x ⊂ y ⇒ (P (y) ⇒ (P (x)).
(9)
In image analysis Equation (9) states that the subregions of homogeneous region are also homogeneous. It follows that if P yr is a hierarchy and P a consistent homogeneity criterium on V then the set of maximal elements of P yr that fulfill P defines a unique partition of V . Thus the joint use of hierarchy and homogeneity criteria allow to define a partitioning in a natural way. Let G(V, E) be a given attributed graph with the vertex set V and edge set E. We will discuss later about the attributes. The goal is to find partitions P = {CC1 , CC2 , ..., CCn } such that these elements satisfy certain properties. Moreover P is a partition of V ∈ G, and [ ∀i 6= j CCi ∩ CCj = φ ∧ CCi = V. (10) i=1,...,n
We use the pairwise comparison of neighboring vertices, i.e. partitions to check for similarities [11, 13, 18]. Felzenszwalb in [11] defines a pairwise group comparison function Comp(CCi , CCj ) that judges whether or not there is evidence for a boundary between two partitions CCi , CCj ∈ P . Note that Comp(CCi , CCj ) is a boolean comparison function for pairs of partitions and it is not defined yet. Definition of Comp(CCi , CCj ) depends on the application. Comp(CCi , CCj ) is true, if there is evidence for a boundary between CCi and CCj , and false when there is no boundary. 16
5.1
Building a Hierarchy of Partitions
In this section we present the pairwise comparison function Comp(·, ·), which tells us if there is a boundary between pairs of regions (groups). This function measures the difference along the boundary of two components relative to a measure of differences of components’ internal differences. This definition tries to encapsulate the intuitive notion of contrast: a contrasted zone is a region containing two connected components whose inner differences (internal contrast) are less than differences within it’s context (external contrast) . We define an external contrast measure between two components and an internal contrast measure of each component. These measures are defined in [11, 13, 18], analogously. Let G(V, E, attrv , attre ) be a given attributed graph with the vertex set V and edge set E on the base level (level 0). Vertices v ∈ V and edges e ∈ E are attributed, i.e. attrv : V → R+ and attre : E → R+ . One possible way to attribute the edges is given in Section 6. The graph on level k of the pyramid is denoted by Gk . Every vertex u ∈ Gk is a representative of a component CCi of the partition Pk . The equivalent contraction kernel of a vertex u ∈ Gk , N0,k (u) is e set of edges of the base level e ∈ E that are contracted; i.e. applying equivalent contraction kernel on the base level, one contracts the subgraph G′ ⊆ G onto the vertex u (see Section 3.2). The internal contrast measure of the CCi ∈ Pk is the largest dissimilarity measure of component CCi i.e. the largest edge weight of the N0,k (u) of vertex u ∈ Gk : Int(CCi ) = max{attre (e), e ∈ N0,k (u)}.
(11)
Let ui , uj ∈ Vk be the end vertices of an edge e ∈ Ek . The external contrast measure between two components CCi , CCj ∈ Pk is the smallest dissimilarity measure between component CCi and CCj i.e. the smallest edge weight connecting N0,k (ui ) and N0,k (uj ) of vertices ui ∈ CCi and uj ∈ CCj : Ext(CCi , CCj ) = min{attre (e), e = (v, w) : v ∈ N0,k (ui) ∧ w ∈ N0,k (uj )}.
(12)
In Figure 9 a simple example of Int(CCi ) and Ext(CCi , CCj ) is given. The Int(CCi ) (Int(CCj )) of the component CCi (CCj ) is the maximum of weights of the solid line edges, whereas Ext(CCi , CCj ) is the minimum of weights of the dashed line edges (bridges) connecting component CCi and CCj on the base level G0 . Vertices ui and uj are representative of the components CCi and CCj . By contracting the edges N0,k (ui ) one arrives to the vertex ui, analogously N0,k (uj ) for the vertex uj (see Section 3.2). The pairwise comparison function Comp(·, ·) between two connected components CCi and CCj can now be defined as: � True if Ext(CCi , CCj ) > P Int(CCi, CCj ), (13) Comp(CCi , CCj ) = False otherwise, 17
ui e
Gk
uj
Gk−1 max{attre (.)} = Int(CCi )
CCi
CCj
max{attre (.)} = Int(CCj )
min{attre (.)} = Ext(CCi , CCj ) Figure 9: Internal and External contrast.
where P Int(CCi , CCj ) is the minimum internal contrast difference between two components: P Int(CCi, CCj ) = min(Int(CCi ) + τ (CCi ), Int(CCj ) + τ (CCj )).
(14)
For the function Comp(CCi , CCj ) to be true i.e. for the border to exist, the external contrast difference must be greater than the internal contrast differences. The reason for using a threshold function τ (CC) in Equation (14) is that for small components CC, Int(CC) is not a good estimate of the local characteristics of the data, in extreme case when |CC| = 1, Int(CC) = 0. Any non-negative function of a single component CC, can be used for τ (CC) [11]. One can define τ to be function of the size of CC: τ (CC) = α/|CC|,
(15)
where |CC| denotes the size of the component CC and α is a constant. More complex definition of τ (CC), which is large for certain shapes and small otherwise would produce a partitioning which prefers certain shapes, e.g. using ratio of perimeter to area would prefer components that are not long and thin.
5.2
Construct Hierarchy of Partitions
The Algorithm 2 in Section 4 in conjunction with the definition of comparison function Comp(·, ·) defined in Section 5.1 is used as basis to build the hierarchy of partitions. We proved that Algorithm 2 builds a minimum spanning tree of a attributed graph, so the definition of internal and external contrast are now recalled for clarity: Int(CC k ) = max{attre (e), e ∈ MST (uk )}. Ext(CCik , CCjk ) = min{attre (e), e = (v, w) : v ∈ MST (uk,i) ∧ w ∈ MST (uk,j )}. P Int(CCik , CCjk ) = min(Int(CCik ) + τ (CCik ), Int(CCjk ) + τ (CCjk )). τ (CC k ) = f (CC k ), 18
(16)
where f (CC k ) is non-negative function, not defined yet. Let Pk = CCik , CCjk , ..., CCnk be the partitions on the level k of the pyramid i.e Pk is the graph Gk (Vk , Ek ). The algorithm to build the hierarchy of partitions is as follows: Algorithm 3 – Construct Hierarchy of Partitions Input: Attributed graph G0 . 1: k = 0 2: repeat 3: for all vertices u ∈ Gk do 4: Emin (u) = argmin{attre (e) | e = (u, v) ∈ Ek or e = (v, u) ∈ Ek } 5: end for 6: for all e = (uk,i, uk,j ) ∈ Emin with Ext(CCik , CCjk ) ≤ P Int(CCik , CCjk ) do 7: include e in contraction edges Nk,k+1 8: end for 9: contract graph Gk with contraction kernels, Nk,k+1 : Gk+1 = C[Gk , Nk,k+1]. 10: for all ek+1 ∈ Gk+1 do 11: set edge attributes attre (ek+1 ) = min{attre (ek ) | ek+1 = C[ek , Nk,k+1]} 12: end for 13: k =k+1 14: until Gk = Gk−1 Output: A region adjacency graph (RAG) at each level of the pyramid. If we assume that the steps 6 to 8 of the Algorithm 3 are left out, it can be shown, that this algorithm produces a MST (Theorem 3). Each vertex uk ∈ Gk i.e. CC k represents a connected region on the base level of the pyramid, and since the presented algorithm is based on Bor˚ ovka’s algorithm [4], it builds a MST (uk ) of each region, i.e N0,k (uk ) = MST (uk ) (see Theorem 4). The idea is to collect smallest weighted edges e (4th step) that could be part of MST , and then to check if the edge weight attre (e) is smaller than the internal contrast of both of the components (MST of end vertices of e) (6th step), if these conditions are fulfilled then these two components will be merged (7th step). Two regions will be merged if the internal contrast, which is represented by its MST , is larger than the external contrast, represented by the weight of the edge, attre (e). All the edges to be contracted form the contraction kernels Nk,k+1, which then are used to create the graph Gk+1 = C[Gk , Nk,k+1] [32], so that the topology is preserved. In general Nk,k+1 is a forest. We update the attributes of those edges ek+1 ∈ Gk+1 with the minimum attribute of the edges ek ∈ Ek that are contracted into ek+1 (11th step). This means that we do not recompute the attributes of the edges but simple inherit it. The output of the algorithm is a pyramid where each level represents a RAG, i.e. a partition. Each vertex of these RAGs is the representative of a MST of a region in the image. In general the top of the pyramid consists of an apex, which represents the 19
whole image. The algorithm is greedy since it collects only the nearest neighbor with the minimal edge weights and merges them if Equation (13) is false. Proposition 1 For any connected attributed graph G(V, E, attre , attrv ) the Algorithm 3 produces a hierarchy over V . Proof: Vertices v ∈ V0 on the base level partition the base graph G0 . It is only needed to check that partitions are partially ordered by the inclusion relation. Assume this is not the case, i.e. ∃(CCik , CCjk ) ∈ Pk such that CCik ∩ CCjk 6= φ but neither Cik ⊂ Cjk nor Cjk ⊂ Cik . There are at least two edges, e′ connecting CCik and CCjk \ CCik and the other edge e′′ connecting CCjk and CCik \ CCjk , from which it follows CCik ∈ Pk ⇒ P Int(CCik , CCjk ) < Ext(CCik , CCjk ) = attre (e′ ),
(17)
and for the edge e′′ one shows attre (e′′ ) = Ext(CCjk , CCik ) ≤ P Int(CCjk , CCik ),
(18)
since P Int(CCjk , CCik ) = P Int(CCik , CCjk ) (Equation (16)) and e′′ ∈ CCik it follows Ext(CCjk , CCik ) ≤ P Int(CCik , CCjk ) < Ext(CCik , CCjk ) ≤ P Int(CCjk , CCik ) ⇒ CCjk ∈ / Pk ,
(19)
contradicting the assumption CCjk ∈ Pk . 2 Proposition 2 For any connected attributed graph G(V, E, attre , attrv ) Algorithm 3 produces partitions on each level which are invariant under any monotone transformation of dissimilarity measure attre . Proof: It should be verified that the order by which the edges are contracted is not changed by monotone transformation. The monotone transformation does not change the total order of edges incidented on a vertex. This implies that the edge with the minimum weight is also not changed by this monotone transformation in the 2nd step of the Algorithm 3. Moreover this transformation does not change the total order of the edges in a connected component CCik and CCjk , implying that the minima of maximum weight edge of the CCik and CCjk is on the same edge (3rd step). Edges marked in the 2nd and 3rd step of Algorithm 3 are not changed by the transformation, which results in the invariance of the partitions. 2 Proposition 3 For any connected attributed graph G(V, E, attre , attrv ) the hierarchy over V is invariant under monotone transformation. 20
Proof: Partitions are invariant under the monotone transformation, Proposition 2, this implies also that the whole hierarchy of partitions is also invariant under this transformation. 2 The presented algorithm collects only the nearest neighbor partitions with the minimal edge weights and merges if they fulfill the criterion Ext(CCik , CCjk ) ≤ P Int(CCik , CCjk ). This way of merging is also known as single linkage clustering [34].
6
Experiments on Image Graphs
We start with the trivial partition, where each pixel is a homogeneous region. The attributes of edges are defined as the difference of its end point vertices. The attributes of edges can be defined as the difference between end point features of end vertices, attre (ui , uj ) = |F (ui) − F (uj )|,
(20)
where F is some feature. Other distances could be used as well e.g. [50], attre (ui, uj ) = e
−||F (ui )−F (uj )||2 2 σI
,
(21)
where F is some feature, and σI is a parameter, which controls the scale of proximity measures of F . F could be defined as F (ui ) = I(ui),
(22)
F (ui ) = [vi , vi · si · sin(hi ), vi · si · cos(hi )],
(23)
for gray value intensity images, or
for color images in HSV color distance [50]. However the choice of the definition of the weights and the features to be used is in general a hard problem, since the grouping cues could conflict each other [36]. For our experiments we use as attributes of edges the difference between pixel intensities, Equation (20), F (ui) = I(ui ), attre (ui , uj ) = |I(ui) − I(uj )|,
(24)
For color images we run the algorithm by computing the distances (weights) in RGB color space. We choose this simple color distances, in order to study the properties of the algorithm. To compute the hierarchy of partitions we also need to define τ (CC) = α/|CC|, 21
(25)
Table 1: Test Images. Image Lena Monarch Object 45 Ramp
Size 512 × 512 = 262144 768 × 512 = 393216 128 × 128 = 16384 223 × 111 = 24753
where α = const and |CC| is the number of elements in CC, i.e. the size of the region. The algorithm has one running parameter α, which is used to compute the function τ . A larger constant α sets the preference for larger components. A more complex definition of τ (CC), which is large for certain shapes and small otherwise would produce a partitioning which prefers certain shapes, e.g. using ratio of perimeter to area would prefer components that are compact, e.g. not long and thin. For computational efficiency we store in vertices the internal contrast P Int() and the size of the connected component |CC| (receptive field). We use indoor and outdoor RGB images given in Table 1. We found that α = 300 produces the best hierarchy of partitions of the images shown in ’Lena’ 3 Figure 10, Monarch 3 Figure 11, and Object45 4 Figure 12 and α = 1000 for the image in Figure 13, after the average intensity attribute of vertices is down-projected onto the base grid. Figures 10, 11, 12 and 13 show some of the partitions on different levels of the pyramid and the number of components. In general the top of the pyramid will consist of one vertex, an apex, which represents the whole image. Note that in all images there are regions of large intensity variability and gradient (see the histograms in Figures 10, 11, 12). This algorithm copes with this kind of gradient and variability. In contrast to [11] the result is a hierarchy of partitions with multiple resolutions suitable for further goal driven, domain specific analysis. On the lower level of the pyramid the image is over segmented (partitioned) whereas in upper it is under segmented (partitioned), the help of mid and high level knowledge would select the proper partitioning. Since the algorithm preserves details in low-variability regions, a noisy pixel would survive through the hierarchy. Of course, image smoothing in low variability regions would overcome this problem. We, however do not smooth the images, as this would introduce another parameter into the method. The hierarchy of partitions can also be built from an oversegmented image to overcome the problem of noisy pixels. Note that the influence of τ in decision criterion is smaller as the region gets bigger for a constant α. The constant α is used to produce a kind of the oversegmented image and the influence of τ is smaller after each level of the pyramid. For an oversegmeted image, where the size of regions is large, the algorithm becomes parameterless. 3 4
Waterloo image database Coil 100 image database
22
Lena
4500 red blue green
(a) Level 0 (262 144 partitions)
Histogram of Lena
255
(b) Level 11 (228)
(c) Level 12 (133)
(d) Level 13 (78)
(e) Level 14 (48)
(f) Level 15 (27)
(g) Level 16 (19)
Figure 10: Some levels of the partitioning of “Lena” and the number of components.
23
Monarch
1200 blue green red
(a) Level 0 (393 216 partitions)
Histogram of Monarch
255
(b) Level 12 (263)
(c) Level 14 (108)
(d) Level 16 (57)
(e) Level 18 (35)
(f) Level 20 (25)
(g) Level 22 (18)
Figure 11: Some levels of the partitioning of “Monarch” and the number of components. 24
Object45 1600
1600 green
red
(a)Level 0 (16 384 partitions)
(b) Level 8 (129)
1600 blue
255
255 Histogram of Object45
(c) Level 10 (43)
(d) Level 12 (13)
255
(e) Level 14 (3)
Figure 12: Some levels of the partitioning of “Object45” and the number of components.
Ramp
a) Level 0 (24 753 partitions)
(b) Level 8 (44)
(c) Level 9 (25)
(d) Level 10 (13)
(e) Level 14 (2)
Figure 13: Some levels of the partitioning of a ramp and the number of components.
25
7
Conclusion and Outlook
In this technical report we introduced a method to build a hierarchy of partitions of an image by comparing in a pairwise manner the difference along the boundary of two components relative to the differences of components’ internal differences. Even though the algorithm makes simple greedy decisions locally, it produces perceptually important partitions in a bottom-up ’stimulus-driven’ way based only on local differences. It was shown that the algorithm can handle large variation and gradient intensity in images. Since our framework is general enough, we can use RAGs of any oversegmented image and build the hierarchy of partitions. External knowledge can help in a top-down segmentation technique. A drawback is that the maximum and minimum criterion is very sensitive to noise, although in practice it has a small impact. Other criteria like median would lead to an NP-complete algorithm. The algorithm has only one running parameter which controls the sizes of the regions. Our future work is to automatically extract this parameter from the image and also to define different comparison functions which will prefer learned regions of specific shapes.
References [1] H. Bischof and W. G. Kropatsch. Hopfield networks for irregular decimation. In W. P¨olzleitner and E. Wenger, editors, Image Analysis and Synthesis, pages 317– ¨ 327. OCG-Schriftenreihe, Osterr. Arbeitsgemeinschaft f¨ ur Mustererkennung, R. Oldenburg, 1993. Band 68. [2] M. Bister, J. Cornelis, and A. Rosenfeld. A critical view of pyramid segmentation algorithms. Pattern Recognition Letters, Vol. 11(No. 9):pp. 605–617, September 1990. [3] M. Borowy and J. Jolion. A pyramidal framework for fast feature detection. In Proc. of 4th Int. Workshop on Parellel Image Analysis, pages 193–202, 1995. [4] O. Bor˚ uvka. O jist´em probl´emu minim´alnim. Pr´ace Mor. Pˇr´ırodvˇed. Spol. v Brnˇe (Acta Societ. Scienc. Natur. Moravicae), III(3):37–58, 1926. [5] O. Boykov, Y. Veskler and R. Zabih. Markov Random Fields with Efficient Approximations. Proc. IEEE Conf. Computer Vision and Pattern Recognition, pages pp. 648–655, 1998. [6] P. J. Burt and E. H. Adelson. The Laplacian pyramid as a compact image code. IEEE Transactions on Communications, Vol. COM-31(No.4):pp.532–540, April 1983. [7] K. Cho and P. Meer. Image Segmentation from Consensus Information. CVGIP: Image Understanding, 68 (1):72–89, 1997.
26
[8] R. Cole, K. P. N., and T. R. E. A Linear-Work Parallel Algorithm for Finding Minimum Spanning Trees. In Proc. SPAA: Annual ACM Symposium on Parallel Algorithms and Architectures, pages 11–15, 1994. [9] M. Cooper. The Tractibility of Segmentation and Scene Analysis. In IJCV, volume Vol. 30 No. 1, pages 27–42, 1998. [10] T. K. Dey, H. Edelsbrunner, S. Guha, and D. V. Nekhayev. Topology Preserving Edge Contraction. Technical Report RGI-Tech-98-018, Raindrop Geomagic Inc., Research Triangle Park, North Carolina., 1998. [11] P. F. Felzenszwalb and D. P. Huttenlocher. Image Segmentation Using Local Variation. In Proceedings of IEEE Conference on Computer Vision and Pattern Recognition, pages pp:98–104, June 1998. [12] M. Fiedler. A Property of Eigenvectors of Nonnegative Symetric Matrices and its Application to Graph Theory. Checz Math. Journal, Vol. 25(No 100):pp.619–633, 1975. [13] B. Fischer and J. M. Buhmann. Data Resampling for Path Based Clustering. In L. van Gool, editor, Proceedings of 24th DAGM Symposium, pages 117–124, Swiss, 2002. Springer Verlag LNCS 2449. [14] M. L. Fredman and D. E. Willard. Trans-dichotomous Algorithms for Minimum Spanning Trees and Shortest Paths. In 31st IEEE Symp. Foundations of Comp. Sci., pages 719–725, 1990. [15] H. Gabow, Z. Galil, T. Spencer, and R. Tarjan. Efficient algorithms for finding minimum spanning trees in undirected and directed graps. Combinatorica, No. 6:109– 122, June 1986. [16] Y. Gdalyahu, D. Weinshall, and M. Werman. Self-Organization in Vision: Stochastic Clustering for Image Segmentation, Perceptual Grouping, and Image Database Organization. IEEE Transaction on Pattern Recognition and Machine Intelligence, 23(10):pages 1053–1074, 2001. [17] S. German and D. German. Stochastic Relaxation, Gibbs distribution, and the Bayesian Restoration of Images. PAMI, Vol. 6:pp.721–741, November 1984. [18] L. Guigues, L. M. Herve, and J.-P. Cocquerez. The Hierarchy of the Cocoons of a Graph and its Application to Image Segmentation. Pattern Recognition Letters, 24(8):pages 1059–1066, 2003. [19] G. Guy and G. Medioni. Inferring Global Perceptual Contours for Pairwise Clustering. International Journal of Computer Vision, pages 424–430, 1996. 27
[20] Y. Haxhimusa, R. Glantz, M. Saib, G. Langs, and W. G. Kropatsch. Logarithmic Tapering Graph Pyramid. In L. van Gool, editor, Proceedings of 24th DAGM Symposium, pages 117–124, Swiss, 2002. Springer Verlag LNCS 2449. [21] S. Horowitz and T. Pavlidis. Picture Segmentation by a Tree Traversal Algorithm. J. Assoc. Compt. Math., Vol. 2(23):pages:368–388, 1976. [22] J.-M. Jolion. Stochastic pyramid revisited. Pattern Recognition Letters, 24(8):pp. 1035–1042, 2003. [23] J.-M. Jolion and A. Montanvert. The adaptive pyramid, a framework for 2D image analysis. Computer Vision, Graphics, and Image Processing: Image Understanding, 55(3):pp.339–348, May 1992. [24] J.-M. Jolion and A. Rosenfeld. A Pyramid Framework for Early Vision. Kluwer, 1994. [25] B. Julesz. Textons, the Elements of Texture Perception and Their Interactions. Nature, (No. 290):pp.91–97, 1981. [26] B. Julesz and J. R. Bergen. Textons, the fundamental elements in preattentive vision and perception of textures. The Bell System Technical Journal, Vol. 62(No. 6):pp.1619–1645, July-August 1983. [27] J. A. K. and D. R.C. Algorithms for Clustering Data. Prentice Hall, Berlin, 1988. [28] D. R. Karger, P. N. Klein, and R. E. Tarjan. A randomized linear-time algorithms to find minimum spanning trees. J. ACM, 42(2):321–328, 1995. [29] W. G. Kropatsch. Building Irregular Pyramids by Dual Graph Contraction. Technical Report PRIP-TR-35, Institute f. Automation 183/2, Dept. for Pattern Recognition and Image Processing, TU Wien, Austria, 1994. [30] W. G. Kropatsch. Building Irregular Pyramids by Dual Graph Contraction. IEEProc. Vision, Image and Signal Processing, Vol. 142(No. 6):pp. 366–374, December 1995. [31] W. G. Kropatsch. Equivalent Contraction Kernels and The Domain of Dual Irregular Pyramids. Technical Report PRIP-TR-42, Institute f. Automation 183/2, Dept. for Pattern Recognition and Image Processing, TU Wien, Austria, 1995. Also available through http://www.prip.tuwien.ac.at/ftp/pub/publications/trs/tr42.ps.gz. [32] W. G. Kropatsch, A. Leonardis, and H. Bischof. Hierarchical, Adaptive and Robust Methods for Image Understanding. Surveys on Mathematics for Industry, No.9:1–47, 1999. 28
[33] J. B. J. Kruskal. On the Shortest Spanning Subtree of a Graph and the Travelling Salesman Problem. In Proc. Am. Math. Soc., volume 7, pages 48–50, 1956. [34] J. Lance and W. Williams. A General Theory of Classificatory Sorting Strategies. Comput. J, No. 9:pages:51–60, 1967. [35] J. Malik, S. Belongie, T. Leung, and J. Shi. Contour and Texture Analysis for Image Segmentation. International Journal on Computer Vision, 43(1):7–27, 2001. [36] J. Malik, S. Belongie, J. Shi, and T. Leung. Textons, contours and regions: Cue integration in image segmentation. In The International Conference on Computer Vision, pages 918–925, 1990. [37] C. Mathieu, I. E. Magnin, and C. Baldy-Porcher. Optimal stochastic pyramid: segmentation of MRI data. Proc. Med. Imaging VI: Image Processing, SPIE Vol.1652:pp.14–22, Feb. 1992. [38] P. Meer. Stochastic image pyramids. Computer Vision, Graphics, and Image Processing, Vol. 45(No. 3):pp.269–294, March 1989. [39] P. Meer, D. Mintz, A. Montanvert, and A. Rosenfeld. Consensus vision. In AAAI-90 Workshop on Qualitative Vision, pages pp.111–115, Boston, Massachusetts, USA, July 29 1990. [40] F. Meyer. Graph based morphological segmentation. In W. G. Kropatsch and J.-M. Jolion, editors, 2nd IAPR-TC-15 Workshop on Graph-based Representation, pages ¨ 51–60. OCG-Schriftenreihe, Band 126, Osterreichische Computer Gesellschaft, 1999. [41] A. Montanvert, P. Meer, and A. Rosenfeld. Hierarchical image analysis using irregular tesselations. IEEE Transactions on Pattern Analysis and Machine Intelligence, PAMI-13(No.4):pp.307–316, April 1991. [42] M. Pavan and M. Pelillo. A New Graph-Theoretic Approach to Clustring and Segmentation. In CVPR03, pages 145–152, 2003. [43] T. Pavlidis. Structural Pattern Recognition. Springer Verlag, 1977. [44] P. Perona and W. Freeman. A Factorization Approach to Grouping. In H. Burkhardt and B. Neumann, editors, LNCS, volume 1406, pages 655–670. Computer Vision Springer Verlag, 1998. [45] R. C. Prim. Shortest connection networks and some generalizations. Bell Sys. Tech. J., Vol. 36:pp.1389–1401, 1957.
29
[46] J. Puzicha, T. Hofmann, and J. Buhmann. Unsupervised testure segmentation in a deterministic annealing framework. IEEE Transaction on Pattern Recognition Analysis and Machine Intellegence, 20(8):803–818, 1998. [47] A. Rosenfeld, editor. Multiresolution Image Processing and Analysis. Springer Verlag, 1984. [48] A. Rosenfeld, R. Hummel, and S. Zucker. Scene labeling by relaxation operations. IEEE Transactions on Systems Man and Cybernetics, 6(6):420 – 433, 1976. [49] E. Sharon, A. Brandt, and R. Basri. Fast multiscale image segmentation. In Proceedings of the IEEE Conference on Computer Vision and Pattern Recognition, pages pp. 70–77, South Carolina, 2000. [50] J. Shi and J. Malik. Normalized Cuts and Image Segmentation. In Proceedings IEEE Conf. Computer Vision and Pattern, pages 731–737, 1997. [51] K. Thulasiraman and M. N. S. Swamy. Graphs: Theory and Algorithms. WileyInterscience, 1992. [52] R. Urquhart. Graph Theoretical Clustering Based on Limited Neighborhood Sets. Pattern Recognition, Vol. 13:3:pp.173–187, 1982. [53] Y. Weiss. Segmentation Using Eigenvectrors: a Unifying View. In Proceedings of the internaltion Conf. on Computer Vision, pages 975–982, 1999. ¨ [54] M. Wertheimer. Uber Gestaltheorie. Philosophische Zeitschrift f¨ ur Forschung und Aussprache, 1:30–60, 1925. [55] D. E. Willis. Source Book of Gestalt Psychology. Harcourt, Brace and Co. New York., 1938, reprinted by Gestalt Journal Press, New York 1997. [56] Z. Wu and R. Leahy. An Optimal Graph Theoretic Approach to Data Clustering: Theory and Its Application to Image Segmentation. IEEE Transactions on Pattern Analysis and Machine Intelligence, Vol.15(11):pp. 1101–1113, November 1993. [57] Y. Gdalyahu, D Weinshall, and M. Werman. A Randomized Algorithm for Pairwise Clustering. Neural Information Processing Systems, NIPS 11:pp. 424–430, 1998. [58] S. Yu and J. Shi. Segmentation with pairwise attraction and repulsion. In Proceedings of the 8th IEEE International Conference on Computer Vision (ICCV’01), pages pp.52–58. IEEE Computer Society, July 2001. [59] C. Zahn. Graph-theoretical methods for detecting and describing gestal clusters. In IEEE Trans. Comput., volume 20, pages 68–86, 1971.
30