{rensso,carlos.caetano,william}@dcc.ufmg.br. AbstractâModeling human behavior and ..... For that, we use Lucas-. Kanade-Tomasi pyramidal implementation ...
Histograms of Optical Flow Orientation and Magnitude to Detect Anomalous Events in Videos Rensso Victor Hugo Mora Colque, Carlos Antˆonio Caetano J´unior and William Robson Schwartz Computer Science Department, Universidade Federal de Minas Gerais, Belo Horizonte - Brazil {rensso,carlos.caetano,william}@dcc.ufmg.br
Abstract—Modeling human behavior and activity patterns for recognition or detection of anomalous events has attracted significant research interest in recent years, particularly among the video surveillance community. An anomalous event might be characterized as an event that deviates from the normal or usual, but not necessarily in an undesirable manner, e.g., an anomalous event might just be different from normal but not a suspicious event from the surveillance stand point. One of the main challenges of detecting such events is the difficulty to create models due to their unpredictability. Therefore, most works model the expected patterns on the scene, instead, based on video sequences where anomalous events do not occur. Assuming images captured from a single camera, we propose a novel spatiotemporal feature descriptor, called Histograms of Optical Flow Orientation and Magnitude (HOFM), based on optical flow information to describe the normal patterns on the scene, so that we can employ a simple nearest neighbor search to identify whether a given unknown pattern should be classified as an anomalous event. Our descriptor captures spatiotemporal information from cuboids (regions with spatial and temporal support) and encodes both magnitude and orientation of the optical flow separately into histograms, differently from previous works, which are based only on the orientation. The experimental evaluation demonstrates that our approach is able to detect anomalous events with success, achieving better results than the descriptor based only on optical flow orientation and outperforming several state-of-the-art methods on one scenario (Peds2) of the well-known UCSD anomaly data set, and achieving comparable results in the other scenario (Peds1). Keywords-Anomalous event detection; spatiotemporal feature extraction; optical flow; histograms of oriented optical flow; smart surveillance.
I. I NTRODUCTION Smart surveillance has obtained increasing attention of the research community and funding due to increased global security concerns regarding effective monitoring of public places, such as airports, railway stations, shopping malls, crowded sport arenas and military installations. Ideally, one would be interested in knowing whether suspicious activities are unfolding in the scene, however, it is extremely difficult to design activity recognition approaches without specific knowledge of the scene and the target activities [1]. Therefore, researchers have developed approaches to locate and recognize anomalous events and possibly hazardous human motions using only the knowledge regarding the normal behavior at a given location, without requiring an extensive knowledge of the scene. Jiang et al. [2] define anomaly detection as the identification
(a) Saint Peter
(b) Stadium
(c) Airport
(d) University pass
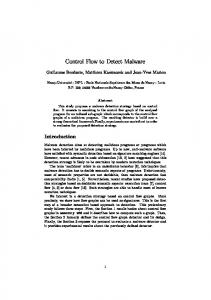
Fig. 1. Different scenarios that might be analyzed through anomalous event detection.
of motion patterns that do not conform to the expected behavior in the video 1 . They also define anomaly as rare or infrequent behavior compared to all other behaviors. However, the identification of this concept requires semantic information and subjective knowledge regarding the scene and the expected behavior. Nonetheless, unknown patterns, in most cases, are very difficult to represent in automatic recognition models. Therefore, the modeling usually is built for the usual recurring patterns found in the scene and when there is no fitting to any usual pattern, one concludes a given event as anomalous. Figure 1 illustrates some examples of environments where anomalous events may take place. Even in such crowded scenarios, humans are able to identify anomalies. However, it is very difficult to define rules to describe them due to their unpredictability and large variance. Since it is impossible to model every anomalous event, we must define ways of describing normal motion patterns for different regions of the scene to be able to recognize when 1 The term anomalous events is sometimes referred to as abnormal events in the literature. We opted for using the term anomalous event because abnormal might refer to a unusual event in a way that is undesirable, which is not our case since we do not have enough semantic information to know whether a given event is suspicious or just different from a normal recurring pattern, for instance.
such patterns are absent to classify them as anomalous events. With that in mind and based on common anomalous events such as pedestrians moving with excessive speed, spatial anomaly (intruders in restricted areas or unusual locations), and presence of non-human objects in unusual locations [3]. We define four characteristics to be used as clues to describe normal motion patterns in a particular region of the scene: i) velocity - speed of moving objects; ii) orientation - common flow of the objects; iii) appearance - texture of the objects; and (iv) density - number of moving objects. To build a representation for normal events in the scene that captures the aforementioned desirable characteristics, we propose a spatiotemporal feature descriptor based on both orientation and velocity inspired by the work of Chaudhry et al. [4], which captures information based on the optical flow orientation and provides the Histogram of Oriented Optical Flow (HOOF). However, they do not capture any information regarding velocity of the moving objects. On the other hand, our novel feature descriptor, called Histograms of Optical Flow Orientation and Magnitude (HOFM), captures not only the orientation, but also the magnitude of the flow vectors, which provide information regarding the velocity of the moving objects and improves considerably the representation of the normal events. In our approach, the HOFM is extracted from cuboids sampled over several frames from non-overlapping spacial regions. During the learning stage, where, only videos containing normal events are presented, we extract and store the HOFM feature vectors for each spatial region, generating a set of “normal patterns”. Then, during the testing stage, after extracting HOFM, a nearest neighbor search is performed considering only that particular region and, according to the distance to the best matching pattern, the event taking place at the particular location and time might be classified as anomalous. According to experimental results, the proposed descriptor combined with a simple nearest neighbor search is able to detect anomalous events accurately. The achievements of the HOFM employment are two-fold: i) it outperforms the results achieved by HOOF, which considers only the orientation extracted by the optical flow; and ii) it obtains better results than several state-of-the-art methods on the well-known UCSD anomaly data set [5]. Very accurate results have been achieved even though a simple nearest neighbor search is applied to identify anomalous events. This demonstrates the high quality of the novel feature descriptor, the HOFM. II. R ELATED W ORKS Detection of anomalous events generally falls into two categories: trajectory analysis and motion analysis. While the former is based on object tracking and typically requires an uncrowded environment to operate, the latter is better suited for crowded scenes by analyzing patterns of movement rather than attempting to distinguish objects [3], [6] individually. The difficulty of the former approach increases proportionally to the number of individuals in the scene [7], [8].
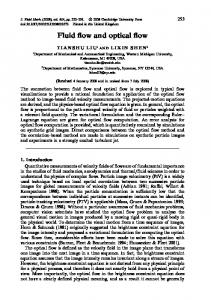
To represent anomalous events, most of researches use mixtures of models, where most typical layout contains description scene step and predict or classifier step. In representation step, the majority of research use dense feature representation, such as gradient based features [9], mixture of dynamic textures [10], contextual information [2], [11] and multiple information based in optical flow [3], [6]. Other type of representation exploits maps of saliency information, such as in [12] and in [13], where a Lagrangian particles map is used to segment the crowds. The main advantages of the methods described in this paragraph are that they have a fixed number of features and are easily to set in classifiers or predictors. On the other hand, the disadvantage is that they depend much of the prior information, such as camera location. To modeling the events, the majority of techniques used are based in Gaussian mixture models (GMM) and hidden Markov models (HMM). In [9], a multi-level hidden Markov model is used to predict the anomalous events in specific regions of the crowd. In [14], [15], [16], Markov models allow the analysis of the scene. The expectation maximization algorithm has been also employed as predictor for anomaly [17]. Another statistical model was employed in [18], where each pixel has a estimated probability to belong to foreground (there is no movement at that particular location), then by using inference techniques, it determines whether a pixel is an anomaly signal. In [19], a robust approach uses a hierarchical mixture of dynamic textures to describe the frame. Despite stated in several papers that models based on the trajectory of crowds are hard to accomplish, Shao et al. [20] proposed a model based in group profiling that is pretty different from common models in the literature. Their model is based in group modeling, where a map of four descriptors define the anomalies. Then, such information is quantized using a bag of words technique and the events are classified as anomalous or not using a support vector machine (SVM). III. P ROPOSED A PPROACH In this section we present our approach for anomaly detection, illustrated in Figure 2. During the training phase, our approach extracts a novel spatiotemporal feature descriptor, called Histograms of Optical Flow Orientation and Magnitude (HOFM), to capture the moving patterns from non-overlapping regions in the video. Such descriptors are stored to be used as instances of normal events (the training video sequences contain only normal events). Then, during the test phase, incoming patterns for each region are compared to the respective stored patterns using a nearest neighbor search approach. Those patterns presenting a significant difference compared to all the stored one are considered as anomalous. A. Histograms of Optical Flow Orientation and Magnitude Initially, our model divides the videos in non-overlapping n×m×t regions, referred to as cuboids. Then, for each cuboid, it builds an orientation-magnitude representation. We present our feature descriptor in Section III-A3, but first we describe the histograms of oriented optical flow (HOOF) [4] and the
Training
Ii - Ii+1
Ii
Ii+1
Ii+2
Θ
OC_1
OC_2
OC_3
Θ
Frame difference
Optical flow
Histograms of Optical Flow Orientation and Magnitude
Testing
Ii - Ii+1
Ii
Ii+1
Ii+2
Θ
OC_1
OC_2
OC_3
Θ
Frame difference
Optical flow
Fig. 2.
Histograms of Optical Flow Orientation and Magnitude
Diagram illustrating the proposed approach to detect anomalous events.
sampling approach used to estimate the optical flow to avoid computing it for every pixel in the image. The Histograms of Optical Flow Orientation and Magnitude (HOFM) is an extension of the histograms of oriented optical flow (HOOF) [4]. 1) Histograms of Oriented Optical Flow: The extraction of HOOF provides a histogram hb,t = [ht,1 , ht,2 , ...., htB ] at each time instant t, for each block b in the frame, in which each flow vector is binned according to its primary angle from the horizontal axis and weighted according to its magnitude. Thus, every optical flow vector, v = [x, y]T , with direction θ = tan−1 ( xy ) and in the range π b−1 π b +π ≤θ 2, there will be more optical flow results per each image pairs, e.g., t = 4 yields three optical flow images. This situation does not modifies the main presented idea, because here we use information of the pixel in each optical flow result, i.e., that each pixel in the cuboid provides information for a determinate bin in the feature vector regarding the same cuboid.
B A
Fig. 5. Nearest neighbor search. Anomalous event pattern is represented by case of point A and a normal event pattern by case of point B.
B. Detection of Anomalous Events The main idea for the classification step is to search for some pattern which is similar to the incoming pattern. Figure 5 illustrates this step by using blue points to represent patterns we have learned and orange points to represent the incoming patterns. If the incoming pattern is likely enough to some of the known patterns, then it is considered as a normal pattern (case of point B), otherwise, if the incoming pattern is not
(a) Sample from Peds1. Fig. 6.
(b) Sample from Peds2.
Two scenarios provided by the UCSD Anomaly Detection Dataset [5].
Algorithm 1 Anomaly detection with nearest neighbor search. 1: procedure N EAREST NEIGHBOR (P, C) 2: P is incoming pattern for cuboid i 3: C is a set o learned patterns for cuboid i 4: for w = 1 to W do . W number of learned patterns 5: d ← dist(Cw , P ) . Euclidean Distance 6: if d < τ then 7: return T rue 8: return F alse
close to any learned patterns, it will be considered as an anomalous event (case of point A). In the recognition step, for each cuboid, we use the descriptors computed during learning to classify an incoming pattern P , at the same spatial location of the cuboid, as anomalous or normal. The steps for the classification process are shown in Algorithm 1. This algorithm returns False when none of the patterns seen during training are similar to the incoming pattern P , therefore, classifying P as an anomaly. IV. E XPERIMENTAL R ESULTS The experiments are divided in two parts. The first part shows a comparison of our proposed feature, HOFM, with the classical histograms of oriented optical flow (HOOF). Then, the second part compares our results with other methods published in the literature. The model was developed using the Smart Surveillance Framework (SSF) [22], built upon OpenCV using C/C++ programming language. Experimental setup. We assess the performance of our approach in the well-known UCSD Anomaly Detection Dataset [5]. UCSD is an annotated publicly available dataset for the evaluation of abnormal detection and localization in crowded scenarios overlooking pedestrian walkways [10]. The dataset was acquired with a stationary camera with frames of 238 × 158 pixels and at a frame rate of 10 frames per second. Anomalous events are due to either (i) the circulation of non-pedestrian entities in the walkways, or (ii) anomalous pedestrian motion patterns.
TABLE I A NOMALY DETECTION AUC AND EER (%) COMPARISON OF HOFM AND HOOF ON THE UCSD DATASET.
Peds1 EER (%)
AUC
Peds2 EER (%)
Approach
AUC
HOOF
0.515
49.1
0.611
40.1
HOFM
0.715
33.3
0.899
19.0
The UCSD videos are divided into two scenarios: Peds1 and Peds2, each captured by a camera at a different location, as can be seen in Figure 6. The videos recorded from each scenario were split into various video sequences (clips) each of which has around 200 frames. The number of training sequences are 27 and 16 for Peds1 and Peds2, respectively. The criterion used to evaluate anomaly detection accuracy was based on framelevel, as most of the works, in which the algorithm predicts which frames contain anomalous events and those predictions are compared to the ground-truth annotations. As described in Section III, our anomaly detection approach has two main parameters: (i) the threshold τ , for the nearest neighbor search; and (ii) the cuboids size (n × m × t). Here, we varied the τ value to generate the ROC curves, the equalerror rate (EER) and the area under curve (AUC). In addition, we experimentally set a fixed the cuboid size to 30 × 30 × 5. Feature descriptor evaluation. Table I shows the results of our experiments over the UCSD dataset in comparison with the classical histograms of oriented optical flow (HOOF) feature descriptor. It is clearly noticeable that our proposed feature, the HOFM, outperforms HOOF. This can be understood by the fact that HOOF features are based only on the direction information, disregarding velocity information (capture by the magnitude of the optical flow), which is an important aspect for anomaly detection. The ROC curves for each scenario are shown in Figure 7. Comparison to other anomaly detection approaches. Table II shows our results and the ones reported on the literature considering the UCSD dataset. On Peds1 scenario, our method
1
0.8
0.8 true positive rate
true positive rate
1
0.6
0.4
0.4
0.2
0.2
0 0
0.6
Ours (0.715) HOOF (0.515) 0.2
0.4 0.6 false positive rate
0.8
Ours (0.899) HOOF (0.611)
0 0
1
0.2
(a) Peds1.
0.4 0.6 false positive rate
0.8
1
(b) Peds2.
Fig. 7. ROC curves and the AUC (in parenthesis) achieved by the HOFM (Ours) and HOOF feature descriptors for the UCSD Anomaly Detection Dataset employing the same nearest neighbor search for classification for both feature descriptors. TABLE II A NOMALY DETECTION AUC AND ERR (%) RESULTS OF HOFM AND OTHER PUBLISHED RESULTS ON UCSD DATASET. T HE RESULTS WERE OBTAINED FROM [19] WITH THE ADDITION OF OUR RESULTS .
Published results Our results
Peds1 ERR (%)
AUC
MDT-temporal [19] MDT-spatial [19] MPPCA [16] Force Flow [17] Adam (LMH) [6]
0.825 0.600 0.674 0.688 0.634
22.9 43.8 35.6 36.5 38.9
0.765 0.750 0.710 0.702 0.581
27.9 28.7 35.8 35.0 45.8
HOFM
0.715
33.3
0.899
19.0
achieved an equal error rate (EER) of 33.3% and an AUC of 0.715, being competitive to most of the reported methods on the literature. On the other hand, on Peds2, we achieved an EER of 19.0% and AUC of 0.899, outperforming all reported results2 . The ROC curves for the two scenarios are shown in Figure 8. Discussion. Here, we investigate the cases where our method failed. Most of the undetected anomalous frames correspond to very challenging cases, such as a skateboarder or a wheelchair going in an almost similar velocity of the pedestrians and with partial occlusions, as shown in Figures 9(b) and 9(c). These errors occurred during sequences 21 and 12 of Peds1 and Peds2, respectively. An additional reason is that our proposed feature does not capture texture information. Figure 10 shows the ROC curves for each scenario with and without these video sequences. We can see that without such sequences, our approach achieved better results. Another important aspect to be considered is the anoma2 Li et al. [19] also evaluated H-MDT with CRF-filtering achieving EER = 18.5%, which is very similar to our result on Peds2 scenario (EER = 19.0%). However, the authors of [19] did not provide the AUC value (neither on their paper nor upon request through personal messages).
AUC
Peds2 ERR (%)
Approach
lous type to be considered. In this work, we introduce four characteristics that may lump together most types of anomaly. However, we use just two of them (velocity - captured by the optical flow magnitude, and orientation - captured by the optical flow orientation) because they are simple (computationally) to obtain, which is demanded in the case of real time applications. Although our model considers only these two characteristics, we still were able to achieve accurate results when compared to state-of-the-art approaches. We also need to consider the variability of the anomalous concept. This aspect may be observed during the testing phase on the UCSD dataset. For instance, some locations may report no movement patterns on the training sequences, but on the testing people might appear in those regions, which should be considered as an anomaly since such patterns were not present in training. However, the ground truth annotations of the UCSD only label objects with different speed or appearance as anomaly, but ignores places or orientations, labeling such instances as normal patterns. Figure 9(d) illustrates one of such cases. In this instance, the marked location is never occupied by pedestrians during training, however pedestrians appear during testing, which should be considered as anomalous.
1
0.8
0.8 true positive rate
true positive rate
1
0.6 MDT-temp. (0.825) MDT-spat. (0.600) MPPCA (0.674) Force Flow (0.688) LMH (0.634) Ours (0.715)
0.4 0.2 0 0
0.2
0.4 0.6 false positive rate
0.8
MDT-temp. (0.765) MDT-spat. (0.750) MPPCA (0.710) Force Flow (0.702) LMH (0.581) Ours (0.899)
0.4 0.2
1
(a) Peds1. Fig. 8.
0.6
0 0
0.2
0.4 0.6 false positive rate
0.8
1
(b) Peds2.
ROC curves and the AUC (in parenthesis) for the UCSD Anomaly Detection Dataset (plot obtained from [19] with the addition of our results).
(a) True positive example
(b) False negative example
(c) False positive example
(d) False positive example
Fig. 9.
Some examples analyzed through anomaly detection.
However, even though our method classifies that location as anomalous, the ground truth considers it as a normal case, generating a false positive. V. C ONCLUSIONS AND F UTURE W ORKS In this work, we introduced a new method to detect anomalous events in crowd scenes. Moreover, we proposed a novel descriptor approach based on optical flow information estimated from the scene, called Histograms of Optical Flow Orientation and Magnitude (HOFM). Besides of measuring orientation based on temporal information, the proposed feature descriptor also extracts velocity information provided by the magnitude of the flow vectors. We experimentally compared the performance of the proposed descriptor to the
classical histograms of oriented optical flow (HOOF) and achieved great improvements. We evaluated the performance of our approach compared to other published results on the UCSD Anomaly Detection dataset, a well annotated publicly available dataset for the evaluation of anomaly detection. As shown on the experimental results, our approach obtained the highest AUC values when compared to state-of-the-art methods in the Peds2 scenario. Results also yielded comparable results in the Peds1 scenario. The results demonstrated the suitability of the proposed HOFM to the anomaly detection problem. Such suitability becomes even more emphasized due to the fact that we are employing a simple nearest neighbor search to classify incoming patterns, as opposed to other approaches that employ very sophisticated classification and modeling techniques. It is also important to report the difficulty to find challenging datasets for detection of anomalous events in crowded scenes. Few datasets have been reported e.g., [6] and [23], but these have various limitations in terms of size, saliency of the anomalies and evaluation criteria, emphasizing the need for more evaluation datasets. Future directions include the evaluation of the proposed feature regarding processing time and evaluation of the proposed approach on other video classification problems. In addition, we intend to improve our results by exploiting further parameter setups, such as the evaluation of different number of magnitude and orientation bins. ACKNOWLEDGMENTS The authors would like to thank the Brazilian National Research Council – CNPq (Grants #487529/2013-8 and #477457/2013-4), the Minas Gerais Research Foundation – FAPEMIG (Grant APQ-00567-14) and the Coordination for the Improvement of Higher Education Personnel – CAPES (DeepEyes Project).
1
0.8
0.8 true positive rate
true positive rate
1
0.6
0.4
0.2
0 0
0.6
0.4
0.2 Without 21 video sequence (0.776) With 21 video sequence (0.715) 0.2
0.4 0.6 false positive rate
0.8
1
(a) Peds1.
0 0
Without 12 video sequence (0.924) With 12 video sequence (0.899) 0.2
0.4 0.6 false positive rate
0.8
1
(b) Peds2.
Fig. 10. ROC curves and the AUC (in parenthesis) for the UCSD Anomaly Detection Dataset, with and without video sequence 21 and video sequence 12.
R EFERENCES [1] J. Aggarwal and M. Ryoo, “Human activity analysis: A review,” ACM Comput. Surv., vol. 43, no. 3, pp. 16:1–16:43, Apr. 2011. [Online]. Available: http://doi.acm.org/10.1145/1922649.1922653 [2] F. Jiang, Y. Wu, and A. Katsaggelos, “Detecting contextual anomalies of crowd motion in surveillance video,” in Image Processing (ICIP), 2009 16th IEEE International Conference on, Nov 2009, pp. 1117–1120. [3] D. Ryan, S. Denman, C. Fookes, and S. Sridharan, “Textures of optical flow for real-time anomaly detection in crowds,” in Advanced Video and Signal-Based Surveillance (AVSS), 2011 8th IEEE International Conference on, Aug 2011, pp. 230–235. [4] R. Chaudhry, A. Ravichandran, G. Hager, and R. Vidal, “Histograms of oriented optical flow and binet-cauchy kernels on nonlinear dynamical systems for the recognition of human actions,” in Computer Vision and Pattern Recognition, 2009. CVPR 2009. IEEE Conference on, June 2009, pp. 1932–1939. [5] S. V. C. Lab, “UCSD anomaly data set,” 2014, http://www.svcl.ucsd.edu/projects/anomaly/. [Online]. Available: http: //www.svcl.ucsd.edu/projects/anomaly/ [6] A. Adam, E. Rivlin, I. Shimshoni, and D. Reinitz, “Robust real-time unusual event detection using multiple fixed-location monitors,” Pattern Analysis and Machine Intelligence, IEEE Transactions on, vol. 30, no. 3, pp. 555–560, March 2008. [7] O. Popoola and K. Wang, “Video-based abnormal human behavior recognition;a review,” Systems, Man, and Cybernetics, Part C: Applications and Reviews, IEEE Transactions on, vol. 42, no. 6, pp. 865–878, Nov 2012. [8] S. Vishwakarma and A. Agrawal, “A survey on activity recognition and behavior understanding in video surveillance,” The Visual Computer, vol. 29, no. 10, pp. 983–1009, 2013. [Online]. Available: http://dx.doi.org/10.1007/s00371-012-0752-6 [9] L. Kratz and K. Nishino, “Anomaly detection in extremely crowded scenes using spatio-temporal motion pattern models,” in Computer Vision and Pattern Recognition, 2009. CVPR 2009. IEEE Conference on, June 2009, pp. 1446–1453. [10] V. Mahadevan, W. Li, V. Bhalodia, and N. Vasconcelos, “Anomaly detection in crowded scenes,” in Computer Vision and Pattern Recognition (CVPR), 2010 IEEE Conference on, June 2010, pp. 1975–1981. [11] Y. Cong, J. Yuan, and J. Liu, “Sparse reconstruction cost for abnormal event detection,” in Computer Vision and Pattern Recognition (CVPR), 2011 IEEE Conference on, June 2011, pp. 3449–3456.
[12] X. Sun, H. Yao, R. Ji, X. Liu, and P. Xu, “Unsupervised fast anomaly detection in crowds,” in Proceedings of the 19th ACM International Conference on Multimedia, ser. MM ’11. New York, NY, USA: ACM, 2011, pp. 1469–1472. [Online]. Available: http://doi.acm.org/10.1145/2072298.2072042 [13] S. Ali and M. Shah, “A lagrangian particle dynamics approach for crowd flow segmentation and stability analysis,” in Computer Vision and Pattern Recognition, 2007. CVPR ’07. IEEE Conference on, June 2007, pp. 1–6. [14] E. Andrade, S. Blunsden, and R. Fisher, “Modelling crowd scenes for event detection,” in Pattern Recognition, 2006. ICPR 2006. 18th International Conference on, vol. 1, 2006, pp. 175–178. [15] ——, “Hidden markov models for optical flow analysis in crowds,” in Pattern Recognition, 2006. ICPR 2006. 18th International Conference on, vol. 1, 2006, pp. 460–463. [16] J. Kim and K. Grauman, “Observe locally, infer globally: A spacetime mrf for detecting abnormal activities with incremental updates,” in Computer Vision and Pattern Recognition, 2009. CVPR 2009. IEEE Conference on, June 2009, pp. 2921–2928. [17] R. Mehran, A. Oyama, and M. Shah, “Abnormal crowd behavior detection using social force model,” in Computer Vision and Pattern Recognition, 2009. CVPR 2009. IEEE Conference on, June 2009, pp. 935–942. [18] B. Anti´c and B. Ommer, “Video parsing for abnormality detection,” in ICCV, 2011. [19] W. Li, V. Mahadevan, and N. Vasconcelos, “Anomaly detection and localization in crowded scenes,” Pattern Analysis and Machine Intelligence, IEEE Transactions on, vol. 36, no. 1, pp. 18–32, Jan 2014. [20] J. Shao, C. Change Loy, and X. Wang, “Scene-independent group profiling in crowd,” June 2014. [21] J. Y. Bouguet, “Pyramidal implementation of the lucas kanade feature tracker: Description of the algorithm,” Jean-YvesBouguet, 2002. [22] A. C. Nazare Jr., C. E. dos Santos, R. Ferreira, and W. R. Schwartz, “Smart Surveillance Framework: A Versatile Tool for Video Analysis,” in IEEE Winter Conf. on Applications of Computer Vision (WACV), 2014, pp. 753–760. [23] Y. Benezeth, P.-M. Jodoin, V. Saligrama, and C. Rosenberger, “Abnormal events detection based on spatio-temporal co-occurences,” in Computer Vision and Pattern Recognition, 2009. CVPR 2009. IEEE Conference on, June 2009, pp. 2458–2465.