Optimal PLL Design for Pedestrian Hand-Held GNSS Receivers Srinivas Bhaskar, Dr. James T. Curran, Dr. Gérard Lachapelle PLAN Group, Geomatics Engineering, Schulich School of Engineering 2500 University DR NW, University of Calgary, Calgary, Canada, T2N 1N4
[email protected],
[email protected],
[email protected] Abstract— This paper investigates the design of carrier phase tracking algorithms for use in hand-held GNSS receivers. Signal propagation effects in a hand-held pedestrian environment are analysed, examining pedestrian dynamics, propagation-based and receiver-based signal losses. An appropriate model of pedestrian dynamics is developed via measurements on a host of test-subjects using a software receiver and inertial sensors. Propagation losses are also examined. The resultant characterization can be used to develop a constrained carrier phase tracking loop filter. Keywords—GNSS, hand-held GNSS receiver, inertial sensors, pedestrian navigation, phase locked loops
I. INTRODUCTION Global Navigation Satellite System (GNSS) receivers are widely used today and have found new applications in the mass market with the increased number of smart phones, the E-911 mandate, the need for personal asset tracking, personal navigation, road tolling systems, social networking, to name but a few [1]-[3]. Many of the devices providing this positioning service must also be highly portable; therefore, there is a need to provide high accuracy reliable position solutions in hand-held applications. A hand-held unit, however, places many constraints on the development of a navigation receiver. The hand-held unit needs to be light weight, should consume little power, must have a small form factor, should require limited hardware resources, and the finished product must be of relatively low cost. Apart from system design issues, the operating conditions also impose several constraints on the GNSS receiver for hand-held applications. The hand-held receivers should deal with user dynamics, which are significantly larger than vehicle dynamics in terms of acceleration. Hand-held GNSS receivers are operated anywhere from open sky to indoor environments, representing a significant range of signal quality. As a result, the receiver must incorporate high sensitivity algorithms to enable the use of attenuated signals for navigation. The antenna design also has a significant role on the hand-held GNSS receiver development. The antennas cannot be directional as the hand-held receiver may assume any orientation. The use of omni-directional antennas, however, can compound multipath propagation problems leading to poor received signal quality. Given the harsh nature of the hand-held receiver, a designer must ensure that every receiver algorithm is fully optimized and conditioned on prevailing conditions. To perform an effective optimization, first, the operating environment must be well understood. To this end, the work presented in this paper characterizes the pedestrian dynamics and time-varying signal attenuation due to the presence of the human body. The results derived are used to
design a tracking loop filter optimized for pedestrian environment in the outdoors. It is emphasized that characterizing both the pedestrian dynamics and the satellite signal attenuation due to the human body are important in the context of pedestrian hand-held setup as the signal propagation effects depends on both. To this end, the accelerometers data collected during field tests are analysed offline to characterize pedestrian dynamics. These results, along with the signal attenuation characterization, can be used to optimize the tracking loops for the characterized conditions. The work can further extend to use live accelerometers data for adaptive tuning of tracking loops to suit prevailing conditions. The remainder of the paper is organized as follows. Section II provides a brief background of the work and defines the scope of the work presented herein. Section III describes the experimental setup corresponding to the data collection for this work. Sections IV and V present the results of pedestrian dynamics and signal attenuation characterization, respectively. A few possible approaches of loop filter design based on the results presented in this paper are discussed in section VI. II. BACKGROUND AND LITERATURE REVIEW In order to efficiently design GNSS receiver tracking algorithms, it is crucial that the operating environment and the signal propagation channel be understood and characterized. There have been many attempts to model the GNSS indoor propagation channel [4]-[6] via their probability density functions and temporal/spectral variations, such as power spectral densities. However, the work was limited to the indoor environment, lacking consideration of a pedestrian setup, where the receiver is continuously subject to time-variable attenuation along with pedestrian dynamics. A full characterization of the GNSS signal propagation channel in a pedestrian outdoor environment and employing a hand-held setup is somewhat lacking. Moreover, the signal propagation effects during activities such as gentle walking and running, in open sky and under forest canopy environments need to be investigated. The antennas used in hand-held receivers are subjected to change in orientation. The case of a head mounted pedestrian carrier phase based solution is discussed in [7] where it was shown that the user dynamics experienced by the antenna caused issues with carrier phase tracking. The proximity of the human body to a portable device antenna used is discussed in [8], wherein signal power level variations of around 12 dB were measured, even for satellite at approximately 85° of elevation. In addition to signal attenuation, other effects of human proximity to antennas such as disturbance to radiation pattern and mismatch of feed-point impedance can be significant [9]. Other than the GNSS signal propagation model, characterization of pedestrian dynamics may yield a better
ASI-SBN 2013 Conference, Session TS-8, Bengaluru, India (Apr 17-18, 2013)
1/6
understanding of the dynamics of the received signal. This information can be useful in the design of tracking loops, where, for example, the loop filter can be conditioned to match the characteristic shape of the phase process. It is shown in [10] that constraining the so-called Doppler bandwidth to match the required dynamics yields better tracking performance. More specifically, the bandwidth, as a design parameter, can be chosen so that bandwidth of the user velocity matches that of the loop filter. This work aims to extend this concept further and to develop a fully constrained carrier phase tracking loop filter, conditioned on a model of the dynamics experienced by a hand-held receiver and knowledge of the propagation channel. This research involves characterization of the GNSS signal in the hand-held pedestrian receiver environment and the design of optimal carrier tracking algorithms conditioned on this model. The received signal is characterized via temporal models of signal power and signal phase variations. Optimal carrier tracking algorithms are then developed based on these signal models, exploring the concept of on-line context awareness. In order to optimize the PLL design for pedestrian receivers, it is of interest to analyze pedestrian dynamics when the device is placed in a pedestrian’s pocket and backpack. The characterization is done in terms of the acceleration and position displacement of the portable device over time. This result will be used to constrain the tracking loop filter, to shape the loop filter with characterized pedestrian dynamics and to improve noise performance of the tracking filter.
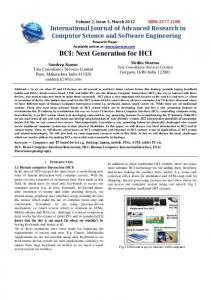
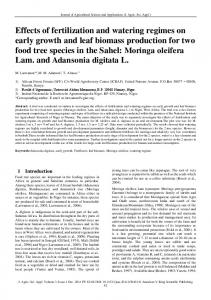
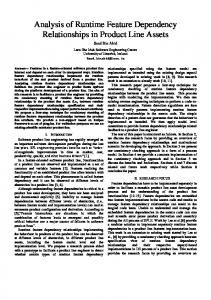
The satellite signal attenuation due to the presence of human body was analyzed using a high-gain antenna (Novatel 701 GG) fixed on a stable platform under open-sky as shown in Figure 1. The antenna signal was captured by a radio frequency (RF) front-end, after amplification using low noise amplifier (LNA), via intermediate frequency (IF) samples collected at 10 MHz sampling rate. The duration of the data collection was approximately 200 seconds and for each collection, the distance between the antenna from the ground was adjusted to various levels relative to the height of the human subject, as shown in Figure 2. The human subject walked around the antenna setup at various speeds keeping a radial distance of approximately 1 m from the antenna. This enabled the analysis of the time-varying attenuation of satellite signals spanning the elevation and azimuth range of satellites. Circular Path
≈ 1 m Antenna
Human Satellite
III. EXPERIMENTAL SETUP The pedestrian dynamics characterization was done herein using 3 Space sensors, a portable inertial measurement unit (IMU) from Yost Engineering, Inc., these being most suitable in terms of size and power consumption [11]. The 3 Space sensors include 3-axis MEMS grade accelerometers capable of providing raw IMU measurements at a maximum rate of 876 Hz. Selected specifications of these accelerometers are presented in Table 1. The sensors were placed at various locations of the body including the hand, pocket, backpack, and strapped to the subject's arm, as shown in Table 2. The inertial data was re-sampled to a uniform sampling frequency of 1 KHz using linear interpolation. The re-sampled data was low-pass filtered using a 10th order Butterworth filter with a cut-off frequency of 15 Hz. The choice of the cut-off frequency is due to the fact that the pedestrian dynamics are generally low frequency signals (for example, significantly less than 10 Hz).
Figure 1: Experimental Setup for signal attenuation characterization
1 2 3 4 5 6
Table 1: Accelerometer specifications Accelerometer Specifications Dynamic range +/- 6 g - +/- 12 g (Configurable) Noise spectral density 650 μg/√Hz Table 2: Sensor placement locations during dynamics characterization Dataset name Location A Location B Location C Location D
Location on subject Backpack Hand-held Pocket Arm
Dynamics involved Walking on a flat terrain Walking on a flat terrain Walking on a flat terrain Running on a track
Figure 2: Antenna placement from the ground at various levels
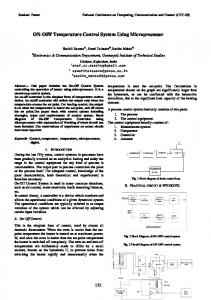
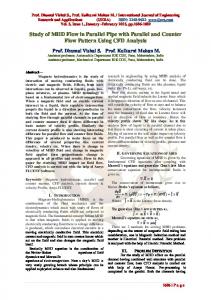
IV. ANALYSIS OF PEDESTRIAN DYNAMICS The pedestrian acceleration at various locations of the subject's body was captured by the IMU. Time series plots of a selected portion of the acceleration at various locations (labelled according to Table 2) are shown in Figure 3. Also shown is the power spectral density of positions corresponding to the dataset. The process of obtaining positions from acceleration is explained below.
ASI-SBN 2013 Conference, Session TS-8, Bengaluru, India (Apr 17-18, 2013)
2/6
632
634
636
638
Power Spectral Density (dB/Hz)
X (m/s2)
30 20 10 630
640
Y (m/s2)
0 -20 632
634
636
638
640
632
634 636 Time (s)
638
640
Z (m/s2)
-40 630 10 5 0 -5
Power Spectral Density (dB/Hz)
(A)
10 0
Z (m/s2)
Y (m/s2)
X (m/s2)
Z (m/s2)
Y (m/s2)
X (m/s2)
220
20 0 -20 440 20 0 -20 440 20 0 -20 -40 -60 -80 440
222
224
226
228
230
222
224
226
228
230
222
224 226 Time (s)
228
230
442
442
442
444
444
446
446
444 446 Time (s)
(B)
448
448
448
450
450
450
(C)
20 0 -20 440 10 0 -10 -20 -30 440 0 -20 -40 -60 440
442
442
442
444
444
446
446
444 446 Time (s)
448
448
448
450
450
450
x-axis y-axis z-axis
0 -10 -20 -30 -40 -5 -4 -3 -2 -1 0 1 2 Frequency (Hz)
3
4
5
x-axis y-axis z-axis
10 0 -10 -20 -30 -40 -5 -4 -3 -2 -1 0 1 2 Frequency (Hz)
Power Spectral Density (dB/Hz)
-10 220 0 -10 -20 -30 220 0 -5 -10
Power Spectral Density (dB/Hz)
Z (m/s2)
Y (m/s2)
X (m/s2)
630
10
3
4
5
x-axis y-axis z-axis
10 0 -10 -20 -30 -5 -4 -3 -2 -1 0 1 2 Frequency (Hz)
3
4
5
x-axis y-axis z-axis
10 0 -10 -20 -30 -5 -4 -3 -2 -1 0 1 2 Frequency (Hz)
3
4
5
(D) Figure 3: Time series of acceleration and PSD of position for locations A, B, C, and D respectively
ASI-SBN 2013 Conference, Session TS-8, Bengaluru, India (Apr 17-18, 2013)
3/6
It can be observed that the pedestrian acceleration is quasiperiodic. In the frequency domain the periodic nature of acceleration will manifest itself in a certain dominant set of frequencies as indicated in the spectrogram (shown in Figure 4) of the acceleration corresponding to the dataset of location A.
location. The dataset in location A is dominated by the second resonant at 2 Hz whereas other datasets corresponding to locations B and C are dominated by the first resonant at 1 Hz. It is interesting to note the shift in the first resonant frequency for dataset in location D; this is explained by the fact that the pedestrian was running as opposed to walking in the other three datasets. However, there is a clear pattern in the measured power spectral density curves for all the sensors locations.
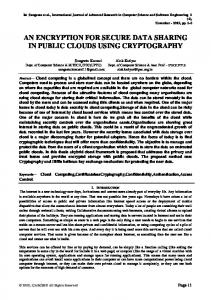
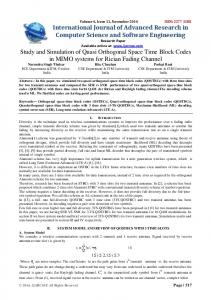
V. ANALYSIS OF SIGNAL ATTENUATION DUE TO HUMAN BODY The IF samples collected at various antenna levels were processed and the results in terms of the maximum and the minimum C/N0 is shown in Figure 5. The difference between the maximum and minimum C/N0 will be referred to as the 'C/N0 variation' herein.
Figure 4: Power spectral density of acceleration corresponding to the x-axis of location A dataset The acceleration data was divided into small blocks of 2 s each to obtain the spectrogram plot in Figure 4. The reasons to choose block-wise analysis of the data are the following: the signal of interest, namely the pedestrian acceleration, is not stationary; the Gauss-Markov noise associated with IMU measurements, known as the bias and scale factor, can have a profound impact on the estimated PSD. Therefore processing small duration of data minimises the effect of correlated IMU noise on the estimated PSD of interest. The acceleration data in small pockets were integrated twice to obtain the corresponding position, hence the PSD of position. The mean values of the accelerations and velocities were removed before integration, as they can introduce a slope in the frequency domain. Also, the unit of the derived position was converted from meters to radians before computing the corresponding PSD. This is done in order to be consistent with the unit of the carrier phase, which we are interested in, as will be become clearer in the later section of this paper where the PSDs of the position and the corresponding carrier phase are compared. The PSD plots corresponding to each dataset are also shown in Figure 3. It can be seen that the PSD of the position process is not entirely a low-pass process as it consists of some low-pass and several resonant frequency components. This observation is the key to the improved design of the loop filters envisaged in this work and will be discussed in more detail in the PLL design section. It is worth noting that the magnitude and centre frequency of the resonant components vary with sensor
50
50
40
40
30
30
0 10 20 30 40 50 60 70 80 90 Location: 1 50
0 10 20 30 40 50 60 70 80 90 Location: 2 50
40
40
30
30
0 10 20 30 40 50 60 70 80 90 Location: 3 50
0 10 20 30 40 50 60 70 80 90 Location: 4 50
40
40
30
30
0 10 20 30 40 50 60 70 80 90 Location: 5
0 10 20 30 40 50 60 70 80 90 Location: 6
Figure 5: C/N0 variations corresponding to various antenna locations pertaining to satellite attenuation experiment It is evident that the C/N0 variation is generally large for satellites with low elevation. The variation further increases when lowering the antenna height from location 1 to 6 corresponding to the levels marked with the human subject's height in Figure 2. This observation is in agreement with the intuition that lowering the antenna level in the setup will increase the portion of the human body blocking the antenna signal. The statistics corresponding to the C/N0 variation are computed for all antenna levels using the available satellites at different elevations and are presented in Table 3. Table 3: Statistics of C/N0 variation Antenna level
Min (dB-Hz)
Max (dB-Hz)
Mean (dB-Hz)
1 2 3 4 5 6
3.02 3.06 3.72 2.97 3.45 4.20
5.76 9.32 9.19 9.98 11.81 12.29
4.11 4.96 4.96 5.53 6.88 9.02
ASI-SBN 2013 Conference, Session TS-8, Bengaluru, India (Apr 17-18, 2013)
Number of Satellites used to compute statistics 7 7 7 7 6 6
4/6
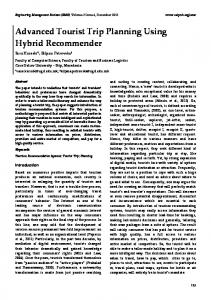
The satellite signal attenuation over time is presented in Figure 6 for a selected satellite corresponding to Antenna level 6. It is worth emphasizing that the satellite signal attenuation due to the human body is a complex function of the type of the human body, the distance from the human body to the antenna, as well as the antenna type. Therefore, extensive analysis is needed to fully understand the effect with the work presented herein being the starting point.
48 46 44 42 40 38 0
50
Fast
100 Time (s)
48
48
46
46
150
200
44
44
42
42 40 90
Slow
40 100
110
120
38 170
180
190
200
Figure 6: Satellite signal attenuation over time due to human subject walking around the antenna
VI. OPTIMAL DESIGN OF PHASE LOCK LOOPS The acceleration experienced by the pedestrian GNSS antenna when projected to user-satellite line-of-sight introduces a change in Doppler frequency of the satellite. The magnitude of change is proportional to the satellite-user velocity, which is the integral of the line of sight acceleration. Therefore, the tracking loop has to adjust the local carrier frequency in order to align with the incoming signal. This task is accomplished in the PLL by utilizing the correlator measurements, which provides change in carrier phase information. The digital GNSS PLL forms differences of these phase measurements in order to estimate the change in frequency, and updates the local carrier frequency accordingly. In order to achieve the best possible PLL performance, the loop filter must be designed to produce a suitable trade-off between allowing the signal to pass through while rejecting the noise. In practice, the non-stationary nature of the receiver imposes a significant challenge to accurately estimating the signal. Although adaptive filter techniques are available to combat the non-stationary parameter estimation problems, there are stability issues associated with those techniques [11]. Fortunately, the inertial sensors can be used to measure the receiver dynamics independently averting the stability problem. In addition to the pedestrian dynamics, satellite signal attenuation due to the human body poses a challenge to reliable carrier phase tracking in a hand-held setup. Therefore betterment of the carrier phase tracking algorithm needs to be addressed in a more complex scenario of pedestrian dynamics combined with signal attenuation. To this end, the characterization results from this paper can be utilized to design an optimal loop filter for pedestrian dynamics as discussed below.
The acceleration measured by the IMU was integrated to obtain the velocity and position. The IF samples were processed using the GSNRxTM software receiver [15] to obtain the tracking results such as Doppler frequency and carrier phase. A standard PLL tracking loop was used for this purpose and the maximum coherent integration period was restricted to 1 ms to avoid over-smoothing the tracking output. The PSDs of doppler and carrier phase obtained from tracking loops were computed and compared with the PSD of position, velocity and acceleration for a satellite at approximately 84° of elevation and are shown in Figure 7. Only vertical axis of the accelerometer data is considered as it is more correlated with the observed frequency changes in a high elevation satellite. 20
10
PSD (dB/Hz)
C/N0 (dB-Hz)
Normal
The key idea behind this work is that the pedestrian dynamics, which was characterised in terms of PSD, should be useful in shaping the tracking loop filter. This is possible only if the measured PSD matches with the stochastic process being tracked, which in the case of PLL is the carrier phase process. In order to analyse this further, the PSDs of pedestrian acceleration, velocity and position are compared with the PSDs of doppler and phase. For the purpose of this comparison a special data collection was required in which both GNSS IF samples and IMU data were needed. The equipment consisted of Novatel 702 GG antenna, LNA, RF front-end, PC to log the IF samples, and a Novatel LCI IMU. The equipment was placed on the pedestrian backpack. The data collection was conducted while the pedestrian was walking on flat terrain, under open-sky conditions. The roof of the CCIT building in the University of Calgary was selected for this data collection.
0
-10 Phase - From Tracking Position - az dt dt
-20
-30 -5
Doppler - From Tracking Velocity - az dt Acceleration
-4
-3
-2
-1 0 1 Frequency (Hz)
2
3
4
5
Figure 7: PSDs - tracking process vs. pedestrian dynamics It is worth mentioning here that the pedestrian dynamics affects GNSS tracking in two major ways: firstly, the well-known user-satellite dynamics induces changes in the Doppler frequency; and, secondly, and less-known is the g-sensitivity of the local oscillator which induces unwanted perturbations in the doppler frequency. The quartz crystal-based local oscillators are mechanical devices that operate on the principle of peizoelectricity (resonance) [13]. Therefore, any mechanical disturbance experienced by the oscillator will induce changes in the frequency output. Fortunately the effect of g-sensitivity induced doppler change can be measured and compensated for by using accelerometer measurements as discussed in [14]. In the analysis performed herein, the g-sensitivity is compensated
ASI-SBN 2013 Conference, Session TS-8, Bengaluru, India (Apr 17-18, 2013)
5/6
using the feed-forward correction technique proposed in [14]. After oscillator g-sensitivity compensation, the remaining signal dynamics to be handled by the tracking loops is almost entirely attributed to satellite-user line-of-sight dynamics. Examining Figure 7, it is evident that both the phase process PSD obtained from tracking loop output and position PSD from the accelerometer vertical axis show good agreement. The following issues were addressed to enable faithful comparison of PSDs: only z-axis data from the accelerometer was considered as the satellite elevation was high. However, in order to fully estimate line-of-sight dynamics the acceleration must be projected to satellite-user line-of-sight, which was deemed unnecessary in this work; the nature of errors prevalent in the tracking loop output and accelerometer sensor measurement are different. The agreement of carrier phase and user position PSDs is encouraging to proceed with the loop filter design to match tracking loop filter PSD to position process PSD. To this end, there are various options available for the design. One of the simple approaches to improve the carrier phase tracking performance is to adaptively change the loop bandwidth to suit the dynamics. It can be done using the dynamics and attenuation results presented in this work. A proportional-integrator (PI) based tracking loop can be designed to match the shape of the phase process PSD against the conventional low-pass filter. A more robust Kalman filter based tracking loop can be used in which the carrier phase process PSD can be exploited to obtain the shaping matrix for stochastic model of the Kalman filter. In addition, the attenuation results from this work can be used to determine spectral density values for the amplitude state of the Kalman filter.
frequency components. The centre frequency and relative power of the resonant components relative to the low-pass component vary with the sensor location. 2. The position PSD directly corresponds to the carrier phase process in the tracking loop. This idea can be utilized to shape tracking loop filters as opposed to the conventional low-pass loop filters. 3. It was demonstrated that the amount of satellite signal attenuation due to the presence of the human body varies with the location of the GNSS antenna relative to the height of the human subject. VIII. [1]
[2] [3] [4]
[5]
[6]
[7]
[8]
It is also interesting to note that the position PSDs obtained in this work can be modelled via low-pass and band-pass components. More specifically, the PSD can be approximated by a single pole low-pass and two poles band-pass process as shown in Figure 8. This signal model provides a pathway to proceed with the loop filter design. 40
[10]
[11]
Modeled Filter Shape From Accelerometers
PSD (dB/Hz)
[9]
20
[12] 0
-20 -5
[13] -4
-3
-2
-1 0 1 Frequency (Hz)
2
3
4
5
[14]
Figure 8: Modelling example of the phase process PSD
VII.
CONCLUSIONS
[15]
REFERENCES
European communities E112, "Commission Recommendation of 25 July 2003 on the processing of caller location information in electronic communication networks for the purpose of location-enhanced emergency call services" , The commission of the European communities. Hofmann-Wellenhof, B., K. Legat and M. Wieser, "Navigation Principles of Positioning and Guidance," 1st Edition, Springer, 2003. Prost, J.B., B. Godefroy and S. Terrenoir, "City Walk - Improving GPS Accuracyfor Urban Pedestrians," GPS World, 19, 2008, pp. 32-37. S. Satyanarayana, “GNSS Channel Characterization and Enhanced Weak Signal Processing”, PhD Thesis, Department of Geomatics Engineering, University of Calgary, Report number 20336, p. 232, pp 187-189, 2011. A. Lakhzouri, E. S. Lohan, I. Saastamoinen, and M. Renfors, "On Second Order Statistics of the Satellite-to-Indoor Channel Based on Field Measurements," in Proceedings of the IEEE 16th International Symposium on Personal, Indoor and Mobile Radio Communications, 2005, pp. 2632-2636. A. Lakhzouri, E. S. Lohan, I. Saastamoinen, and M. Renfors, "Interference and Indoor Channel Propagation Modeling Based on GPS Satellite," in Proceedings of the ION GNSS,2005, pp. 896-901. Lachapelle, G., A. Morrison, and R. Ong, "Ultra-Precise Positioning for Sport Applications", 13th IAIN World Congress, Stockholm, 27-30 October 2009. Bancroft, J. B., V. Renaudin, A. Morrison, and G. Lachapelle, "GNSS Antenna-Human Body Interaction", Proceedings of ION GNSS 2011, Session F6, Portland, OR, 20-23 September 2011. X. Chen, C. G. Parini, B. Collins, Y. Yao, and M. U. Rehman, Antennas for Global Navigation Satellite Systems, John Wiley & Sons, Ltd., West Sussex, United Kingdom, 2012, pp. 149-180. Sokolova, N., D. Borio, and B. Forssell, “Loop Filters with Controllable Doppler Jitter for Standard and High Sensitivity GNSS Receivers”, in Proceedings of the International Conference on Indoor Positioning and Indoor Navigation (IPIN), Portugal 2011. YEI, "YEI 3-Space Sensor Data-logging, Technical Brief, Yost Engineering Inc.” http://www.yeitechnology.com/sites/default/files/TSS_Datalogging_Tec h_Brief_v1.0.4_04Jun2012.pdf, [Accessed: 11 Feb 2013]. D. G. Manolakis, V. K. Ingle, and S. M. Kogon, Statistical and Adaptive Signal Processing: Spectral Estimation, Signal Modeling, Adaptive Filtering, and Array Processing, Artech House Inc., Boston/London, 2005, pp.512-513 W. A. Marrison, “The crystal clock,” National Academy of Sciences Proc., vol. 16, pp. 496–507, July 1930. Bhaskar, S., J. T. Curran, G. Lachapelle (2012) "Effect of Oscillator Quality on Ultra-Tight GPS/INS Aided Carrier Phase Tracking", Proceedings of ION GNSS, session A1, Nashville, (Available at http://plan.geomatics.ucalgary.ca/papers/ion%20gnss12_bhaskar%20etal _sep12.pdf) Petovello, M., C.O’Driscoll, G. Lachapelle, D. Borio and H. Murtaza (2008) Architecture and Benefits of an Advanced GNSS Software Receiver. Journal of Global Positioning Systems, 7, 2, 156-168.
The following conclusions can be derived from the pedestrian dynamics and signal attenuation characterization results presented in this work. 1. The user position PSD pertaining to pedestrian dynamics follows a regular pattern regardless of the location of the sensor on the human body. More specifically, the pedestrian dynamics consists of a low-pass and several resonant
ASI-SBN 2013 Conference, Session TS-8, Bengaluru, India (Apr 17-18, 2013)
6/6