International Journal of Environmental Protection
Feb. 2013, Vol. 3 Iss. 2, PP. 20-26
Assessment of Groundwater Quality in Meerut City, India Haroon Sajjad*1, Syed Mohammad Rashid2, Sandip Prasad3, Rahisuddin4 1,2,3
Department of Geography, Jamia Millia Islamia, New Delhi 110025, India Department of Chemistry, Jamia Millia Islamia, New Delhi 110025, India *1
[email protected];
[email protected];
[email protected];
[email protected] 4
Abstract- The present study assesses the groundwater of selected industrial areas of Meerut, northern India. Thirty hand pump and municipal water samples in 2011 and thirty tube well water samples in 2012 from the different locations of the study area were collected and analyzed according to standard methods. To assess the water quality, water quality index was calculated. The study reveals that most of the sampled areas of the Meerut city are highly contaminated due to excessive concentration of one or more of the water quality parameters such as nitrate, total hardness, calcium, magnesium, total dissolved solids and fluoride and indicated that nearly 53.3 % of the water samples in 2011 and 50% of the water samples in 2012 were non-potable. However, the water quality of tube well water samples is better than the hand pump water samples as 60% tube well water samples had WQI lower than hand pump water samples.
total municipal wastewater generation in the city is about 35 MLD. In most of the places sewage is discharged into six major drains (Abu Nala, Suraj Kund Nala, Odian Road Nala, Clock Tower Nala, Bachcha Park Nala and Kishanpur Nala) without any treatment. These drains discharge both domestic and industrial waste water from densely populated city areas and ultimately join river Kali. Contaminated street water is also drained into river Kali flowing on the eastern side. This situation has led to the degradation of environment and cropping up of severe health hazards in the city [11]. An adequate supply of easily accessible and potable water is central to the household welfare and is a prerequisite to good hygiene and sanitation. In this paper an attempt has been made to analyse physico-chemical characteristics of ground water for the evaluation of the water quality in major industrial clusters of Meerut city.
KeywordsPhysico-Chemical Characteristics; Industrialization; Water Quality; Water Quality Index; Meerut
I.
Realizing the importance of the pollution of ground water in Meerut city, Central Pollution Control Board initiated groundwater quality survey in 2007. The study revealed that the salinity in the city has increased at a faster rate. Iron, nitrate, magnesium and fluoride were found to have concentration above permissible limit and their per cent compliance/violation against drinking water standards of BIS/WHO [12, 13] indicated 30%, 14%, 8% and 4% respectively [11].
INTRODUCTION
The rapid rate of industrialization in India has changed the face of urban landscape and brought in its wake problems of ground water contamination imperilling human beings. Effluents from various industries are dumped into open pits or unlined channels without any treatment which pollute ground water sources [1]. The industrial waste water, sewage, sludge and solid waste are also discharged into the drains. These materials enter aquifers and make drinking water polluted [2, 3].The ground water, the main source of drinking water has become a cocktail of chemicals and human wastes in most of the Indian cities [4]. About 10% of the urban population does not have access to regular safe drinking water while 30% of urban and 90% of rural households depend on unsafe water sources to meet their daily needs [5, 6]. Contaminated water containing virus causes various diseases. It is estimated that nearly 21% of communicable diseases in India are water borne [7]. The present scenario is indicating towards water crisis. The problem of ground water quality is more acute in the areas which are characterized by dense population; heavy industrialization and shallow groundwater table [8]. Hence, there is always a need for and concern over the protection and management of groundwater quality [9].
II.
DETAILS OF THE STUDY AREA
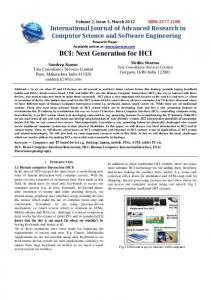
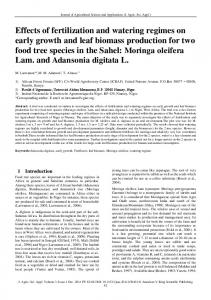
Meerut city (29°41` North latitude and 77°43` East longitude, Fig. 1) was chosen as the study area because it is the second largest urban centre in National Capital Region experiencing rapid urbanization and is the second most important small scale industrial centre in the state of Uttar Pradesh. Density of population is very high in the core areas of the city. The density of population is 4,781 persons/ km2. It has experienced a continuous increase in the population of the city from 0.29 million in 1961 to 1.4 million in 2011 [14, 15] . The population growth registered an increase of 15.92% during the decade 2001-11, which could be attributed to high industrial growth during the same decade [15, 16]. The topography of the city is featureless plain with many small and big drainage canals. Maximum and minimum temperatures remain 440C during summer and 20C during winter. The average rainfall of the city is 714 mm.
Meerut city lacks sewage treatment plant. Everyday about 150 tonnes garbage remains uncollected on the streets and there is no management for the collected solid wastes [10]. The
- 20 -
International Journal of Environmental Protection
Feb. 2013, Vol. 3 Iss. 2, PP. 20-26 deplorable and miserable conditions [19]. There are 102 notified slums in Meerut city. Of these, 51% have access to piped water supply and only 7.0% have partial water supply [20]. Only 30% area is covered through sewerage system. In remaining parts of the city, people are using septic tanks and soak pits. Conventional sewage disposal system is nearly absent in the industrial areas and only some units are disposing sewage through septic tanks and soak pits (Field observation during collection of samples). The major source of drinking water within the Meerut Municipal Corporation limit is tube well. It is estimated that about 46,000 tube wells are privately owned and 500 are owned by the government. Of the 78 wards, 59 are provided with adequate municipal supply and remaining 19 wards lack a systematic supply [21]. Meerut city situated on the banks of river Ganga, once boasted of a large number of irrigation canal but due to increase in population and industrialization the city is witnessing water crisis. The increasing demand for water in the city gave way to tube wells which in turn resulted in fast lowering of the groundwater table. Unlike four decades ago when water came brimming even in a pit just two meters deep, the water table has now fallen down to 20 meters [22]. III.
MATERIALS AND METHODS
Thirty ground water samples from both the hand pumps and municipal water during October 2011 and thirty tube well samples during December 2012 were collected. Sampling locations were selected on the basis of the presence of industrial units. Five wards having concentration of large and small scale industries were selected. From each selected ward six water samples from hand pump and municipal water in 2011 and six water samples from tube wells in 2012 were selected from each selected location. Samples were collected in sterilized plastic/polyethylene bottles during pre-monsoon season. Prior to sampling, all the sampling containers were washed and rinsed thoroughly with the groundwater to be taken for analysis. The samples were analysed for nine physical and chemical parameters using standard methods [23].
Fig.1 Location of sampled sites in Meerut city, India
Meerut district is amongst top 100 districts in India having more than 4500 small scale industrial units. On an actual scale it stands first in Uttar Pradesh and 39 in all India with about 8,244 small scale units [17]. Industry constitutes the second important economic activity of the city. Meerut city has four large industrial areas namely Partapur, Modipuram, Sport Goods Complex and Udyog Puram. Prominent are chemical, petro-chemical, surgical goods, plastic, rubber, leather goods, sugar mills, distillery mills, roller flour mills, straw board mills, transformer industry, spinning mills and auto-tyre factory. Meerut city has around 3,500 unorganized industrial units (not registered with the Directorate of Industries under the Factory Act). These are mainly small home based manufacturing and processing units located within 5 kilometres radius of the residential areas. Among these prominent ones are weaving industries, dyeing industries, sport goods, jewellery, scissors, blade manufacturing, silver ware manufacturing, handloom cloth, leather, spinning mills and musical instruments, etc. These industries are concentrated in old part of the city while large industries have grown in newly developed areas. However, due to absence of any zoning regulation or a comprehensive plan for urban environment, most of the industries in the city were located haphazardly leading to unhealthy living conditions [18].
In order to determine the suitability of groundwater for drinking purposes, Water Quality Index developed by Tiwari and Mishra (1985) was used. It is one of the aggregate indices that have been accepted as a rating that reflects the composite influence on the overall quality of numbers of precise water quality characteristics. Water quality index is one of the most effective tools to communicate information on overall quality status of water to the concerned user community and policy makers [1, 24, 25, 26, 27, 28, 29, 30, and 31] . WQI was calculated by weighted index method. In the present study nine water quality parameters, namely, pH, total dissolved solids, total hardness, Ca hardness, Mg hardness, nitrate, chloride, iron and fluoride were considered for computing WQI and the unit weight Wi of each parameter is obtained depending upon its weightage, by adopting the following formula:
As a result of industrialization, large cluster of migrants entered into the city thereby created demand for residential areas. These migrants occupied vacant government lands and developed squatter settlements. Of the total population of the city, about 30% persons live in slums having
WQI = (∑ qi wi ) / (∑ wi )
- 21 -
International Journal of Environmental Protection
Feb. 2013, Vol. 3 Iss. 2, PP. 20-26
where qi = 100(Vi / Si ) qpH = 100 {( VpH ? 7.0 ) /
( 8.5
(53.3%) were found to be non-potable based on WQI. The main causative constituents for the non-potability of the samples were magnesium (100%) and total dissolved solids (86.6%) followed by calcium (66.6%) and iron (56.6%). Hardness and nitrate each accounted for 23.3% of the nonpotability while fluoride and chloride affected 26.6% and 3.33% samples respectively. Quality assessment based on water quality index through sampling of thirty tube well water samples from the same locations during 2012 shows only 3% reduction in the non-potability of water. Still 50% water samples are non-potable (Tables VII & VIII).
? 7.0 )}
Wi = K / Si qi = Quality rating for the ith water quality parameters (i=1, 2, 3,….N)
Vi = the measured value of the ith parameter at a given sampling location
Si = the standard permissible value for the ith parameter
The results of statistical analysis like minimum, maximum, Mean (SD) values of the water quality parameters and water quality index are given in Table VI. The PH value of the sampled groundwater was between 6.7 and 8.1during 2011 with a mean value of 7.35 and was within the recommended limit. It varies from 5.56 to 8.1with an average of 7.06 in 2012. As per the BIS standards all the samples of both the years fall within the recommended limit for human consumption. The mean value of total hardness was within the desired limit (300mg/L) prescribed by BIS. The hardness was found to be in the range of 53-321mg/L in 2011 and 24-381in 2012. The calcium occurs in water naturally. The calcium content in the sampled groundwater varied between 17.5 and 142.5 in 2011 and between 7.7 and 122 in 2012. The mean value of calcium decreased from 75mg/L in 2011 to 61.1 in 2012.The study area has shown excessive concentrations of magnesium, which have contributed to the non-potability of all the hand pump and municipal water samples. The value of magnesium hardness varied between 71.4 and 342.2 with mean value of 128.5 higher than the recommended limit of 50 in 2011. Its concentration though declined in 2012 but it is still higher than the prescribed limit. The high concentration of magnesium may be due to the industrial effluents from chemical and dyeing industries in the study area. The nitrate content in the study area varied in the range from 5.78 mg/L to 49.7mg/L and affected 23.3% of water samples in 2011. In 2012, the concentration of nitrate was in the range of 1.12 mg/L to 47mg/L and affected 16.7% of the samples. The high values of nitrate in the study area are mainly due to improper disposal of sewage water.
Wi = standard value for the ith parameter K = constant of proportionality The standard permissible values of various parameters for drinking water recommended by WHO and their unit weights are given in Table I. It is well known that more harmful a given pollutant is, the smaller is its permissible value for the standard recommended for drinking water(Jerome, C and Pius, A, 2010). So the “weights” for various water quality parameters are assumed to be inversely proportional to the recommended standards for the corresponding parameters. For the sake of simplicity, assuming that K = 1, for pH, assuming the same unit weight as that for chlorides; viz., 0.005. The unit weight Wi , obtained from the above equation with K = 1, are shown in Table I. TABLE I PERMISSIBLE LEVELS AND UNIT WEIGHT OF VARIOUS PARAMETERS
7.0-8.5 PH 300 Hardness 75 Calcium 50 Magnesium 45 Nitrate 0.3 Iron 200 Chloride 500 TDS 1.0 Fluoride (All units except pH are in mg/l)
0.005 0.0033 0.0133 0.02 0.022 3.333 0.005 0.002 1.0
According to this water quality index, the maximum permissible value is 100. Values greater than 100 indicate pollution and are unfit for human consumption. IV.
The concentration of iron was higher than the recommended limit in all the sampled locations for both the years. The value of iron varied between 0.005 and 0.96 with a mean value of 0.43 in 2011 and 0.003 and 1.65 with mean value of 0.46. It affected 56% samples in 2011 and 46% samples in 2012. The high value of iron content in the sampled water may be attributed to disposal of scrap iron in open areas due to industrial activities. Rusting of casing of pipes is another possible reason of the increased concentration of iron in the ground water.
RESULTS AND DISCUSSION
The results of the physio-chemical analysis of the collected water samples during 2011 and 2012 are presented in Tables II and III. Tables IV and V show the critical parameters exceeding the Bureau of Indian Standard’s permissible limits along with the permissible limits for these parameters. At least one or more parameters such as chlorides, total dissolved solids, calcium, magnesium and fluoride accounted for the nonpotability of samples examined. Out of thirty samples analyzed for physico-chemical parameters during 2011, 16
The chloride concentration serves as an indicator of pollution by sewage. People accustomed to higher chloride in water are subjected to laxative effects. In the present
- 22 -
International Journal of Environmental Protection
Feb. 2013, Vol. 3 Iss. 2, PP. 20-26
analysis, chloride concentration was found in the range of
37 mg/L to
TABLE II WATER QUALITY PARAMETERS IN MEERUT CITY, 2011
S.L
Area
PH
Hardness
Ca
Mg
Nitrate
Iron
Chloride
TDS
Fluoride
1 2. 3. 4. 5.
Sunder Kashi Purvi Feyaz Ali Ismail Nagar Zakir Colony
7.17 7.30 7.12 7.53 7.63
157.6 174.1 248.6 209.8 230.5
54.6 77.8 79.2 89.1 100.2
168 147 110 100 118
18.8 12.6 40.1 15.2 12.3
0.42 0.50 0.50 0.35 0.40
111.5 108.6 109.8 75.7 64.8
649 598 612 613 674
1.38 0.52 0.80 0.70 0.53
(All units except pH are in mg/l) TABLE III WATER QUALITY PARAMETERS IN MEERUT CITY, 2012
S.L
Area
PH
Hardness
Ca
Mg
Nitrate
Iron
Chloride
TDS
Fluoride
1 2. 3. 4. 5.
Sunder Kashi Purvi Feyaz Ali Ismail Nagar Zakir Colony
7.42 6.85 7.10 6.95 7.00
225.8 222.5 123.1 183.8 50.8
89.4 76.7 46.3 69.5 23.4
106 94 108 77.2 146
10.7 18.1 19.4 15.6 12.1
0.57 0.63 0.35 0.42 0.31
53.6 82.6 78.9 105.9 111.5
554 582 478 514 532
0.53 0.68 1.04 0.70 0.53
(All units except pH are in mg/l) TABLE IV CRITICAL WATER QUALITY PARAMETERS EXCEEDING THE PERMISSIBLE LIMITS, 2011
S.N
Parameters
BIS permissible limit
Number of samples exceeding permissible limit
Percentage
1. 2. 3. 4. 5. 6. 7. 8
Hardness Calcium Magnesium Nitrate Iron Chloride TDS Fluoride
300 75 50 45 0.3 200 500 1.0
07 20 30 07 17 01 26 08
23.3 66.6 100.0 23.3 56.6 3.33 86.6 26.6
TABLE V CRITICAL WATER QUALITY PARAMETERS EXCEEDING THE PERMISSIBLE LIMITS, 2012
S.N
Parameters
BIS permissible limit
Number of samples exceeding permissible limit
Percentage
1. 2. 3. 4. 5. 6. 7. 8
Hardness Calcium Magnesium Nitrate Iron Chloride TDS Fluoride
300 75 50 45 0.3 200 500 1.0
06 14 29 05 14 04 20 08
20.0 46.0 96.6 16.7 46.6 13.3 66.6 26.6
TABLE VI COMPARISON OF PHYSICO -CHEMICAL PARAMETERS IN STUDY AREA
2011
2012
Variables
Min-Max
Mean ± S.D
Min-Max
Mean ± S.D
PH Hardness Calcium Magnesium Nitrate Iron Chloride TDS Fluoride Water Quality Index
6.7-8.1 53-321 17.5-142.5 71.4-342.2 5.78-49.7 0.005-0.96 37-201.3 314-942 0.25-2.24 28.1-262.3
7.35 ± 0.35 204 ± 93.7 80.7 ± 37.0 128.5 ± 65.3 19.8 ± 15.7 0.43 ± 0.33 94.1 ± 48.5 629 ± 159 0.79 ± 0.55 130.2 ± 79.3
5.56-8.1 24-381 7.7-122 35.1-268.7 1.21-47 0.003-1.65 27.6-281.3 243-981 0.25-1.83 29.9-451.7
7.06 ± 0.53 161.2 ±116 61.1 ± 38.6 106.4± 42.4 15.1 ± 15.0 0.46 ± 0.38 86.5 ± 65.5 532 ± 181 0.76 ± 0.50 129.8 ± 93.9
(All units except pH are in mg/l)
201 mg/L affecting 3% water samples in 2011. The increased concentration of chloride was found in water samples during 2012 which affected 33% of the water
samples. Higher chloride concentration in sample may be due to discharge of sewage near the sampling site. The total dissolved solids indicate the general nature of
- 23 -
International Journal of Environmental Protection
Feb. 2013, Vol. 3 Iss. 2, PP. 20-26
salinity of water [32]. In water, total dissolved solids are composed mainly of carbonates, bicarbonates, chlorides, phosphates and nitrates of calcium, magnesium, sodium, potassium and manganese, organic matter, salt and other particles. The quality of water and its use is determined by TDS [33]. The total dissolved solids concentration varied from 314 to 942 mg/l and accounted for the non-potability of 86 per cent water samples in 2011. All sampling sites showed greater values than the prescribed limit of 500 Mg/L. In 2012, 66% water samples were affected by the high concentration of Total dissolved solids. High values of TDS may be attributed to the proximity of industrial waste dump sites to these sampling points. Many industrial processes discharge wastes with high TDS. Human activities especially in the industrial areas are also responsible for high concentration of TDS in groundwater [34]. Water containing more than 500 mg/L of TDS is not considered desirable for drinking water supplies.
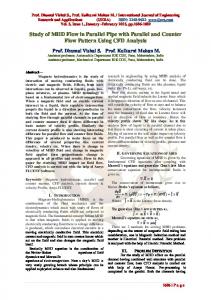
< 100 100-200 > 200
15 08 07
50.0 26.7 23.3
Total Samples
30
100
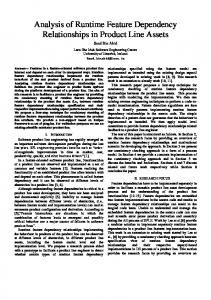
TABLE VII WATER QUALITY INDEX OF HAND PUMP AND MUNICIPAL WATER SAMPLES IN MEERUT CITY, 2011
Water Quality Index < 100 100-200 > 200 Total Samples
Number 14 07 09 30
Percentage 46.7 23.3 30.0 100
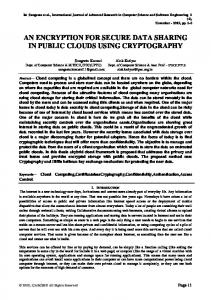
Fig.3: Concentration of water quality index of the samples sites during 2012
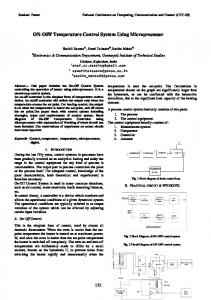
The water quality indices of 66.6% of water samples in 2011 and 83% in 2012 for Sunder location were more than 100 and therefore the quality of water is degrading there. In Sunder, the analyzed water sources at S1 and S2 are in high concentration of TDS, Mg hardness and iron while at S4 and S6, the concentration of fluoride and iron is high in 2011. All the water sources of this sampling site except S4 were having water quality index more than 100 in 2012. The concentration of magnesium, nitrate, iron and total dissolved solids were above the permissible limit. The water quality index of only S4 and S5 tube well water samples was less than the hand pump and municipal water samples. Only S3 and S4 in 2011 and S4 in 2012 showed WQI less than 100. Hence the water is not fit for consumption. In Kashi, 50% water samples in both the years had water quality index more than 100. S1, S2 and S4 showed high water quality index of more than 100 indicating that the water is not suitable for drinking purpose. The concentration of TDS, Ca hardness, Mg hardness and iron in water sample is high at S2 while the value of water quality index at S1 and S4 is high due to exceeding permissible limit of Mg, iron content and total dissolved solids. The water quality index of tube well water samples at S1, S4, S5 and S6 showed lesser
Fig.2: Concentration of water quality index of the samples sites during 2011 TABLE VIII WATER QUALITY INDEX OF TUBE WELL WATER SAMPLES IN MEERUT CITY, 2012
Water Quality Index
Number
Percentage
- 24 -
International Journal of Environmental Protection
Feb. 2013, Vol. 3 Iss. 2, PP. 20-26
values than the hand pumps. Therefore, it can be inferred that the quality of tube well water is comparatively better in Kashi sampling site. In Purvi Feyaz Ali, the high concentration of TDS, Ca hardness, Mg hardness, nitrate at S2; the high concentration of TDS, chloride and Ca hardness at S5 and concentration of Ca and Mg hardness at S6 resulted in high value of water quality index in 2011. During 2012, S2 and S5 samples have more than 200 water quality index in this sampling site. The concentration of hardness, calcium, magnesium, nitrate, iron, chloride and total dissolved solids were found to have the exceeding permissible limits. The water quality index values of all the tube well samples except S1 were lower than the hand pump samples.
ACKNOWLEDGEMENT
The authors gratefully thank the anonymous reviewers for their valuable comments and suggestions to improve the overall quality of the manuscript. REFERENCES
[1]
The value of water quality index in Ismail Nagar in 2011 at location S4 was due to high concentration of TDS, Ca hardness, Mg hardness and iron; at location S5, the value was found high due to Ca hardness, Mg hardness and iron while at location S6, the water quality is high due to exceeding limits of TDS, nitrate and Mg hardness. The water quality index during 2012 varied between 44 and 245. Three water samples in this sampling site were having the water quality more than 100. The high values of water quality index at S4 and S6 was found due to high concentration of magnesium, iron and total dissolved solids while at S5, the value of WQI was high due to magnesium, calcium, hardness, iron, chloride and total dissolved solids. Only two tube well water samples of S4 and S5 showed lesser values of WQI. Therefore the quality of municipal water is comparatively better in Ismail Nagar.
[2]
[3]
[4]
[5]
[6] [7]
The high value of water quality index in Zakir Colony in 2011 was found at location S4, S5 and S6. The values at locations S4 and S5 were high due to high concentration of TDS, Ca hardness, Mg hardness and iron. The value of water quality index at location S6 was mainly due to high value of TDS, Ca hardness and iron. In 2012, only S5 showed index more than 200 and was having high concentration of magnesium and total dissolved solids. All the tube well water samples except S3 had WQI lower than the hand pump water samples. Thus, the water quality of tube well water is better than the hand pump water samples in Zakir Colony sampling site. V.
quality in the study area. Rainwater harvesting could be encouraged to augment and recharge for increasing need of potable water of rapidly growing population. Our cities must draw up a model of sustainable growth. This requires finding ways of ‘leap-frogging’ so that we can have progress without pollution and inequity.
[8]
[9]
[10] [11]
CONCLUSION
The water quality index was evaluated to assess the quality of ground water. WQI values for 53% of the hand pumps and municipal water samples in 2011 and 50% of tube well water samples in 2012 were more than 100 and hence water is not suitable for drinking purpose. The findings also revealed that the water quality of tube well samples is better than the hand pump water samples. Therefore, it is essential to initiate measures to bring the water quality index below 100 so as to make the water potable. A comprehensive sewerage system for safe disposal of wastes should be developed to safeguard groundwater
[12] [13] [14] [15]
- 25 -
Jinwal A and Dixit S (2008) Pre and post monsoon Variation in physio-chemical characteristic in groundwater quality in Bhopal, India. Asian J. Exp. Sci. 22 (3), 311- 316. Jerome, C & Anitha Pius. (2010). Evaluation of Water Quality and its Impact on the Quality of Life in an Industrial Area in Bangalore, South India, Am.J.Sci.Ind.Res, (3):595603. Forstner, U. K. & Wittman, G. T. W. (1981)l Metal pollution in the aquatic environment, Springer Verlag, Berlin, Heidelberg, 255 pp. Raja, R. E, Lydia Sharmila, Princy, Merlin, Chritopher, G.(2002). Physico-Chemical Analysis of Some Groundwater Samples of Kotputli Town Jaipur, Rajasthan, Indian J Environ Prot., 22(2), 137., memo. Sajjad, H. (2006). Water Crises in India: Avenues for an Integrated Planning and Management, The Geographical Observer, Vol. 36. Kumar Rakesh, Singh, R.D & K.D. Sharma, (2005). "Water resources of India". Current Science, Vol.89, No.5, 794-811. Brandon,C and Homman, K., (1995). The cost of inaction: Valuing the economy wide cost of environmental degradation in India. Asia Environmental Division, World Bank7, October. Patil, V.T & Patil, V.R (2010). Physicochemical Analysis of Selected Groundwater Samples of Amalner Town in Jalgaon District, Maharashtra, India, E-Journal of Chemistry, 7(1), 111-116. Patil, P. R, Badgujar, S. R. & Warke, A M. (2001). Evaluation of Ground Water Quality in Ganesh Colony Area of Jalgaon City. Oriental J Chem., 17 (2), 283. Meerut Development Authority. (2011). Government of Uttar Pradesh, Meerut, India. Central Pollution Control Board (2007), Status of Groundwater Quality in India, Part I, Central Pollution Control Board, Ground, Groundwater Quality Series: GWQS/09/2006-2007, Ministry of Environment and Forests, New Delhi. BIS, (1991), Specification for drinking water, IS: 10500:1991, Bureau of Indian Standards, New Delhi. WHO, (1996), Guidelines for drinking water, Vol. 2, Recommendations, World Health Organization, Geneva. Census of India (1961), Office of Registrar General and Census Commissioner, New Delhi, India. Census of India (2011), Office of Registrar General and Census Commissioner, New Delhi, India.
International Journal of Environmental Protection
Feb. 2013, Vol. 3 Iss. 2, PP. 20-26
[16] Census of India (2001), Office of Registrar General and Census Commissioner, New Delhi, India. [17] National Informatics Centre (2001), Ministry of Communication and Information Technology, Government of India, Meerut District Unit. [18] Meerut Development Authority, (2012). Government of Uttar Pradesh, Meerut, India. [19] Sajjad, H, Singh, A.L and Kumar, H (2008). Socio-economic and Health Conditions of Slum Dwellers in Meerut city, Uttar Pradesh, National Geographical Journal of India , Vol. 54, Part (3-4). [20] District Urban Development Agency (2012), Meerut, Uttar Pradesh, India. [21] Municipal Corporation (2012), Government of Uttar Pradesh, Meerut, India. [22] Raj, S (2011), Rain Water Harvesting Potential of Pallavapuram Area of Meerut: A GIS Study Proceedings of 12th Esri India User Conference, 8-11, 2011. [23] APHA: (2005). Standard methods for the examination of water and waste water, 21st Edn, American Public Health Association, Washington. [24] Subba Rao, N. (1997). Studies on the water quality index in hard rock terrain of Guntur district, Andhra Pradesh, India. National Seminar on Hydrology of Precambrian Terrains and hard rock areas, pp 129-134. [25] Tiwari, T.N & Mishra, M.A. (1985). A preliminary assignment of water quality index of major Indian rivers. Indian J Environ Proc, 5:276-279. [26] Krishna D, Reddy P.O, Reddy R.C, Rama Rao K.G, Rao P.M. (1991).Water quality assessment through statistical models a case study. Asian Environ. 13(3), 60-69.
- 26 -
[27] Pathak, J.K and Bhatt, S.D (1991) Water quality characteristics of the lesser Himalayan Stream: XII, trends and arithmetic water quality indices with special reference to river Sarju. Ecol. Mountain Water, APH, New Delhi, pp: 92103. [28] Dhamija S.K, Jain Y (1995). Studies on the water quality index of Alentic water body at Jabalpur MP. Poll. Res., 14(3), pp: 141. [29] Singha, S.K. (1995), Probability of rural ponds water at Muzaffarpur (Bihar) a note on water quality index. Poll Res., 1995, 14(1), 135-140. [30] Singh, D.F (1992). Studies on the water quality index of some major river of Pune, Maharashtra, Proc. Acad. Environ. Biol. 1(1), 61-66. [31] Saxena, N and Kaur, H (2003), Evaluation of ground water quality of Bareilly city. J. Ind. Pollut. 19(2), 169-174. [32] Ranjit, S.A.J., & Ajit, K., T.T (2004). Water quality analysis of drinking water resources in selected villages in Tirunelveli district. Indian journal of Environmental Protection, 24, 4852. [33] Nordstrom, P.L. (1987). Groundwater resources of Antlers and Travis peak formations in the outcrop area of North Central Texas area. Texas water Development Board, Report 29, pp-280. [34] Byoung-Young Choi, Seong-Taek Yu, Soon-Young Yu, Pyeong-Koo Lee, Seong-Sook Park, Gi-Tak Chae & Bernhard Mayer (2005). Hydrochemistry of urban groundwater in Seoul, South Korea: effects of land use and pollutant recharge. Environ. Geol., 48, 979-99.