Maintenance Maturity Assessment: a Method and First Empirical Results in Manufacturing Industry Marco Macchi, Luca Fumagalli*, Paolo Rosa, Klodian Farruku, Matteo Gasparetti Department of Management, Economics and Industrial Engineering, Politecnico di Milano, P.zza Leonardo Da Vinci 32, 20133 Milano, Italy
[email protected];
* = corresponding author ABSTRACT — The purpose of this paper is to propose a maturity assessment method developed in order to measure the state of maintenance practices in a company. The method is based on the assessment of the capabilities of a maintenance department as to managerial, organizational and technological issues. By using this method, it is possible to classify companies into five maturity levels and to analyse the level reached by a company for the main features and critical points of operations. Eventually, a company can make a benchmark with best companies at a given maturity level. The method has been used in a test sample of thirty-two companies in the Northern Italy. Keywords— Maintenance Maturity, Maintenance Best Practices, Maintenance Policies.
I. INTRODUCTION
The method for maintenance maturity assessment, proposed in this paper, has the primary purpose to analyse how maintenance practices are currently set-up in a given company and, in particular, how much new practices have been developed thanks to the advancement in the use of ICT tools/devices for diagnostics, prognostics, maintenance engineering. The method is developed starting from the results achieved in some previous works. Its concept was firstly presented in [1] and further discussed in [2]; afterwards, a set of empirical tests was performed by assessing the maintenance practices in plants in the process production sector [3], in companies operating as maintenance service providers in the telecommunication networks [4] and in the case of Original Equipment Manufacturers extending their products with some maintenance services [5]. In these contexts the maturity assessment method was used as a tool for a case study analysis and achieved positive feedbacks for what concern its potentials to assess the maturity of maintenance processes. This paper aims at extending the use of the method by proposing it as an integral part of a survey analysis. The survey is currently run in the context of the
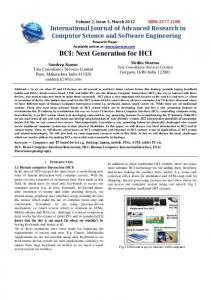
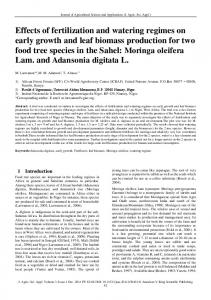
Observatory on “Technologies and Services for Maintenance” of the School of Management of Politecnico di Milano (shortly speaking TeSeM [6]). The Observatory is a research structure, which integrates in a collaboration platform other Italian universities (at the moment, Politecnico di Bari, Università degli Studi di Bergamo, Università degli Studi di Bologna, Università degli Studi di Firenze) with the purpose to monitor the state of the art of the maintenance choices within small, medium and large companies located in different regions of Italy, in the field of industrial plants, infrastructures and services. A primary purpose of TeSeM is to observe the innovations in technologies and services for maintenance: to this end, a research on annual basis is carried on, through case studies and industrial surveys involving both demand-side firms (as plant operators and asset owners) and supply-side firms (as suppliers of technologies and services). This paper provides a focus on intermediate outcomes of the 2011 research, whose objective is to observe the state of the art of maintenance policies, in different industrial sectors and company sizes. Next figure 1 shows the conceptual model of the research: herein the “maturity” is considered as a determinant of the development of maintenance policies in a company. Focusing only on the “maturity” box, the paper presents the maturity assessment method by means of its background (par. 2), its theoretical model (par. 3) and its use in a test sample of manufacturing firms in the Northern Italy (par. 4). Eventually, next research steps are discussed in the concluding remarks (par. 5).
“SPONSORSHIP” IN THE COMPANY QUALITY PERCEIVED FROM MAINTENANCE ACTIVITIES
Determines
Determines
DEVELOPMENT OF MAINTENANCE POLICIES
COMPANY’S CONTEXT •Company’s size •Company’s sector
MATURITY OF MAINTENANCE MANAGEMENT
Determines
•Distribution of policies •Type of resources employed
Determines
Determines
ECONOMIC RESULTS OF MAINTENANCE ACTIVITIES
Fig. 1 Conceptual model of the 2011 research
II. LITERATURE BACKGROUND A. Overview and comparison of methods
Defining a maturity ranking in maintenance is a recent, well known, but still open problem. Indeed, the maturity is a concept that has been introduced to assess different maintenance management issues for evaluating their quality, usually in a qualitative or a semi quantitative way. Moreover, maturity does not necessarily lead to an holistic indicator: instead, it could be developed for analysing specific aims or well identified maintenance process areas, to obtain different maturity indexes for assessing such aims or areas [1], [5]. Because of the various choices that can be decided when designing such an assessment method, it is worth considering the suggestions that can be sourced from literature, from methods not necessarily designed for analysing maintenance management. Hence, the main existing methods are firstly presented, one of these methods is selected as reference background to help designing the method proposed in this paper. Reference [7] presents a Corrective Maintenance Maturity Model. The model “specifies what a problem management process should look like” and “structures each process into three maturity levels (Initial, Defined, Optimal)”. The proposal of this author is the result of an empirical study carried on in industries adopting corrective maintenance of software products. Another method from software engineering field is the CMMI (Capability Maturity Model Integration). This has been developed by the Software Engineering Institute at Carnegie Mellon University [8] and it is one of the most mentioned model to build a maturity assessment system. It is
derived from the Capability Maturity Model (CMM) presented by [9]. CMM distinguishes process areas, where each area consists of a homogeneous set of key practices for software engineering. Then, CMM bases on the idea that the improvement is made by little steps, rather than by revolutionary changes, by focusing on some process areas and the adoption of key practices therein. This method achieved a great success and, in some cases, its implementation gave great benefits (e.g., companies implementing the CMM method gained 35 % productivity increase and 39 % post-delivery defect reduction, on average). The CMMI method is a revised release, completed at the beginning of 2000ies, in order to cover a range of activities related both to software development and engineering. Since then, CMM(I)based models can also be found in the areas of project management, design, reliability, project reviews and supply chain management. Related to the topic of this paper, it is worth mentioning the maturity model proposed by [10] to establish a roadmap for Reliability Centred Maintenance (RCM). The roadmap is based on the CMM method: a stage of the RCM implementation roadmap is presented with a list of key practices, representing activities that, when performed, lead to a set of goals in a specific process area; being the goals associated to maturity levels, when a group of goals is reached, the correspondent maturity level is reached in that specific process area. The PACE (i.e. pressures, actions, capabilities, enablers) framework is another model proposed by [11], and it is based on a scheme different from previous proposals (i.e. not CMM(I)-based). Indeed, a pressure on a firm (e.g. to maximize the availability) needs actions (as preventive maintenance programs) which can be implemented thanks to capabilities (as the real time monitoring) and enablers (as the CMMS for data storage). According to this framework, a firm can compare its responses to pressures with those provided by “Best in class” companies, to make a benchmark. The understating idea is that, according to a maturity level and to pressures it is subjected to, a firm may focus on specific objectives to improve its business; a firm can then have recommendations on the next steps needed to improve its maintenance performances. The last method, worth mentioning, is presented by [12]. Their proposal is based on a
maintenance maturity grid, built on two variables. The variable named as “good maintenance practices employment” considers a list of factors, to represent areas which to work on, to achieve a successful maintenance management (examples of factors are information management, spare parts management and human resource management). Therefore, a series of good practices are indicated for each factor (e.g., in reference to spare parts management factor, the adoption of the Pareto diagrams to control stock and the record of cost of spare parts are the good practices that can be employed). On the basis of this list of factors, each firm achieves a percentage of employed practices, with respect to the whole listed; the so obtained measure relies on the horizontal axis of the maturity grid. The second variable is the “benefits gained from maintenance”, measuring the effectiveness of maintenance management. Indeed, a student-t test of significance is performed in order to identify those factors that actually influence the effectiveness of a maintenance management system; in this way, the factors considered as significantly related to the maintenance effectiveness are defined, and, by measuring them, a value, for each firm, of effectiveness gained in maintenance management is obtained; the so obtained measure relies on the vertical axis of the grid. We preferred the CMMI as a base ground for our maintenance maturity assessment method because it is a consolidated model (since its later integration in 2001) and proved itself attractive in several fields of application (software development, maintenance management, project management, supply chain management, etc ...), thus showing its flexibility to integrate different process areas under the “lens” of maturity assessment. On the other hand, the PACE framework is quite promising but it requires better understanding of the pressure concept to distinguish different levels of pressure a firm can be subject to. This is quite a complicated matter and may require specific research work. Since pressure is a different concept, that can be reasonably treated separately from maturity, we have preferred to postpone to future works both the creation of pressure rankings in different sectors and the study of relationships between pressure and maturity rankings. Eventually, reference [12] is proposing a promising approach.
Nonetheless, these authors are discussing two related but separated issues, i.e. the best practices (which, in our concern, are strictly associated to the maturity concept) and the results achieved (which, in our concern, are an outcome of adoption of best practices, see also the conceptual model of fig. 1, figuring out that “maturity” is considered to be a determinant of maintenance policies, which are, in the meanwhile, determinants of the economic and quality results of the maintenance activities). The CMMI is better analysed in next sub-section, since it is the reference method for developing our maturity assessment method. B. An introduction to the CMMI approach
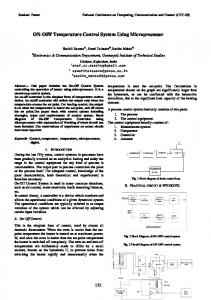
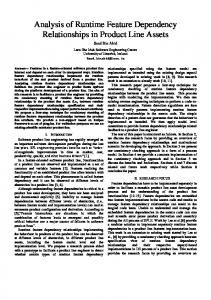
CMMI approach provides two representations as alternative: the Staged Representation (SR) and the Continuous Representation (CR). SR considers 5 Maturity Levels (MLs), related to the whole activity that must be evaluated. For each of them, a few Process Areas (PAs) are defined, that have to be improved to reach the specific ML. Hence, if a generic firm is at level 3 of maturity, it has to improve a set of predefined PAs to reach level 4. This means that this CMMI representation provides a predefined roadmap for improvement, in which every stage / ML contains a set of PAs indicating where to focus in order to make company work better. CR defines 6 Capability Levels (CLs), instead of MLs; a CL represents a measure assigned to a lone PA; in this way, maximum flexibility for firms to choose which processes to point at is provided. The adjective “continuous” means that there are no stages in which to focus on different goals, and procedures to follow are organized to support the development of every single PA. In this CR, unlike in staged one, goals are not specifically defined. Herein, every PA has a different capability level, and the whole of them make up a so-called Capability Profile. Figure 2 summarises the two representations, as taken from the CMMI original proposal.
1). This is used to assess the current practices run in the PA under concern in the assessment: if the PA adopts either good or best practices, an high ML is associated to the PA; the highest ML is assigned if the practices used in the PA are run accordingly to a continuous process improvement-like approach; the lowest ML is assigned when the practices are either weakly available or not performed at all. TABLE 1 THE SCORECARD DEFINING THE SCALE OF MATURITY LEVELS
Fig. 2 Capability profile in CR versus Maturity levels in SR
Maturity Level
Synthetically speaking, CR offers the maximum flexibility for prioritizing process improvements and aligning them with the business objectives, while in SR a predefined path must be followed. SR is then more rigid, because it hypothesizes that, to grow up, a firm has “one best way” to travel along: once reached a predefined series of goals, then the firm is able to step up to the upper level.
ML 5
Since we suppose that there is not a pre-defined roadmap in maintenance management (considering also the possibility to have different good practices in different company’s sectors and sizes), the CR is preferable because of its road-mapping flexibility.
Defined
Fixing “one best way” to process improvement in maintenance management is then avoided by using CR. Besides, choosing CR has the advantage to enable, in the maturity assessment, more visibility to the analysis of single PAs. Hence, the assessment of less upfront investments is going to be possible, since stepping up the maturity can be analysed by referring to each single PA, rather than a set of PAs involved in a maturity level.
ML 1
Optimizing ML 4 Quantitatively Managed
ML 3
ML 2 Managed
Initial
Description Process is managed by ensuring the continuous improvement; causes of defects and problems in the processes are identified, taking actions in order to prevent problems from occurring in the future. Process performance is measured, and causes of special variations are detected; quantitative analyses are conducted, indeed a good balance is reached between the quantitative and qualitative analysis; process management is fulfilled thanks to organizational responsibilities and fully functional technical systems. The process is planned; semi-quantitative analyses are done periodically to define good practices/management procedures; process management depends on some specific constraints for the organizational responsibility or the technical systems. The process is partially planned; performance analysis is mostly dependent on individual practitioners’ experience and competences; process management is weak because of deficiencies in the organizational or in the technical systems. The process is weakly controlled, or not controlled at all.
A “modified” continuous representation is then proposed, offering the scorecard as a schema for assigning MLs for well defined PAs in maintenance. Differently from the original CMMI terminology, we prefer to adopt the term “maturity level” instead of “capability level” for a single PA, even if the concept still stands: we want to create a (maturity) The application of the CMMI theory, in CR mode, profile for each relevant PA. The relevant PAs have to the Observatory’s survey analysis is presented in been defined in relationship with the objective of the remainder. the TeSeM’s annual research. III. THEORETICAL MODEL A. The maturity levels associated to the process areas
What is used for the survey run in TeSeM is the idea that a maturity level (ML) can be associated to a given process area (PA), according on how the processes included in the area are either managed or executed. To this end, a scorecard is proposed (tab.
B. The managerial, organisational and technological issues
The maintenance maturity is not considered as a holistic indicator, but it is evaluated through three maturity indexes according to the original concept of [1]. The understating idea is that, based on the key practices, PAs can be aggregated under three issues – managerial, organisational and technological –,
therefore also aggregated profiles for the respective maturity levels can be provided. As a final outcome, the maintenance maturity is assessed both as a synthetic index (in the remainder GMI, measuring the general maturity level) and a set of component indexes accordingly with the issues identified so far (MMI, OMI and TMI, measuring the maturity level reached for each issue). •
•
•
•
questionnaire. In other terms, each set of questions enable to focus on the key practices actually run in different PAs, pertaining to a selected issue. Once the questionnaire is filled in, answers can be translated into scores. At this point, the output of the interview, carried on through the survey, is a set of scores related to the PAs. In order to have a unique score referable to a given issue, the specific maturity index is calculated (i.e. TMI, OMI, MMI) as average of the scores reached by the PAs pertaining to the issue under concern. At the end, all the specific maturity indexes (i.e. TMI, OMI, MMI) are synthesized into the general Maturity Index (GMI) by means of a multiplicative model (GMI = MMI x OMI x TMI). The use of this formula was considered to fit better with the need to reward the firms implementing the concurrent improvement of all the maintenance issues.
Management Maturity Index (MMI) assesses all the PAs concerned with the planning and control cycle (i.e. ranging from registration of the maintenance work orders to maintenance planning and budgeting). • Organizational Maturity Index (OMI) refers to all those PAs concerned with knowledge management and improvement of internal and external relationships (within the maintenance internal structure and with parties external to the maintenance department, i.e. with other enterprise functions or third parties). Technological Maturity index (TMI) takes Next tab. 2 provides a summary with the number into account all the PAs related to the support of information systems, ICT tools, diagnostic of questions included in the questionnaire and the / prognostic tools, maintenance engineering PAs under analysis for each issue. tools; the main concern is to assess how tools TABLE 2 MATURITY INDEXES, PROCESS AREAS AND QUESTIONS INCLUDED IN THE SURVEY QUESTIONNAIRE / devices are being adopted in the company’s Index Process areas (PAs) Questions practice.
Each index – GMI, MMI, OMI or TMI – results then in a ML accordingly with the scorecard (tab. 1). In particular, the MLs of the scorecard are used at first to assign the score to each PA; then, the set of scores obtained by a company in the different PAs constitute a maturity profile, similarly to CMMI CR, and can be used to calculate the maturity indexes. Operatively, at this purpose, for each defined PA, there may be more than one related questions in the survey questionnaire. For every question, its related scores are defined according to the scorecard, thus, based on the answers to the questionnaire, obtained by interviewing the maintenance manager of a firm, it is possible to calculate all the maturity indexes. The calculation method is synthesized as follows. • Each issue – managerial, organisational and technological – is investigated by means of a set of questions included in the survey
TMI
OMI
MMI
Monitoring, diagnostics and prognostics system Computerized maintenance management system Reliability and maintenance engineering system Relationships with other enterprise functions Outsourcing (i.e. relationships with third parties) Empowerment of maintenance personnel Maintenance engineering structure Maintenance planning and budgeting Information sharing with third parties Registration of maintenance work orders
25
10
9
C. An example of maintenance maturity assessment
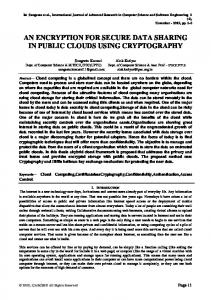
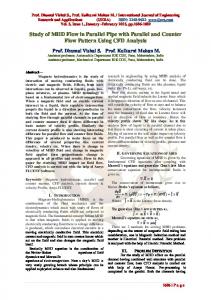
Next fig. 3 shows an example of outcome of the maintenance maturity assessment of a company. The chart provides both the GMI and its component indexes, TMI, OMI and MMI: this enables to obtain an overview of weak and strong points in terms of maturities actually achieved by the company. In the example, the company is not much mature (i.e. ML 2 is the general maturity level achieved by the company, see the scorecard of tab. 1 for details on its description) and the technological issue is the
less mature issue (i.e. equivalent to say that it is the and prognostics system”) achieves an higher level, weakest issue in maintenance operations). even if always limited to a low maturity. These low values motivate the low ML achieved for the TMI: 5 the company generally shows weaknesses in all the 4,5 PAs related to technological issues, especially the 4 “Reliability and Maintenance Engineering System”. 3,5 3
IV. USE IN THE MANUFACTURING INDUSTRY
2,5 2 1,5 1 0,5 0 Technological maturity level
Organizational maturity level
Managerial maturity level
General maturity level
Fig. 3 Maturity profile based on the maturity indexes
This section provides a brief account of the first results of the survey, considering a test sample of thirty-two companies. A short description of the sample is firstly presented, to provide a snapshot of companies respondents of the survey (par. A): the description is neither complete nor supported by descriptive statistics because the aim is to provide the reader just with a general flavor of the state of practices in the sample under investigation, before proceeding with their measurement through the assessment method proposed in this paper. This is done in the next sub section (par. B) and enables to have a more detailed analysis of the state of practices according to the standard defined by our maturity assessment method.
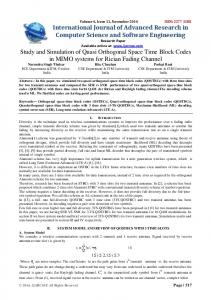
An in-depth analysis can be also done by breaking down the maturity indexes in a maturity profile of selected PAs. These can be chosen considering each issue, e.g. by identifying the PAs pertaining to the technological issue. Doing so, the maturity profile results in a bundle of values that helps identifying main features and critical points (i.e. the strongest and weakest process areas) for a given issue. Next fig. 4 provides an example of a A. The main features of the sample The sample of companies interviewed through maturity profile for selected PAs under the the survey is on the majority composed of medium technological issue. and large companies coming from the chemical / pharmaceutical, automotive and mechanical sectors, with a number of maintenance workers between 1 5 and 20. The maintenance budget is between zero 4,5 and one million euros and is generally determined 4 3,5 by organizational units to which the maintenance 3 unit refers to or is directly defined by the top 2,5 management. 2 1,5 1 0,5 0 Computerized maintenance management system
Reliability and Monitoring, maitenance diagnostics and engineering system prognostics system
Fig. 4 Maturity profile of process areas under the technological issue
In the example shown, the company provides the following bundle of values: the lowest level is for “Reliability and Maintenance Engineering System”, other PAs (that is the “Computerised Maintenance Management System” and “Monitoring, diagnostics
Most of the companies analyzed in the survey does not present a business unit with maintenance engineering responsibilities; RCM methodology is not generally known (or not used). Considering maintenance information systems, supporting the maintenance management, there is a general lack of complex systems, such as CMMS, replaced by simpler tools, such as spreadsheets and local databases. For companies using a CMMS, the maintenance plan is not updated or is updated only after the occurrence of important events (such as e.g. revamping); analysts are, in general, not involved in
a detailed analysis of data collected through the each level: when at least 60 % of the companies, in CMMS, correspondingly no specialized software is the sample of companies at the given maturity level (i.e. general maturity), achieves a lower maturity used for failure data analysis. level for the PA (than the one reached as general Last but not least, keeping a perspective on the maturity), the PA is identified as a critical one. The maintenance policies, the preventive maintenance is example shown in tab. 3 identifies the critical PAs mainly defined basing on the operators’ experience for the companies pertaining to the sample at a or the suppliers’ recommendations; the Condition general maturity level equal to ML 3: all the critical Based Maintenance is mainly operated through the PAs achieve a maturity level equal to ML2. inspections as primary asset evaluation method. TABLE 3 CRITICALITY ANALYSIS FOR COMPANIES AT ML3 B. The maturity assessment method applied to the sample
The maturity indexes reached by the companies interviewed in the sample can now be analyzed with more details.
Index
Process areas (PAs) Monitoring, diagnostics and prognostics system Computerized maintenance management system Reliability and maintenance engineering system Relationships with other enterprise functions Outsourcing (i.e. relationships with third parties) Empowerment of maintenance personnel Maintenance engineering structure Maintenance planning and budgeting Information sharing with third parties Registration of maintenance work orders
TMI
OMI
A first analysis concerns the sample distribution: a box plot (fig. 5) is used to make an analysis of the distribution of the general maturity level GMI and its component indexes OMI, TMI, MMI.
ML 2
ML 3
ML 4
ML 5
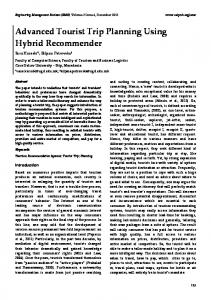
Last but not least, the best level companies can be detected at a given maturity level. To this concern, the best level companies have been defined as those companies at a general maturity level that feature a ML for a specific issue – managerial, organizational or technological – higher than the general maturity level itself. Once they are identified, the best level companies can be also characterized in terms of company’s size or sector (fig. 6).
ML 1
MATURITY LEVELS
MMI
Criticality Critical Non Critical Critical Non Critical Non Critical Non Critical Critical Non Critical Critical Non Critical
General maturity level
Technological maturity level
Organizational maturity level
Managerial maturity level
ML 3
Fig. 5 Box plot of companies’ maturity profiles
As can be seen from the box plots, the companies in the sample have a general maturity level between ML2 and ML3 (i.e. on average). This is due in great part to the low level of practices in technologies and managerial aspects (i.e. low values of the TMI and MMI). The organizational maturity (i.e. the OMI), instead, is generally better and reaches, on average, ML3; nonetheless, the sample is quite dispersed and companies may show also very low maturities also in the organizational issues. A criticality analysis can be carried out to provide more in-depth on the sample and, more precisely, to identify the weakest points of companies present in the sample. To this concern, we made an analysis at each maturity level (i.e. general maturity level). We also established a rule to fix when a PA is critical at
Chart Level (% share)
Best Level (sector)
Best level (size)
TML
(technological)
34% 22% 11% 11% 11% 11%
OML
(organizational)
Other metal products Chemical / Pharmaceutical Food & drinks Electronics Machineries & equipments Automotive
78% Large Enterprise 22% SMEs
MML
(managerial)
lML1
lML2
lML3
lML4
lML5
Fig. 6 Maturity assessment of best level companies (at ML3)
In the example, considering companies reaching ML3 as general maturity level, it is possible to see that the best level companies are dominated by large companies in the organizational maturity level (reaching a value of ML4); from the point of view
of industrial sectors, the results are quite dispersed after that, indicators measuring the economic results of maintenance activities (e.g., annual maintenance in different sectors. budget / volume of sales, ...). The last relationship V. CONCLUSIONS will concern maturity and quality of maintenance This paper proposed a method to assess the state activities: to this end, a self-audit will be achieved of maintenance practices in a company. The method directly by the maintenance manager, judging the is being used as a tool to support a survey on the maintenance quality through levels of satisfaction state of maintenance policies and practices within reached for what concern tangible and intangible Italian companies. The survey questionnaire was benefits. Relating the maturity level of a company developed by the TeSeM Observatory of the School with the development of maintenance policies and of Management of Politecnico di Milano and is now the level of satisfaction of the maintenance manager being distributed to the Italian industry, in different will eventually help figuring out how the perception regions thanks to the collaboration with Politecnico of (quality in) maintenance management is aligned di Bari, Università degli Studi di Bergamo, Bologna with the maturity level of the maintenance practices and Firenze. The planned target is the fulfillment of in a company. 150 questionnaires at the end of 2011. REFERENCES
The results shown in this paper are taken from a first sample of companies, coming from the survey, and can be considered as an intermediate outcome of the 2011 research. This was discussed during a TeSeM workshop attended by invited managers of 16 companies, divided in 12 demand-side firms (as plant operators and asset owners) and 4 supply-side firms (as suppliers of technologies and services). During the event, managers were firstly informed of the results achieved in the sample, having a closer look to the state of maintenance practices of the respondents; afterwards, the maintenance maturity assessment method was presented and the maturity assessment results were commented; in the last part of the workshop, an open discussion was held thus allowing to obtain the first feedbacks. Feedbacks enabled a positive validation of the method, as for credibility of the results.
[1]
[2]
[3]
[4]
[5]
[6] [7]
In next steps, the method is going to be further adopted during the 2011 research, in order to fulfill the objectives envisioned in its conceptual model (fig. 1): that is, to demonstrate that the maintenance maturity is a determinant of the development of maintenance policies and of economic and quality results of maintenance activities. Correspondingly, in next activities, the maturity assessment method will be related, at first, to typical leading indicators measuring the development of maintenance policies (e.g. man-hours for condition based maintenance work orders / total man-hours available, ...) and,
[8]
[9]
[10]
[11] [12]
M. Garetti, M. Macchi, S. Terzi, and L. Fumagalli, “Investigating the organizational business models of maintenance when adopting self diagnosing and self healing ICT systems in multi site contexts”, in Proc. of the IFAC CEA (Conference on Cost Effective Automation in Networked Product Development and Manufacturing) 2007, Monterrey, Mexico. D. Elefante, L. Fumagalli, M. Garetti. and E. Levrat, “A Road-map to the Implementation of Advanced ICTs in Maintenance Organization”, in Proc. 9th IFAC Workshop on IMS (Intelligent Manufacturing Systems), 2008, Szczecin, Poland. L. Fumagalli, D. Elefante, M. Macchi, and B. Iung, “Evaluating the role of maintenance maturity in the adoption of new ICT in the process industry”, in Proc. 9th IFAC Workshop on IMS (Intelligent Manufacturing Systems), 2008, Szczecin, Poland. J. F. Gomez Fernandez, L. Fumagalli, M. Macchi, and A. Crespo Marquez, “A scorecard approach to investigate the IT in the Maintenance Business Models”, in Proc. of the Annual 10th International Conference on The Modern Information Technology in the Innovation Processes of the Industrial Enterprises, 2008, Prague, Czech Republic. M. Macchi, L. Fumagalli, S.Pizzolante, A. Crespo Marquez, and J. F. Gomez Fernandez, “Towards e-Maintenance: maturity assessment of maintenance services for new ICT introduction.” In Proc. of the APMS 2010 conference, 2010, Como, Italy. (2011) The Osservatorio “Technologie e Servizi per la Manutenzione” website. [Online]. Available: http://www.tesem.net/ M. Kajko-Mattsson, “Problem management maturity within corrective maintenance”, Journal of Software Maintenance and Evolution: Research and Practice, vol. 14, no. 3, pp. 197–227, 2002. CMMI Product Team, “Capability Maturity Model Integration (CMMI), Version 1.1”, Carnegie Mellon Univ., Pittsburgh, PA, USA, 2001. M. C. Paulk, B. Curtis, M. B. Chrissis, and C. V. Weber, “Capability Maturity Model for Software, Version 1.1”, Carnegie Mellon Univ., Pittsburgh, PA, USA, 1993. B. S. Hauge, and B. A. Mercier, “Reliability Centered Maintenance Maturity Level Roadmap”, in Proc. of the Annual Reliability and Maintainability Symposium, 2003, Tampa, FL, USA. Aberdeen Group, “The Asset Management Benchmark Report – Moving Toward Zero Downtime”, The Aberdeen Group, 2006. C. Cholasuke, R. Bhardwa R., and J. Antony, “The status of maintenance management in UK manufacturing organizations: results from a pilot surveys”, Journal of Quality in Maintenance Engineering, vol 10, no. 1, pp. 5-15, 2004.