Image Filter Effectiveness Characterization Based on HVS Vladimir V. Lukina, Nikolay N. Ponomarenkoa, Sergey S. Krivenkoa, Karen O. Egiazarianb, Jaakko T. Astolab a
b
National Aerospace University, 61070, Kharkov, Ukraine; Tampere University of Technology, Institute of Signal Processing, P.O. Box-553, FIN-33101, Tampere, Finland ABSTRACT
It is a quite common that acquired images are noisy and image filtering is a necessary step to enhance them. Usually image filtering effectiveness is characterized in terms of MSE or PSNR although nowadays it is well understood that these criteria do not always correspond adequately to visual perception of processed images. Recently several new measures of image quality have been proposed. In particular, two metrics, called PSNR-HVS and PSNR-HVS-M, were designed and successfully tested16,17. Both take into account different sensitivity of a human eye to spatial frequencies, the latter one also accounts for the masking effects. Using these two metrics as well as a traditional PSNR and used by NASA metric DCTune, we have analyzed performance of five different filters (standard mean and median, sigma, Lee and DCT based filters) for a set of test images corrupted by an additive Gaussian noise with a wide set of variance values. It has been shown that there are many situations when PSNR after filtering improves while one or all other metrics manifest image quality decreasing. Most often this happens if noise variance is small and/or an image contains texture. Comparisons show that DCT based filter commonly outperforms other considered filters in the sense of denoised image visual quality. At the same time, the standard mean filter produces worse visual quality of processed images even its scanning window size is 3x3. Keywords: additive noise, image filtering, perceptual quality.
1. INTRODUCTION Digital images of different origin are commonly noisy. This statement relates to conventional optical and ultrasound medical images1,2, radar, optical and infrared remote sensing data3-5, etc. This noise can be of a different type (additive, signal-dependent, impulsive, mixed) and its characteristics may vary in very wide limits. In some situations, a noise influence can be neglected while solving a final task of image analysis. However, there are quite many practical situations when noise is clearly visible and it obstructs a retrieval of useful information from an observed image. Optical images are most common and in many cases they are subject to observation and analysis. A visual quality of such images becomes of a major importance (note that many other, not optical, images are also visualized and analyzed by inspection2). To improve image quality, they are frequently subject to some pre-processing, like sharpening, filtering, histogram equalization, homomorphic transformation, etc.1 Below we will study the influence of image filtering on visual quality of pre-processed images of optical nature. Note that the aforementioned operations of image pre-processing can both improve and make worse image perception which is, moreover, subjective, i.e., observer dependent. In particular, people while looking at filtered images often have an impression that they are blurred and original noisy versions of images have been of a better quality although presented values of MSE or PSNR (conventional measures to characterize filtering effectiveness) show that “considerable improvement of image quality has been attained”. One reason of this contradiction is that MSE and PSNR are measures a
Correspondence to Lukin V.V.: e-mail
[email protected] tel./fax +38 057 3151186 Computational Imaging VI, edited by Charles A. Bouman, Eric L. Miller, Ilya Pollak, Proc. of SPIE-IS&T Electronic Imaging, SPIE Vol. 6814, 68140Z, © 2008 SPIE-IS&T · 0277-786X/08/$18
SPIE-IS&T/ Vol. 6814 68140Z-1 2008 SPIE Digital Library -- Subscriber Archive Copy
that are not adequate to perceptual quality of images. This has been stated by many authors dealing with different applications of image and video processing and analysis6-9. As the problem of providing adequate quantitative metrics for image visual quality characterization has been understood, quite intensive research has been started with intention to design and verify other than MSE and PSNR metrics for image quality quantitative evaluation6-17. This problem is rather complicated since a lot of different aspects of human vision system (HVS) should be taken into account and some of these aspects are still not well understood and studied. Moreover, experiments have to be quite extensive considering many different points like a set of test images (video data) used, number of subjects (observers, volunteers participating in experiments), types of computer monitors and conditions of image analysis and ranking (quality assessment), methodology settings for an experiment and processing of obtained results, types and levels of distortions, etc. Thus, we have to restrict ourselves to a particular case of analyzing visual quality of optical images: gray-scale images originally corrupted by an additive noise and then filtered by a set of conventional denoising techniques. In our study, a set of eight optical images is used. It includes both traditional images widely used by image processing community as well as high quality images obtained by a color digital camera and transformed to a gray-scale. Noise is assumed to be additive, zero mean and Gaussian with several values of variance varying from 50 to 400. Note that a filter’s effectiveness depends upon many factors like a type of the filter and its parameters, a type of noise and its variance, image characteristics (context and/or complexity18 that can be characterized by a percentage of pixels that correspond to image homogeneous regions, edges, details, and texture, or in some other way18). Keeping this in mind, we have obtained a rather large amount of data that, unfortunately, could not be fully presented in this paper, where we show only the tendencies observed and some examples that seemed to be the most interesting. One more important item is that in assessing image quality we basically exploit recently introduced metrics PSNR-HVS and PSNR-HVS-M16,17 (see also http://www.cs.tut.fi/~ponom/) as well as a metric DCTune proposed and exploited by NASA15,8. According to our preliminary results17, just these measures have demonstrated the best agreement between their ordered values and distorted images ranked in ascending order according to their perceptual quality. In Section 2 we additionally confirm this by new experiments carried out with participation of 21 volunteers. Section 3 contains many factual data in the form of plots and examples of original, noisy and filtered images that demonstrate the obtained results and allow a reader to draw his/her own conclusions.
2. USED MEASURES, EXPERIMENT CONDITIONS AND RESULTS Let us first recall what are the requirements to quantitative measures of image visual quality? First, they should take into account different aspects and peculiarities of HVS like sensitivity to a light level, color, spatial frequencies, local image contrast and masking effects, eccentricity, etc. To our best knowledge, there are no metrics that are able to take into account all these phenomena. Since we have to focus on gray-scale images and consider an additive noise case, it is possible to ignore HVS sensitivity to color and eccentricity effects. Light level in our experiments is supposed to remain almost constant. Then it is reasonable to mainly concentrate on taking into account HVS sensitivity to spatial frequencies and masking effects8,19. Second, the behavior of a quantitative measure should be monotonic, i.e. a larger (or smaller like in DCTune15) value should correspond to better visual quality of an observed image. Here we should note that different already designed metrics vary in different, limited or unlimited, range and can be expressed in different units. For example, the metric DCTune15 can be only non-negative and the minimal value equal to zero corresponds to the perfect quality (undistorted image). In turn, PSNR-HVS and PSNR-HVS-M16,17 are expressed in dB and larger values relate to better visual quality of an image. Some other metrics7,11 vary in the limits from 0 to 1 where 1 corresponds to the perfect quality. Third, since a metric’s performance is analyzed on the basis of experiments with subjects (humans) it is supposed that their opinions are somehow aggregated (processed jointly, averaged) and these opinions (image ranking or quality evaluation results) mainly coincide, i.e. subjects participating in experiments are able to come to agreed decision or a number of disagreements (non-coincidences of opinions) is appropriately small. The latter depends on how experiments were
SPIE-IS&T/ Vol. 6814 68140Z-2
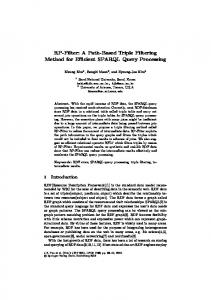
carried out and how the obtained results were processed. There are two commonly accepted methodologies of assessing visual quality of images6. According to the first methodology, a subject is putting some marks or values to images while estimating their quality20. In this case, usually only one distorted image is presented at a monitor screen at each step of quality evaluation (although the corresponding undistorted can be presented as well). As the result of experiment, to all distorted images some marks are assigned. Then, the considered images can be ranked according to their quality with respect to these assigned marks. One drawback of this methodology is that at the beginning of the experiment a subject might not know what will be a range of distortions in the considered images. This can lead to a problem of mark assigning and, as the result, to non-accurate assessments of visual quality of images. The second methodology presumes pair-wise comparison of distorted images16,17. In this case, there are two options. First, two distorted images are switched at monitor screen. By comparing them, a subject (observer) selects a better one (closer to the original) for a given pair. Second, two distorted images are displayed simultaneously. Similarly to the first methodology, the undistorted (original) image might be presented at a monitor screen simultaneously with distorted image(s) for assistance purpose. We have followed the first way (see Fig.1). The original (noise free) image has been placed in the left part and two distorted ones were switched in between in the right part of display by clicking (pressing) on them. Selection of the better image is done by pressing the button “This is better” when the corresponding image is displayed. In opposite to the first methodology, quality assessment simplifies and aforementioned drawback is avoided. But a number of pair-wise comparisons to be performed is considerably larger than a number of images. Thus, a subject needs more time to make quality assessment and image ranking. Note that a tired subject might do his/her job worse or make up image comparisons formally. 1-at diatorted image (preaa on the image to view 2-nd image)
Original image
I— - —• _______________ —
13%
This is better
Fig. 1. Screen-shot of experiment
All this requires careful selection of a number of images to be compared (assessed). First, this number of images should not be too large. Second, a set of distorted images has to contain such images that a) distortions are visible; b) it is possible and not very complicated to undertake a decision what image in a pair is better. At the same time, comparisons should not be trivial (if different subjects produce slightly different ordered sets of images, this shows that the task of comparing images has not been trivial). Third, all comparisons should take up to 30 minutes to be carried out not to make a subject tired (our experiment for one image took less than 10 minutes).
SPIE-IS&T/ Vol. 6814 68140Z-3
According to our experience, distortions are commonly visible if conventional PSNR of a distorted image does not exceed 35 dB. Let us take into account that the best transform based filters (wavelet, DCT) for the case of additive noise produce PSNR improvement up to 5…7 dB if original PSNR of a noisy image has been about 28…30 dB 21. Then it means that in the best case, PSNR of a noisy image should not be larger than 30…31 dB. This means that in case of additive Gaussian noise, its minimal variance has to be about 50 (corresponding to PSNR=31.1 dB). This is a lower limit of noise variance. Besides, we have used in our experiments the images artificially corrupted by an additive Gaussian noise with variance σ 2 equal to 100, 200, and 400, thus providing PSNR values of noisy images equal to 28.1, 25.1 and 22.1 dB, respectively. Noise in such images can be clearly seen. Another question is a selection of filter types and parameters to be studied. On one hand, the number of existing filters suited for processing images corrupted by additive Gaussian i.i.d. noise is enormous. Even filter classification is problematic. There are linear non-adaptive and adaptive filters, nonlinear non-adaptive and adaptive ones, different transform based denoising techniques, a lot of empirical filters1,10,21-23, etc. Besides, filter performance often depends upon filter parameters like scanning window22 or block size21, threshold type (hard or soft) and value (for transform base filters)21 and so on. On the other hand, we already have four values of noise variance and if a number of considered filters (or their variants with different parameters) will be too large, this will make experiments to be too complicated. Therefore, we have restricted the number of filter types to five, namely, a standard mean22, a standard median22, a sigma24 and local statistic Lee25 filters, and a DCT based denoising technique21. Our decision has been motivated by the following reason. The mean filter is a typical and simplest representative of linear filters similarly as the standard median filter is a typical representative of nonlinear (order statistic based) non-adaptive filters. The sigma and local statistic Lee (version for an additive noise) filters can be referred to empirical and local adaptive nonlinear ones and they are often included into the list of denoising techniques offered by standard software packages of image processing26. The DCT based denoising technique21 (with full overlapping of blocks of size 8x8 pixels and hard thresholding with the threshold T = 2.6σ ) has been chosen as a good and rather simple representative of transform based filters (as shown in the paper21, it is competitive or even outperforms modern advanced wavelet based denoising techniques). Since for the mean, median, sigma and Lee filters their performance also depend upon scanning window size, we have decided to apply 5x5 pixel windows in the visual inspection experiments. Thus, the total number of visualized and analyzed images occurs to be 24, four of them are noisy images and there are twenty filtered images, four for each of five filter types.
Each subject orders observed images according to their perceptual quality, and then the obtained sequences are averaged. Besides, for each 24 images several metrics are calculated. These metrics are the following: conventional PSNR, SSIM10, UQI11, PSNR-HVS16, PSNR-HVS-M17, and DCTune15. Let us give some details concerning metrics PSNRHVS and PSNR-HVS-M. The metric PSNR-HVS exploits a modified variant of MSE calculation in blocks that uses a matrix of correcting factors for DCT coefficients deduced from quantization table of the standard JPEG27. In this manner, human eye different sensitivity to different spatial frequencies is taken into account. The metric PSNR-HVS-M further advances PSNR-HVS by taking into consideration between-coefficient contrast masking effects discovered by A.B. Watson et al.28 According to our experiments17, PSNR-HVS-M has outperformed other well-known metrics and demonstrated high correlation with the results of subjective experiments (Spearman rank order correlation29 is 0.984, Kendall correlation30 is 0.935). Note that Spearman and Kendall correlations have been used since it was necessary to “compare” ordered quantitative measures with ordered non-quantitative sets (sequences) of images. First, the tests have been carried out for three images (Baboon, Lena, and Barbara), the averaged order has been determined and rank correlation factors have been calculated. The results are the following: DCTune, PSNR, SSIM, UQI, PSNR-HVS, and PSNR-HVS-M metrics have the values of Spearman correlation 0.910, 0.796, 0.798, 0.830, 0.904, and 0.933, respectively. Kendall correlation values are equal to 0.739, 0.624, 0.612, 0.599, 0.621, and 0.775, respectively. As seen, PSNR and SSIM possess the smallest, i.e., the worst correlation factors. The metrics PSNR-HVS-M, DCTune, and PSNR-HVS produce considerably larger correlations than UQI, and, certainly, than conventional PSNR and SSIM. This means that PSNR-HVS and, especially, PSNR-HVS-M and DCTune are more adequate to image visual quality.
SPIE-IS&T/ Vol. 6814 68140Z-4
DCT
Mean
Lee
Med
Sig
Noise
25
20
15
10
5
0 0
50
100
150
200
250
300
350
400
450
a DCT
Mean
Lee
Med
Sig
Noise
25
20
15
10
5
0 0
50
100
150
200
250
300
350
400
450
b DCT
Mean
Lee
Med
Sig
Noise
25
20
15
10
5
0 0
50
100
150
200
250
300
350
400
450
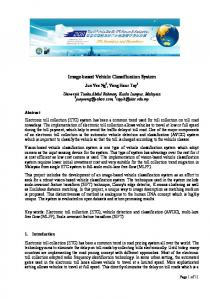
c Fig. 2. Dependences of parameters Qi for the images Lena (a), Barbara (b) and Baboon (c) for the DCT based filter (DCT), mean filter (Mean), local statistic Lee filter (Lee), median filter (Med), sigma filter (Sig) and noisy images (Noise).
The obtained results for different filters can be analyzed in the following way. After obtaining the results for all observers and ranking them for each image and for each observer, it becomes possible (for a particular test image) to determine an average place of a given distorted image in ranked sequences. This average place Pi, i=1,…,24 is commonly ex-
SPIE-IS&T/ Vol. 6814 68140Z-5
pressed by a non-integer value (since different observers produce different rankings). We have calculated parameters Qi=25-Pi and placed them on plots depending upon a filter and a variance of noise in noisy image they correspond. The values Qi that relate to the same filters and for noisy images before processing have been connected by curves to demonstrate a dependence of occupied place on noise variance for noisy image that has been processed and on a filter type. Larger values of Qi correspond to a better visual quality of images. The obtained plots are given in Fig. 2. A general tendency is that the output images of the mean and median filters commonly possess the worst visual quality and it is even worse than the quality of images corrupted by intensive noise with variance 200. The visual quality of the output images of the Lee and sigma filters is almost the same as the quality of noisy images with the same variance of noise. Only for small variances of noise these two filters produce some improvement of visual quality. The DCT based filter always provides the best visual quality (on the average). However, for the image Baboon the best values Qi for this filter are of the order 20. This means that the output images for this filter are not always considered the best (the first in ranked sequences) by observers. This shows that different observers have some variability of opinions and in some situations it is difficult to make a decision.
3. ANALYSIS OF FILTER PERFORMANCE Let us give some data showing that the use of the metrics PSNR-HVS16, PSNR-HVS-M17, and DCTune15 can draw to more correct conclusions in evaluation of image visual quality than conventional PSNR. First, consider data obtained for the test image Baboon which contains a lot of texture. The obtained results for the standard mean (3x3 pixels), sigma (7x7 pixels), and DCT based filters are presented in Tables 1-3, respectively. Note that here we use the 3x3 mean filter since for larger sizes of the scanning window it smoothes images so considerably that image visual quality degradation becomes obvious. Note again, that for metrics PSNR, PSNR-HVS16, PSNR-HVS-M17 the values are expressed in dB and larger values correspond to better quality. On the contrary, recall that for the metric DCTune15 image quality is considered better if metric values are smaller (closer to zero). As seen from data presented in Table 1, the mean filter even for the case of minimal size of its scanning window for textured images like Baboon produces decrease of output image quality (in comparison to original image quality) with respect to all considered quantitative metrics. The only exception is the case of large σ 2 = 400 for which the mean filter output image PSNR, DCTune, and PSNR-HVS slightly improve in comparison to the corresponding metrics for noisy images (before filtering). At the same time, PSNR-HVS-M after filtering becomes worse (decreases) even for σ 2 = 400 . One can perform visual inspection of images presented in Fig. 3 where the original Baboon image is given in a), noisy one – in Fig. 3,b) and the mean filter output image is represented in Fig. 3,d). Noise removal effect is clearly seen (especially in the central part of the image), but some blurring is simultaneously observed. Thus, it is hard to deduce has image visual quality improved or not after filtering. The sigma filter (see data in Table 2) can be considered more effective in the sense of visual quality improvement. The values of all metrics improve after filtering (PSNR, PSNR-HVS, and PSNR-HVS-M increase values and DCTune reduces). However, manifested improvements are not large even for intensive additive noise.
σ
2
50 100 200 400
Table 1. Metrics’ values for the image BABOON processed by the 3х3 mean filter. Before filtering After filtering PSNR, DCTune PSNRPSNR-HVSPSNR, DCTune PSNRdB HVS, dB M, dB dB HVS, dB 31.12 6.90 31.09 36.87 23.46 12.59 23.15 28.12 9.77 28.09 32.84 23.38 13.07 22.92 25.12 13.47 25.15 29.08 23.22 14.21 22.49 22.13 19.21 22.12 25.39 22.91 16.58 21.72
SPIE-IS&T/ Vol. 6814 68140Z-6
PSNR-HVSM, dB 26.78 26.40 25.71 24.53
σ
2
50 100 200 400
σ
2
50 100 200 400
Table 2. Metrics’ values for the image BABOON processed by 7х7 sigma filter. Before filtering After filtering PSNR, DCTune PSNRPSNR-HVSPSNR, DCTune PSNRdB HVS, dB M, dB dB HVS, dB 31.12 6.90 31.09 36.87 31.88 6.49 31.32 28.12 9.77 28.09 32.84 29.50 8.65 28.72 25.12 13.47 25.15 29.08 27.17 11.23 26.24 22.13 19.21 22.12 25.39 25.01 14.62 23.79
PSNR-HVSM, dB 36.99 33.34 30.03 26.82
Table 3. Metrics’ values for the image BABOON processed by the DCT based filter. Before filtering After filtering PSNR, DCTune PSNRPSNR-HVSPSNR, DCTune PSNRdB HVS, dB M, dB dB HVS, dB 31.12 6.90 31.09 36.87 32.68 6.32 31.79 28.12 9.77 28.09 32.84 30.42 8.42 29.19 25.12 13.47 25.15 29.08 28.31 10.83 26.73 22.13 19.21 22.12 25.39 26.35 13.96 24.28
PSNR-HVSM, dB 37.56 33.90 30.51 27.27
:"j; 'j*
4: 1—,, C
,fl-
a)
b)
t c)
d)
Fig. 3. а) Original (noise-free) image Baboon; b) Noisy image, σ 2 = 400 , d) output image for the DCT based filter, k =2,6; d) output image for the 3x3 mean filter.
SPIE-IS&T/ Vol. 6814 68140Z-7
The DCT based filter (see data in Table 3) is even more effective than the sigma filter. It produces improvement of all metrics and for all variances of noise. These improvements are larger than for the sigma filter and, certainly, larger than for the 3x3 mean filter. Such conclusion can be also drawn from comparative analysis of images presented in Fig. 3,b-d where Fig. 3,c) shows the output image for the DCT based filter. We would like to draw reader’s attention to one fact. While PSNR after denoising can improve by, let’s say, 2.9 dB (like, e.g., for σ 2 = 400 in case of the sigma filter), PSNR-HVS-M increases only by 1.4 dB. Similar phenomena are observed for other noise variances and filter types. An increase of PSNR-HVS-M is smaller than the corresponding increase of PSNR. Moreover, there are cases when PSNR evidences in favor of filter effectiveness and PSNR-HVS-M at the same time manifests image visual quality worsening. To analyze image quality before and after filtering in more convenient form and to avoid replicating data for noisy images in left parts of Tables, below we give plots of dependences of metric changes as functions of noise variance. For the metrics PSNR, PSNR-HVS, and PSNR-HVS-M, the changes are characterized by parameters (differences) ∆ P = PSNR f − PSNRn , ∆ H = PSNR − HVS f − PSN − HVSn , and ∆ M = PSNR − HVS − M f − PSN − HVS − M n , respectively (expressed in dB), and for DCTune by a parameter ∆ D = DCTunen − DCTune f where subscripts f and n in all cases correspond to filtered and noisy images, respectively. Consider now the results for another typical test image Peppers. The simulation data for the DCT based filter are presented in Fig. 4,a) and for the 5x5 standard median filter in Fig. 4,b). As seen, the use of the DCT based filter results in improvements of processed image quality according to all considered metrics for entire range of noise variance variation. Again the increase of the metrics PSNR-HVS and PSNR-HVS-M is smaller than the corresponding increase of PSNR. At the same time, the increase of metric values after filtering for the image Peppers is considerably larger than for the previously analyzed image Baboon. This is not surprising since the image Peppers contains much less texture than the image Baboon and is “less complex” for filtering. Considerable improvement of image visual quality evidenced by PSNR-HVS-M increase after filtering is also well observed by comparison of noisy and DCT-denoised images represented in Fig. 5,a) and 5,b). -
- - -PSNR-S— - -PsNR_s_vI
- - - -PSNR-S— - -PsNR_s_vI
ID
6
— -4
— 2 —12
IS
25
2
75 lOOl l€ 2
b) a) Fig. 4. The plots of metric differences ∆ for different variances of noise for the DCT based filter (a) and 5x5 standard median filter (b), both for the test image Peppers
In case of using the 5x5 standard median filter, the observed tendencies considerably differ. First, for small σ2 , there is a decrease of image quality after filtering according to all metrics (all differences ∆ are negative). For σ2 equal to 100 and 200, ∆P becomes positive, but ∆H, ∆M , and ∆D remain negative or close to zero. This is demonstrated by two images in Fig. 6. On one hand, the median filter removes noise well enough. But the introduced artifacts (blur, distortions of edges and details) do not allow to surely state that the output image visual quality has become better than the noisy image visual quality. Note that conventional PSNR in this case has improved by about 3 dB. This example clearly demonstrates problems of using PSNR for assessing visual quality of images.
SPIE-IS&T/ Vol. 6814 68140Z-8
a)
b) 2
Fig. 5. A fragment of noisy image Peppers, σ = 400 (а) and the output of DCT based filter (b)
b)
a) 2
Fig. 6. A fragment of noisy image Peppers, σ = 100 (а) and the output of the 5x5 median filter (b) The results for the test image Lena are very similar to those ones given above for the image Peppers. The data obtained for the DCT-based, mean, sigma and mean filters for the test images Barbara and Goldhill occupy “intermediate place” between the data obtained for the image Baboon and the images Peppers and Lena. The data for the Lee filter are commonly very similar to those ones obtained for the sigma filter. This can be also concluded from plots given in Fig. 4 and later in Fig. 8. To our opinion, it is more interesting to analyze the results for two real scene images that have been taken by a digital camera Olympus-650UZ in good conditions (day time, good light illumination, large exposure time), retrieved from the camera in RAW format and then converted to monochrome (gray scale) images. Images formed in such conditions are almost noise-free32. At least, for our cases when noise with variances 50 or larger is artificially added to images, noise component in original images retrieved from the camera can be neglected. Fig. 7 presents original real life images that we have called “Grass” and “Ivanof”. The first one is a photo done in the field, the second image is a photo of a topographic map fragment of a region near the town of Ivanofrankivsk located in Western part of Ukraine. Our special intention was to consider rather complex natural images that contain either a lot of texture or many fine details. The results obtained for the image “Grass” in case of applying the Lee filter for its processing are given in Fig. 8,a). As seen, PSNR improvement is observed for all four values of noise variance. At the same time, the metric PSNR-HVS-M indicates small decrease of visual quality of processed image in comparison to original one. Visual analysis of noisy and processed images shows that the filtered one seems to be slightly blurred (see Fig. 9). At the same time, noise being rather intensive ( σ2 = 200) is almost not seen in noisy image (Fig. 9,a) due to the fact that this natural test image is very textural and this masks noise17. Noise suppression effect due to filtering can be visually observed only for some quasihomogeneous regions of leafs. Note that the metric DCTune does not indicate degradation of visual quality for this test image (see curves in Fig. 8,a).
SPIE-IS&T/ Vol. 6814 68140Z-9
a) b) Fig. 7. Natural mages “Grass” (а) and “Ivanof” (b) used in experiments - - - -PSNR-S— - .PsNR_s_vI
- - - -PSNR-S— - .PsNR_s_vI 2
2
—--—
—l
—l
—
—
e 7511 l lSOh7S2I2O27S3I33€37S 41
e 7511 l lSOh7S2I2O27S3I33€37S 41 2
2
b) a) Fig. 8. The plots of metric differences for different variances of noise for the 7x7 Lee filter for the image “Grass” (a) and for image “Ivanof” for the 9x9 sigma filter (b)
a)
b) 2
Fig. 9. Fragments of the natural mages “Grass” with noise, σ = 200 (а) and after its processing by the 7x7 Lee filter (b)
We have also analyzed data for the image “Ivanof” processed by the 9x9 sigma filter. The obtained plots are presented in Fig. 8,b). Although small improvement of processed image quality is indicated by criteria PSNR and DCTune, other metrics show decrease of image visual quality for all considered values of noise variance. Completing the analysis, we would like to draw readers’ attention to several observations following from our investigations. As can be predicted, the filters based on using a priori known or pre-estimated noise variance as a parameter of a filter (among the considered filters, the Sigma, Lee and DCT based filters use it whilst the mean and median filters do
SPIE-IS&T/ Vol. 6814 68140Z-10
not), in general, provide better visual quality of processed images. However, it is a quite typical situation that noise variance is a priori unknown and then it should be pre-estimated. But it is quite difficult to provide appropriately accurate estimates of noise variance for an image at hand especially if it is textural32,33. In our experiments we have tested cases when inaccurate estimates of noise variance have been used instead of true values for the Sigma, Lee and DCT based filters. It has been shown that in majority of such situations the processed image quality is worse than if the true value of noise variance is used as the parameter in these filters. The best visual quality (among the considered filters) is commonly provided by the DCT based filter. This is basically explained by its ability to preserve texture well34,35. But the DCT based filter is not the best in the sense of small detail and edge preservation, especially if details and edges are high contrast with respect to surrounding background34. In this sense we expect that even better quality of processed images will be provided by the locally adaptive filters32,36,37. Note that according to the results of assessment of filtered image visual quality given in the paper20 the shape adaptive DCT based filter37 was the first or the second best among the considered set of transform based denoising techniques. Finally, for some types of images and ranges of noise variances (images containing a lot of texture and fine details, relatively small values of noise variance) it is hardly to expect that any kind of filtering will be able to considerably improve visual quality of processed images with respect to quality of noisy images. Therefore, it could be nice to design automatic methods for predicting such practical situations by exploiting techniques of image complexity analysis and blind evaluation of noise statistics.
4. CONCLUSIONS AND FUTURE WORK It is shown by experiments that the metrics PSNR-HVS-M and DCTune are more adequate in assessing visual quality of images than other metrics. This conclusion is used for performance comparison of several filters applied to removal of additive Gaussian noise. Among the considered techniques, only the DCT based filter really improves visual quality of processed images in comparison to the corresponding noisy images. Other filters, like the local statistic Lee and sigma filters, produce improvement for rather simple images and not very intensive noise but their use can result in degradation of image visual quality in other, more complex situations. The median and mean filters while removing noise commonly distort and/or blur images so considerably that this results in degradation of image visual quality. In future we plan to increase the number of test images, extending the range of analyzed filters and attracting more observers.
REFERENCES 1. 2. 3. 4.
5. 6. 7. 8. 9.
K.N. Plataniotis, A.N. Venetsanopoulos, Color Image Processing and Applications, Springer-Verlag, NY, 2000. A. Picurica, A. Wink, E. Vansteenkiste, W. Philips, and J. Roerdink, A review of wavelet denoising in MRI and ultrasound brain imaging, Current Medical Imaging Reviews, No 2(2), pp. 247-260, 2006 (see also http://telin.ugent.be/~ervsteen/doctoraat.pdf). J. Xiuping, J.A. Richards, W. Gessner, and D.E. Ricken, Remote Sensing Digital Image Analysis. An Introduction. 3-rd edition. Berlin: Springer-Verlag, 1999, 400 p. G.P. Kulemin, A.A. Zelensky, J.T. Astola, V.V. Lukin, K.O. Egiazarian, A.A. Kurekin, N.N. Ponomarenko, S.K. Abramov, O.V. Tsymbal, Y.A. Goroshko, and Y.V. Tarnavsky, Methods and Algorithms for Pre-processing and Classification of Multichannel Radar Remote Sensing Images, TICSP Series #28, Dec. 2004, ISBN 952-15-1293-8, Tampere, Finland, TTY Monistamo, 116 p. R. Hoffman, and A. Markman, Interpreting Remote Sensing Imagery: Human Factors, CRC Press, LLC, 2001. E. Vansteenkiste, D. Van der Weken, W. Philips, E. Kerre, Evaluation of the perceptual performance of fuzzy image quality measures, Knowledge-Based Intelligent Information and Engineering Systems, Lecture Notes in Computer Science, Springer, Vol. 4251, pp. 623-630, 2006. Z. Wang, A. Bovik, H. Sheikh, and E. Simoncelli, Image quality assessment: from error visibility to structural similarity, IEEE Trans. on Image Processing, Vol.13, pp.600-612, 2004. A.B. Watson, Perceptual optimization of DCT colour quantization matrices, Proceedings of Image Processing Conference ICIP-94, 1, pp.100-104, 1994. K Ferguson, An adaptive human vision model for subjective video quality rating prediction among CIF, SD, HD and E-cinema; http://www2.tek.com/cmswpt/tidownload.lotr?ct=TI&cs=wpp&ci=11364&lc=EN
SPIE-IS&T/ Vol. 6814 68140Z-11
10. 11. 12. 13. 14. 15. 16. 17. 18. 19. 20. 21. 22. 23. 24. 25. 26. 27. 28. 29. 30. 31. 32. 33. 34. 35. 36. 37.
A. Bovik, Handbook of Image and Video Processing, Academic Press, 2000. Z. Wang, A. Bovik, A universal image quality index, IEEE Signal Processing Letters, 9, pp. 81–84, March, 2002. I. R. BT.500-8, Methodology for the subjective assessment of the quality of television pictures, 1998. M.S. Moore, Psychophysical Measurement and Prediction of Digital Video Quality, Ph.D. thesis, University of California Santa Barbara, June 2002. S.Yao, W. Lin., Rahardia S., X. Lin, E.P. Ong, Z.K. Lu, and X.K. Yang, Perceived visual quality metric based on error spread and contrast, IEEE International Symposium on Circuits and Systems, vol. 4, pp. 3793-3796, 2005. http://vision.arc.nasa.gov/dctune/ DCTune 2.0 page. K. Egiazarian, J. Astola, N. Ponomarenko, V. Lukin, F. Battisti, M. Carli, New full-reference quality metrics based on HVS, CD-ROM Proceedings of the Second International Workshop on Video Processing and Quality Metrics, Scottsdale, USA, 4 p., 2006. N. Ponomarenko, F. Silvestri, K. Egiazarian, J. Astola, M. Carli, V. Lukin, On between-coefficient contrast masking of DCT basis functions, CD-ROM Proceedings of the Third International Workshop on Video Processing and Quality Metrics, Scottsdale, USA, 4 p., 2007. M.I. Chacon-Murguia, A.D. Corral-Saenz, R.S. Rodriguez, A fuzzy approach on image complexity measure, Computacion y Sistemas, Mexico, 10, No 3, pp. 268-284, 2007. W. Zhou, R.S. Hamid, and A.C. Bovik. The handbook of video databases: Design and Applications, CRC Press, 2003. E. Vansteenkiste, D. Van der Weken, W. Philips, E. Kerre, Psycho-visual quality assessment of state-of-the-art denoising schemes, Proceedings of EISIPCO, 5 p., 2006. V.V. Lukin, R. Oktem, N. Ponomarenko, K. Egiazarian, Image filtering based on discrete cosine transform, Telecommunications and Radio Engineering, 66, No 18, pp. 1685-1701, 2007. J. Astola, P. Kuosmanen, Fundamentals of nonlinear digital filtering. Boca Raton (USA): CRC Press LLC, 1997, 276 p. Nonlinear Signal and Image Processing: Theory, Methods, and Applications (Electrical Engineering & Applied Signal Processing Series), Ed. by K. Barner and G. Arce, CRC Press, 2003, 560 p. J.S. Lee, Digital image noise smoothing and the sigma filter, Computer Vision, Graphics and Image Processing, 24, pp. 255-269, 1983. J. S. Lee, Refined Filtering of Noise Using Local Statistics, Computer Graphics and Image Processing, no. 24, pp. 259-269, 15, pp. 380-389, 1981. http:/www.envi-sw.com; www:http.rsinc.com/envi G. Wallace, The JPEG Still Picture Compression Standard, Comm. of the ACM, vol. 34, No.4, 1991. Solomon J. A., Watson A. B., and Ahumada A. Visibility of DCT basis functions: Effects of contrast masking. Proceedings, Data Compression Conference, Snowbird, Utah: IEEE Computer Society Press, 361-370, 1994. http://en.wikipedia.org/wiki/Spearman's_rank_correlation_coefficient http://en.wikipedia.org/wiki/Rank_correlation D. Taubman, M. Marcellin, JPEG 2000: Image Compression Fundamentals, Standards and Practice. Boston: Kluwer, 2002. A. Foi, Pointwise Shape-Adaptive DCT Image Filtering and Signal-Dependent Noise Estimation: Thesis for the degree of Doctor of Technology, Tampere University of Technology, Tampere, Finland, Dec. 2007. V.V. Lukin, S.K. Abramov, N.N. Ponomarenko, B. Vozel, K. Chehdi, Methods for blind evaluation of noise variance in multichannel optical and radar images, Telecommunications and Radioengineering, 65 (6), pp. 509-537, 2006. O. Tsymbal, Multistage Robust Adaptive Filtering of Multichannel Remote Sensing Images: Thesis for the degree of Doctor of Technology, Tampere University of Technology, Tampere, Finland, June 2005. R. Oktem, K. Egiazarian, V. Lukin, N. Ponomarenko, O. Tsymbal, Locally Adaptive DCT Filtering for SignalDependent Noise Removal, EURASIP Journal on Advances in Signal Processing, Article ID 42472, 10 p., 2007. N.N. Ponomarenko, V.V. Lukin, A.A. Zelensky, K.O. Egiazarian, J.T. Astola, Locally adaptive image filtering based on learning with clustering, Proceed. of the Conference “Image Processing: Algorithms and Systems IV”, San Jose, USA, SPIE 5672, pp. 94-105, 2005. A. Foi, K. Dabov, V. Katkovnik, and K. Egiazarian, Shape-adaptive DCT for denoising and image reconstruction, Proceedings of the Conference “Image Processing: Algorithms and Systems V”, San Jose, USA, SPIE 6064, 2006.
SPIE-IS&T/ Vol. 6814 68140Z-12