proposed model have three states instead of the normal two states. This makes the neural network more flexible than the two-state neural network, and allows ...
Image Parsing with a Three-State Series Neural Network Classifier
1
Mojtaba Seyedhosseini1,2 , Ant´onio R. C. Paiva1 and Tolga Tasdizen1,2 Scientific Computing and Imaging Institute, 2 Dept. of Electrical and Computer Eng., University of Utah, Salt Lake City, UT 84112 email: {mseyed,arpaiva,tolga}@sci.utah.edu
Abstract—We propose a three-state series neural network for effective propagation of context and uncertainty information for image parsing. The activation functions used in the proposed model have three states instead of the normal two states. This makes the neural network more flexible than the two-state neural network, and allows for uncertainty to be propagated through the stages. In other words, decisions about difficult pixels can be left for later stages which have access to more contextual information than earlier stages. We applied the proposed method to three different datasets and experimental results demonstrate higher performance of the three-state series neural network. Keywords-Image segmentation; Three-state neuron; Neural network;
I. I NTRODUCTION Image parsing is the problem of assigning an object label to each pixel. It unifies the image segmentation and object recognition problems. For instance, for a database of horse images, image parsing can be thought of as the task of classifying each pixel as part of a horse or nonhorse. In more complicated problems, image parsing might require multiple labels, e.g. roads, cars, houses etc. in outdoors scenes. Clearly, pixels can not be classified in this manner based only on their intensities or even local feature descriptors. Contextual information plays a critical role in resolving ambiguities [1], [9]. Image parsing can be posed as a supervised learning problem where a classifier is learnt from training data consisting of images and corresponding label maps. Autocontext [10] and convolutional networks [5] are two promising approaches that apply context to image parsing in the supervised learning setting. Convolutional networks are a type of artificial neural network (ANN) [4] in which each processing element carries out a convolution followed by a nonlinearity. Convolutional networks operate on image neighborhoods; however, due to successive convolutions, each hidden layer implicitly “sees” a larger context area of the input image than the previous layer. While the conventional use of convolutional networks has been object recognition [7], they have recently also been used for image parsing [5]. A related method, auto-context [10], employs a series of classifiers (Figure 2b) which use features computed from the output of the preceding classifier as well as image features. This strategy amounts to implicitly
using larger context areas with each classifier and is related to conditional random fields [10]. The advantage of the auto-context architecture over convolutional networks is the relative ease of training due to treating each classifier in the series separately. Different types of classifiers can be used in the auto-context architecture. Tu and Bi [10] used boosting whereas Jurrus et al. [6] employed ANNs. In our proposed method, we employ artificial neural networks in an auto-context architecture as in [6], except that we introduce three-state neurons instead of conventional two-state neurons (Figure 2b). We will call this the 3state series-ANN classifier. Previously, Meunier et al. [8] introduced a Hopfield-like network of three-state neurons in which the additional state permits the network to deal with situations where the state of some neurons is unknown and as a result it can be used for pattern completion. However, Hopfield network has a very restrictive structure and to our knowledge, three-state neurons have not been previously used in feedforward multilayer ANNs for pattern classification. In a typical feedforward ANN, a neuron consists of a nonlinear function such as the hyperbolic tangent or the sigmoid function applied to weighted sum of inputs and a bias term. This setup allows for two stable output values, i.e., −1 and +1 in the case of the hyperbolic tangent function, and intermediate transitionary output values. Hence, we refer to this arrangement as the two-state neuron. We generalize this neuron model to a three-state model by including an additional bias term which allows for a third stable output level, i.e. 0, in addition to −1 and +1 in the case of the hyperbolic tangent function. In the series-ANN architecture, three-state networks are more flexible than two-state networks due to the possibility of making hard decisions only for those samples which a given stage is confident about and leaving the decision for difficult samples to later stages. II. T HE T HREE -S TATE N EURON The main difference between our proposed three-state neuron and the conventional two-state neuron is the use of an additional bias term in the activation function. We propose the following model for a three-state neuron 0.5f (xT x + b1 ) + 0.5f (xT x + b2 ) where x is the input vector, x is the weight vector, b1 , b2 are the bias terms and f is the nonlinear activation function. For the hyperbolic tangent activation
function, the output is: 1 1 tanh(xT x + b1 ) + tanh(xT x + b2 ); (1) 2 2 however, the generalization applies to any nonlinearity. It is important to notice that the same weighted combination of inputs, xT x, is used in both functions. The update rule for the biases is: g(x) =
bnew = bold + µ ∗ e ∗ (1 − tanh2 (xT x + bold i i i ))
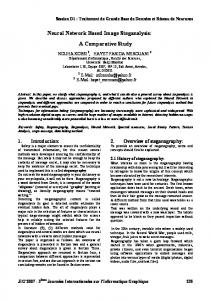
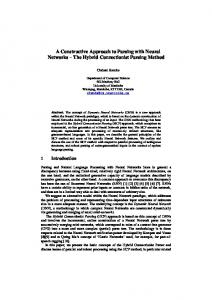
(2) Figure 1.
where µ is the stepsize and e denotes the backpropagated error. As the difference between b1 and b2 becomes large, the third state appears in the output (Figure 1). On the other hand, the three-state activation function converges to twostate activation function as the two bias terms become close. For a given xT x, the biases b1 and b2 can be thought of as low and high thresholds but this order is not enforced. In pattern classification, this allows for three stable outputs: if xT x is below the low threshold we can be confident that the pattern belongs in the negative class; if xT x is above the high threshold we can be confident that the pattern belongs in the positive class; finally, if xT x is between the two thresholds, this reflects a lack of confidence in the classification. Of course, intermediate values in a conventional twostate neuron can also be thought to represent uncertainty. The idea is that having a third state allows for better uncertainty representation. For the Gaussian case, the sigmoid function represents likelihood ratios optimally [2] and the motivation for a third state is not very compelling. On the other hand, for non-Gaussian distributions, very different responses can be obtained from a three-state neuron than a two-state neuron as we describe next. Consider the following hypothetical example of twoclass classification in which two classes are sampled from following uniform distributions: ( 1 if 0 ≤ x ≤ 1 p(x|class1 ) = (3) 0 otherwise and ( p(x|class2 ) =
1
if −0.5 ≤ x ≤ 0.5
0
otherwise
(4)
Notice that these two likelihood functions overlap 50%. Consider a network consisting of a single neuron whose input is x and the desired output is +1 and −1 for class1 and class2 , respectively. The network is trained to minimize the Mean Square Error (MSE) criterion. If we use the twostate activation function, we obtain the result shown in Figure 1(blue curve) and the final MSE is equal to 0.55. On the other hand, if we use the three-state activation function as in equation (1), we get the result shown in Figure 1(red curve), and the final MSE is equal to 0.49. Maintaing a stable third-state (value 0) for a wide range of input values results in a lower MSE value and thus it preserves more
Activation functions.
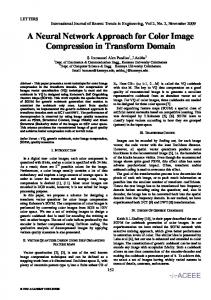
information from original data which can be used by next stages. III. T HREE -S TATE S ERIES -ANN Figure 2b illustrates the three-state series-ANN. S is the stencil(Figure 2a) which we use to compute the feature vector for each pixel of the input image and also for each pixel of the output stages. This helps the network in each stage to utilize nonlocal information. T is a threshold applied to the output of the last stage to produce the final result. Each stage produces a class probability image which is used as context for the next stage. One can notice that the threshold is applied only to the output of the last stage, otherwise, we lose useful information which can be used by next stages for improving decision. For each stage we use a three-state artificial neural network. That is, a neural network using 3-state neurons. The back-propagation algorithm is used to train each network. If we use a single ANN for classification, there is little motivation to use a three-state network. This is because thresholding is needed at the output of the ANN, and the two-state ANN and three-state ANN will likely generate the same thresholded output. On the other hand, using three-state neurons in the series-ANN structure increases the performance of the classifier because it propagates the uncertainties to next stages. Consider the following scenario. A given pixel is ambiguous to the first ANN in Figure 2b, i.e., more than a single class is equally likely as in our simple example in Section 2. The next stage will have more information because it will use as input both the image features and the output of the previous classifier in an area around the pixel in question providing context, using a stencil such as the one shown in Figure 2a. If threestate ANNs are used for the stages, such ambiguous pixels can easily be assigned a value of approximately 0 by early stages, leaving the decision to later stages which have access to increasing areas of context. IV. E XPERIMENTAL RESULTS In this section we illustrate and verify the performance of our proposed classification model in several experiments. In these experiments, each network has one hidden layer and the number of nodes of this hidden layer is determined
1
0.98
Fïvalue
0.96
0.94
(a)
0.92
twoïstate network(train) threeïstate network(train) twoïstate network(test) threeïstate network(test)
0.9
0.88
(b) Figure 2.
0.86
1
2
3
4
5
Number of Stages
(a) Stencil structure, and (b) Serial neural network diagram.
Figure 4. F-values at different stages of the classifier in the rectangle completion experiment.
0.95 0.9
notice that the difference in performance between the two approaches is observed during the initial stages and remains approximately constant afterward. This is because after the initial stages most of the samples are classified into one of the two classes and the third state no longer plays a major role in the classification.
0.85
Fïvalue
0.8 0.75 0.7
two state network(train) three state network(train) two state network(test) three state network(test)
0.65 0.6 0.55 0.5
1
2
3
Number of Stages
4
B. Rectangle completion 5
Figure 3. F-values at different stages of the classifier in the texture segmentation experiment.
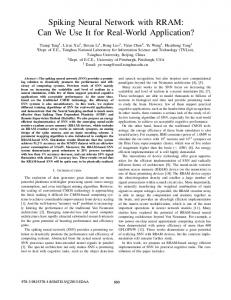
according to the complexity of the classification problem. Also, number of stages is determined according to the performance improvement in training. When the improvement is small we stop adding stages, as it is shown in Figures 3, 4. For comparison, we applied the same model with twostate neural networks except that two-state model has one more hidden node to make the number of free parameters comparable. A. Texture segmentation In this dataset we have 20 images which are generated with four different textures for background and five different textures for foreground. Eight of these images were used for training, two were used for early-stopping [4] which means the training stops by evaluating the performance of the network for these two images. The remaining images were used for testing. In this case, our networks have one hidden layer with 20 nodes and our series-ANN model has five stages. The radius of the stencil is five and the stepsize is 0.001. Figure 5a shows the output of each stage in the series for some test images. recision×Recall The average of F − value = 2×P P recision+Recall at zero threshold for outputs of stages are shown in Figure 3. This figure shows the improvement of the result with the stages. In addition, it can be observed that the proposed three-state series-ANN has better performance than the series-ANN using conventional two-state nodes; a 6.7% improvement in the testing F-value at zero threshold. It is important to
The rectangle dataset contains 30 images which were generated by creating rectangles with varying widths and heights, and adding some gaps in the rectangle sides and noise segments to images. Ideally, our classifier should complete the gaps on the side of the rectangles and remove the noise segments from the image. We trained the classifier with eight images, two images for early-stopping, and tested it with the remaining 20 images. In this case, each ANN had one hidden layer with five nodes, and the model has five stages. Again, the stencil radius was four and the stepsize was 0.001. Figure 5b shows the output between each network in the series for some test images. The average F-values between the two-state and threestate models can be compared in Figure 4. In this case, the proposed method shows 1% higher performance in the testing results. The improvement is smaller than previous case because rectangle completion is an easier task, and the classes are relatively well separated. However, in more complex problems where the two classes overlap significantly, such as in the texture segmentation, the advantage of our approach is more clearly noticeable. C. Horse segmentation We also examined our model for a realistic dataset. For this purpose, we randomly selected 25 images from the Weizmann horse segmentation dataset [3]. Ten images were used for training, two images for early-stopping and thirteen images for testing. In this experiment, we used three stages and each stage has one hidden layer with 20 nodes. Furthermore, the stencil radius was seven and step size was 0.0001. Figure 5c shows some examples of our test images and their segmentation
Input
Stage1
Stage2
Stage3
Stage4
Stage5
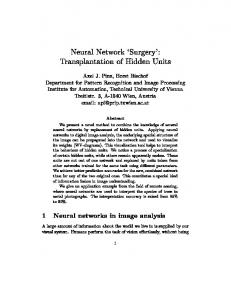
result images. For comparison, the F-value curves are shown in Figure 6, where it is noticeable a 6.5% improvement in the F-value at zero threshold using the proposed method compared to the two-state series-ANN. V. C ONCLUSION
(a)
Input
Stage1
Stage3
Stage5
Stage7
Stage8
(b)
This paper introduces an image parsing algorithm using three-state artificial neural networks in a series-ANN architecture. The proposed approach is based on the flexibility of three-state neural networks. The free state in these networks reduces the mean square error and allows the uncertainty propagation to next stages. Indeed, the free state in neural network leaves the decision about some samples for the next stages which leads to better decision making according to context information. We applied our method to three challenging image segmentation tasks. Simulation results indicate that the proposed method yields a higher image parsing performance. However, this method can also be used in other computer vision tasks. R EFERENCES [1] S. Belongie, J. Malik, and J. Puzicha. Shape matching and object recognition using shape contexts. IEEE Trans. on PAM, 24:509–522, 2002.
Input
Stage1
Stage2
[2] C. M. Bishop. Pattern Recognition and Machine Learning. Springer, 2006.
Stage3
[3] E. Borenstein, E. Sharon, and S. Ullman. Combining topdown and bottom-up segmentation. In Proc. IEEE workshop on Perc. Org. in Com. Vis., June 2004. [4] S. Haykin. Neural networks - A comprehensive foundation. Prentice-Hall, 2nd edition, 1999.
(c)
[5] V. Jain, J. Murray, F. Roth, S. Turaga, V. Zhigulin, K. Briggman, M. Helmstaedter, W. Denk, and H. Seung. Supervised learning of image restoration with convolutional networks. IEEE 11th ICCV, pages 1–8, Oct. 2007. Figure 5. Test results for the (a) texture segmentation, (b) rectangle completion, and (c) horse segmentation experiments. The first column shows the input image and the remaining columns show the output at different stages of the classifier. 0.8
[7] Y. Lecun, F. J. Huang, and L. Bottou. Learning methods for generic object recognition with invariance to pose and lighting. In Proc. of CVPR. IEEE Press, 2004.
0.75
0.7
Fïvalue
[6] E. Jurrus, A. R. Paiva, S. Watanabe, R. Whitaker, E. M. Jorgensen, and T. Tasdizen. Serial neural network classifier for membrane detection using a filter bank. Workshop on Microscopic Image Analysis with Aplication in Biology, September 2009.
0.65
[8] C. Meunier, D. Hansel, and A. Verga. Information processing in three-state neural networks. Journal of Statistical Physics, 55(5-6):859–901, June 1989.
0.6
twoïstate network(train) threeïstate network(train) twoïstate network(test) threeïstate network(test)
0.55
0.5
0.45
1
2
Number of Stages
3
Figure 6. F-values at different stages of the classifier in the horse segmentation experiment.
[9] A. Torralba, K. P. Murphy, and W. T. Freeman. Contextual models for object detection using boosted random fields. Proc. of NIPS, 2004. [10] Z. Tu and B. Xiang. Auto-context and its application to highlevel vision tasks and 3d brain image segmentation. IEEE Trans. on PAM, July 2009(in press).