Image Watermarking Using Spread Spectrum Technique in Log-2-Spatio Domain Peter H. W. Wong*, Oscar C. Au**, Justy W. C. Wong*** Department of Electrical and Electronic Engineering The Hong Kong University of Science and Technology Clear Water Bay, Kowloon, Hong Kong. Email:
[email protected]*,
[email protected]**,
[email protected]*** Tel.: +852 2358-7053** Abstract In this paper, we propose to embed the watermark information in the log-2-spatio domain by means of spread spectrum technique. In log-2-spatio domain, the variance of the information is reduced significantly. This improves the efficiency and robustness of spread spectrum technique. Low intensity and mid-band regions are selected to embed the information in order to guarantee an invisible watermark as well as the robustness to JPEG compression. Simulation results show that the embedded information still survive up to the JPEG compression ratio of 14.7.
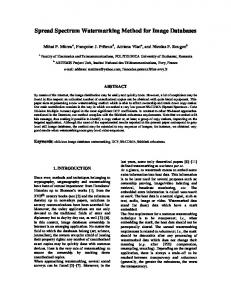
The watermark embedding process can be visualized in Figure 1.
1. SPREAD SPECTRUM TECHNIQUE Spread spectrum technique has been used for watermarking in [1]. For convenience, we use the same symbol defined in [1]. According to [1], to embed a bit sequence of m bits, the image is evenly segmented to m mutually exclusive regions. Each region responses to store one bit information. For example, if the length of the bit sequence is 4, the image will be segmented as shown in Figure 1. The jth bit of the bit sequence, represented by the symbol aj, is defined in eqn. 1:
Figure 1: Visualization of the embedding process
aj,
a j ∈ {− 1,1}
(1)
j ⋅ cr ≤ i < ( j + 1) ⋅ cr
(2)
The spread sequence is modulated with a binary pseudo-random sequence pi and amplified by a factor αj, yielding the watermark sequence wi: pi ,
pi ∈ {− 1,1}
wi = α j ⋅ bi ⋅ pi
(3) (4)
The watermark sequence is then added to the image vi, to create the watermarked image vˆ i : vˆ i = v i + α i ⋅ bi ⋅ p i
(5)
1
-1 1 1
The embedded bit can be decoded by simply compute the sign of the correlation sum between the watermark sequence and the corresponding pseudonoise sequence. The decoded jth bit, denoted by aˆ j , is compute by the following eqn. sj =
sj =
The symbol aj, is then spread by a large factor cr, called the clip rate, to obtain the spread sequence bi: bi = a j ,
1 -1 1 1
( j +1)⋅cr −1
( j +1)⋅cr −1
( j +1)⋅cr −1
i = j⋅cr
i = j⋅cr
i = j⋅cr
∑ pi ⋅ vˆi =
∑ pi ⋅ vi + α j ⋅ a j
∑
pi
2
(6)
( j +1)⋅cr −1
∑ pi ⋅ vi + α j ⋅ a j ⋅ cr
(7)
i = j⋅cr
aˆ j = sign(s j )
(8)
To decode the right information, the amplification factor αj need to be large enough so that the second term is larger than the first term in Eqn. 7 so as to ensure the decoded bit is the same as the embedded bit. However, a large αj implies low Signal-to-Noise ratio (SNR). As the amplitude of the embedded watermark is independent of the intensity of the pixels, the SNR can be very low for those pixels with low intensity. Moreover, if the watermark sequence is embedded in the regions with high frequency, the watermark may be removed after the compression process. As a result, the embedded bit sequence may not survive if the watermarked image is compressed at low bit rate. To solve this problem, we proposed to embedded the bit sequence in the log-2-spatio domain in the regions consisting mainly of mid-band frequency.
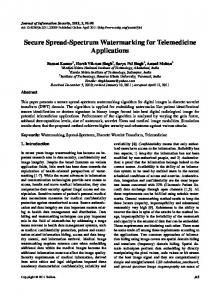
2. LOG-2-SPATIO DOMAIN The advantage of embedding the watermark in log-2spatio domain is to ensure the amplitude of the watermark depends on the intensity of the pixels. If the amplitude of the watermark depends on the intensities, the SNR will not be too low. We choose only the regions consisting mainly of mid-band frequency to embed the bit sequence. In the embedded process, a map is generated to describe the locations where the bit sequence will be embedded and the map is estimated in the decoding process. The procedures of the generation of the map and the estimation process at the decoder will be mentioned in next two sections. The embedding process of the bit sequence is visualized in Figure 2.
2 ()
Log 2 ()
Determine mid-band frequency and low intensity regions
One-bit map 1 -1 1 1
1
-1 1 1
Figure 2: Visualization of the watermark embedding process in log-2-spatio domain To transform the image to log-2-spatio domain, the intensity of each pixel in the spatio domain is passed to a log2 function. The result of the function is called the log-2-spatio domain intensity. Assuming the intensity range in the spatio domain to be [1,256] for common 8-bit image, the intensity range of the log-2spatio domain should be [0,8]. The watermarked sequence, is obtain by eqn. (9) and the pseudo-noise sequence, is chosen to be uniformly distributed within the [-0.0704, 0.0704] inclusively. The embedded jth bit, can be decoded according to eqn. 11 and 12. vˆi = 2
log 2 vi +α j ⋅bi ⋅ pi
α j ⋅bi ⋅ pi
= vi ⋅ 2
(9)
pi ∈ [− 0.0740,0.0704]
pi ,
(10)
( j + 1) ⋅ cr − 1
sj =
∑ p ⋅ log (vˆ ) i
2
i
i = j ⋅ cr
( j + 1) ⋅ cr − 1
=
∑ p ⋅ log (v )+ α i
i = j ⋅ cr
2
i
( j + 1) ⋅ cr − 1 j
⋅aj
∑p
2 i
(11)
i = j ⋅ cr
aˆ j = sign(s j ) (12) The pseudo-noise is chosen by the reason that in spatio domain, the pseudo-noise is uniformly
distributed within the range [0.95.1.05]. In other words, if the amplitude factor αj is equal to one, the absolute amplitude of the watermark sequence for any pixel is limit to 5% of the intensity of the pixel. 3. GENERATION PROCESS OF MAP IN THE EMBEDDING PROCESS As the embedded watermark should be invisible, not all the locations in the image can be used to store the watermark information. Since the noise is multiplied on the spatio domain of the image, it is visible when smooth bright regions are used to store the information. Moreover, in order to improve the robustness of the algorithm to JPEG compression, only the local regions with mainly mid-band frequency components are chosen. To ensure invisibility and robustness to JPEG compression, a one-bit map to locate where the bit sequence is embedded. The dimension of the one-bit map should have the same spatio resolution. The map is generated according to the following procedures: 1. The one-bit map consists of all zeros initially. 2. The image is filtered by a bandpass filter. 3. Each pixel in the bandpassed image is compared with a threshold T1. If it is larger than T1, the corresponding bit in the one-bit map is set to one. 4. Consider now the pixel intensity of the original image. If the intensity is between R1 and R2, then set the corresponding bit in the one-bit map to one. If this bit has been set to one in step 3, keep the value. 5. The one-bit map is lowpass filtered. Each location of the lowpassed map is compared with another threshold T2. If it is greater than T2, the location is used to embed the watermark information. The reason to lowpass filter the map is to ensure the watermark will not be embedded in small regions such as edges. 4. ESTIMATION OF THE MAP IN THE DECODING PROCESS As mentioned in previous section, only some regions of the image with low intensity and mid-band frequency are used to store the watermark. A one-bit map is created in the embedding process to indicate where to embed the watermark. In order to decode the correct bit sequence, the map is needed at the decoder. However, the cost to store or transmit the map is large and thus it is not a good choice. The map is estimated at the decoder prior to the decoding process mentioned in section 2. The following procedures are carried out to estimated the map: 1. The one-bit map is initially consists of all zeros. 2. The watermarked image is filtered by the same bandpass filter used in the embedding process. 3. Each pixel in the bandpassed image is compared with T1. If it is larger than T1, the corresponding location in the one-bit map is set to one.
4. Consider now the pixel intensity of the original image. If the intensity is between 0.95×R1 and 1.05×R2, then set the corresponding bit in the onebit map to one. If this bit has been set to one already in step 3, keep the value unchanged. 5. The one-bit map is lowpass filtered. Each location of the lowpass filtered map is compared with T2. If it is greater than T2, the location is used to embed the watermark information. 5. DETECTION OF THE WATERMARK In some applications, one is not interested in decoding the watermark correctly. Instead, one is interested in determining whether a given watermark is present in the image or not. Normally the normalized correlation (NC) is computed and compared with a threshold. When the watermark is present, the NC should be large. But if the watermark is absent, the NC should be low. However, when the watermarked image is compressed, the watermark may be distorted resulting in a smaller NC. The lower the bit rate, the more severe this situation will be. For the proposed SSTLOG, we define the NC as m ( j +1) cr −1
∑
NC =
∑ bi pi j =1 i = jcr m ( j +1)cr −1 A∑
∑
j =1 i = jcr
log 2 (vˆi ) (13)
(bi pi )2
where A is the average value of αj 1 m A = ⋅ ∑α j m j =1
(14)
6. EXPERIMENTAL RESULTS Two testing images ‘Lena’ and ‘Pepper’ were used in the simulation. The resolution of the testing images is 512x512. Only the luminance component is used. The bit sequence embedded in the images is 32-bits long in the simulation. The bit sequence is created by quantized a random noise sequence which is uniformly distributed between [0,1]. Figure 3 shows the original ‘Lena’. Figure 4 shows the watermarked ‘Lena’ using the spectrum technique (SST) and Figure 5 shows the watermarked ‘Lena’ using the proposed algorithm (SSTLOG). The Peak Signal-tonoise ratio (PSNR) of the watermarked images using the SST and SSTLOG are 37.84dB and 37.79dB respectively. All amplitude factors are scaled in the SST and SSTLOG embedding process in order to obtain similar image quality in terms of PSNR. The watermark is imperceptible using the SST and SSTLOG. The watermarked images are encoded with JPEG at various bit rates. The watermark decoding algorithm is applied to the JPEG-decoded images and checked for accuracy. The minimum bit rate of JPEG that still gives correct decoded watermark bit sequence is 1.42bpp for SST and 0.58bpp for SSTLOG. This shows that proposed SSTLOG can
survive significantly larger JPEG compression distortion than SST. Figure 6 shows the original ‘Pepper’. Figures 7 and 8 show the watermarked ‘Pepper’ using SST and SSTLOG respectively. The PSNR of watermarked images using SST and SSTLOG are 37.58dB and 37.54dB respectively. The minimum bit rate of JPEG that still gives correct decoded watermark bit sequence is 1.55bpp for SST and 0.95bpp for SSTLOG. Figures 9 and 10 show the minimum bpp needed in JPEG compression to decode the bit sequence correctly. The minimum bpp for SSTLOG is much lower than SST for both testing images. In other words, the SSTLOG is more robust to JPEG compression than SST. Figures 11 and 12 show the normalized correlation (NC) of various watermarks using the SST and SSTLOG respectively for ‘Lena’. It is observed that, while the NC of the correct watermark is about 0.8 in both SST and SSTLOG, the NC of the false watermarks are considerably smaller in SSTLOG than in SST. This implies a larger chance of correct watermark detection for SSTLOG. The NC for ‘Pepper’ are shown in Figures 13 and 14 for SST and SSTLOG respectively. Again the NC of the false watermarks are considerably smaller in SSTLOG than in SST implying a high probability of correct watermark detection. The watermarked images using SST and SSTLOG are compressed with JPEG at different bit rates. The NC of the correct watermark at different bit rate is shown in Figures 15 and 16 for ‘Lena’ and ‘Pepper’ respectively. It is observed that, as the bit rate decreases, the NC reduces more slowly in SSTLOG than in SST. This again suggests a larger probability of correct watermark detection in SSTLOG. 7. CONCLUSIONS In this paper, we propose to embed digital watermark in the Log-2-spatio domain using spread spectrum technique. Only regions with low pixel intensity and mainly mid-band frequency are selected to embed the watermark bits. Simulation results suggest that the proposed SSTLOG is more robust against JPEG compression than the traditional SST. The watermark bit sequence can be decoded correctly after the watermarked image is compressed at low bit rate. The proposed SSTLOG can also be used in watermark detection. Simulation results suggest that the NC of SSTLOG is better than the normalized correlation of the traditional SST. REFERENCES [1] F. Hartung, B. Girod, “Fast Public-Key Watermarking of Compressed Video”, Proc. of IEEE Int. Conf. Image Processing, vol. 1, pp-528-531, Oct. 97.
1
1
0.8
0.8
0.6
0.6
50
Norm aliz ed c orrelation
150
200 250
300
350
Norm aliz ed c orrelation
100
0.4
0.2
0.4
0.2
0
0
-0.2
-0.2
400
450 500 50
100
150
200
250
300
350
400
450
500
-0.4
-0.4 0
50
100
150
200
250 300 W aterm ark
350
400
450
500
50
100
150
200
250 300 W aterm ark
350
400
450
500
450
500
Figure 11 & 12: NC of correct and false watermarks for ‘Lena’ (left-SST, right-SSTLOG) 50
100
150
150
200
200
250
250
300
300
350
350
400
400
450
450
500
1
1
0.8
0.8
0.6
0.6 Norm aliz ed c orrelation
50
100
Norm aliz ed c orrelation
Figure 3: Original ‘Lena’
0.4
0.2
0.4
0.2
0
0
-0.2
-0.2
500 50
100
150
200
250
300
350
400
450
500
50
100
150
200
250
300
350
400
450
500
-0.4
-0.4 0
Figure 4 & 5: Watermarked image (Left-SST, rightSSTLOG)
50
100
150
200
250 300 W aterm ark
350
400
450
500
50
100
150
200
250 300 W aterm ark
350
400
Figure 13 & 14: NC of correct and false watermarks for ‘Pepper’ (left-SST, right-SSTLOG)
50
100
150
0.9 200
0.8
250
300
0.7 350
Norm aliz ed c orrelation
400
450 500 50
100
150
200
250
300
350
400
450
500
Figure 6: Original ‘Pepper’
0.6 0.5 0.4 0.3 0.2
50
50
100
100
150
150
200
200
250
250
300
300
350
350
400
400
450
450
500
500
0.1 0
50
100
150
200
250
300
350
400
450
500
0
1
2
3 B it per pix el
4
5
6
Figure 15: NC against JPEG bit rate for ‘Lena’ (Circle-SST, cross-SSTLOG) 50
100
150
200
250
300
350
400
450
500
0. 9
Figure 7 & 8: Watermarked image (Left-SST, rightSSTLOG)
M in. bpp for perfec t rec ons truc tion
1.8
1.6
1.4
0. 6 0. 5 0. 4 0. 3
1.2
0. 2
1
0. 1
0.8
0 0
0.6
0.4 35
36
37 38 39 P S NR of the waterm ark ed im age
40
41
Figure 9: Minimum JPEG bit rate for correct watermark detection against energy level of watermark in ‘Lena’ (Top-SST, bottom-SSTLOG) 2
1 .8 Min. b p p for pe rfe c t re c o n s tru c tion
0. 7 No rm a liz e d c o rre la tio n
2
0. 8
1 .6
1 .4
1 .2
1
0 .8
0 .6 34
35
36 37 38 39 P S NR of th e wa te rm a rk e d im a g e
40
41
Figure 10: Minimum JPEG bit rate for correct watermark detection against energy level of watermark in ‘Pepper’ (Top-SST, bottom-SSTLOG)
1
2
3 B it pe r p ixe l
4
5
6
Figure 16: NC against JPEG bit rate for ‘Pepper’ (Circle-SST, cross-SSTLOG)