Virtual colonoscopy (VC) is a patient-friendly alternative for colorectal endoscopic exami- ... With current virtual colonoscopy using a 2-sided view only 94% of.
Improved visualization in virtual colonoscopy using image-based rendering Iwo Serlie1,2, Frans Vos1,3, Rogier van Gelder4, Jaap Stoker4, Roel Truyen5, Frans Gerritsen5, Yung Nio4, Frits Post2 1
2
Department of Applied Physics, Delft University of Technology, Lorenzweg 1, 2628 CJ Delft, The Netherlands
Faculty of Information Technology and Systems, Delft University of Technology, Zuidplantsoen 4, 2628BZ Delft, The Netherlands 3
Department of Radiology, Erasmus University Medical Center, P.O. Box 1738, 3000 DR, Rotterdam, The Netherlands 4 Department of Radiology, Academic Medical Center, P.O. Box 22700, 1100 DE Amsterdam, The Netherlands
5EasyVision
Advanced Development, Philips Medical Systems Nederland B.V., P.O. Box 10.000, 5680 DA Best, The Netherlands
Abstract Virtual colonoscopy (VC) is a patient-friendly alternative for colorectal endoscopic examination. We explore visualization aspects of VC such as surface in view, navigation and communication of a diagnosis. A series of unfolded cubes presents an animated full 360-degree omnidirectional field-of-view to the physician, to facilitate thorough and rapid inspection. For communication between physicians a tool has been designed that uses image-based rendering. Clinical evaluation has shown a reduction in inspection time from 28 minutes to 12 minutes without loss of sensitivity. With current virtual colonoscopy using a 2-sided view only 94% of the surface is available for exploration. In our approach the surface in view is increased to potentially 100%. Thus, the entire colon can be explored with better confidence that no regions are missed.
1 Introduction Colon cancer is the second cause of cancer deaths in the Western world [1]. Early detection of colonic polyps has proven to lead to a decrease in incidence [2]. However, the traditional technique for detection and removal of polyps, optical colonoscopy, causes serious discomfort. In the past few years, virtual colonoscopy (VC) has been developed as a more patient-friendly screening alternative [4][5][6]. In general, the VC procedure consists of the following stages. First, the patient’s colon is cleansed and inflated with air. Next, a 3D image volume of the abdomen is acquired using CT imaging. The bowel surface is then extracted from the volume and visualized in a way similar to camera colonoscopy. Finally, the physician navigates through the virtual colon and examines the surface for abnormalities from intra-luminal perspective. The last step may take as long as 30 minutes. For practical application, virtual colonoscopy must meet general requirements
regarding:
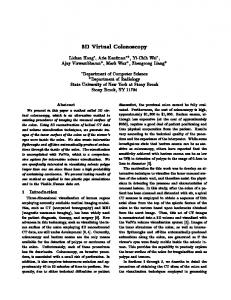
• efficiency (time spent by the radiologist) • effectiveness (part of the surface area in view) • sensitivity (number of polyps detected) Due to the data size and quality requirements inherent to medical imaging, realtime rendering is not yet feasible. Commonly, this problem is solved by generating flythrough sequences off-line, using forward and backward viewing directions in an attempt to enlarge the observable part of the surface. This approach still yields selective imaging of the inner surface. It may well be however that important parts of the surface are missed, while insignificant parts are reviewed twice (Figure 1). In addition, the inspection/navigation is restricted by the central path through the colon. invisible surface
polyp
Figure 1. Surface parts missed in two sided views.
Identified polyps can be removed by the endoscopic surgeon. For proper communication of the diagnosis to the surgeon it is required that properties of detected polyps such as their location, size and appearance be reported. So-called panoramic views have been considered to solve the described missed surface parts. Such an approach implies folding out the colon, and spreading the inner wall on a flat plane, so that the full inner surface is exposed for examination. To do this, several techniques are described in the literature, ranging from simple cylindrical coordinate transforms, to complex conformal mappings [7][8]. The cylindrical transformation produces excessive distortions, while local geometry is much better preserved in a conformal transformation. We are not aware of any work on tools for communication of diagnosis. In this paper, a number of visualization aspects from virtual colonoscopy will be analyzed. We will introduce a novel visual representation. A series of unfolded cubes presents an animated full 360-degree omnidirectional field-of-view to the physician, to facilitate a more thorough and rapid inspection. Consequently, almost the entire colon surface is visible for examination. For annotation and communication of a diagnosis, a tool has been designed using a selected series of views that are generated by imagebased volume rendering. To test our technique, a clinical evaluation study has been conducted. The paper is organized as follows. In Section 2.1, we will review image-based rendering, and its use in virtual colonoscopy. Subsequently, we will consider the visible part of the surface and navigation aspects (Section 2.2). In Section 2.3 we will discuss
the communication of a diagnosis. Results including the clinical evaluation will be presented in Section 3. Finally, the paper will draw conclusions and describe suggestions for future work.
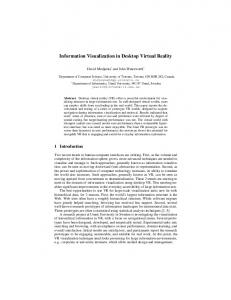
2 Methods 2.1 Image-based rendering The common approach to image generation in virtual endoscopy is by rendering of polygonal iso-surfaces extracted by the marching cubes algorithm [9]. Alternatively, direct perspective volume rendering of the acquired CT volume can be used [9][11] as in this study. To acquire fast rendering speed needed for screening purposes, concessions are often made to quality and scene complexity. An alternative approach to the classical type of scene modeling is provided by image-based rendering [12][13]. Image-based rendering is an approach in which prerendered (or captured) images are used to compose a virtual scene. The scene is modeled by a collection of intermediate images, which are used to generate different views. The images are warped in real time to simulate camera panning and zooming. Thus, rendering time does not depend on the complexity of the scene, but is only determined by the number of intermediate images and their resolution. As a more formal description, consider the 5-dimensional function describing the intensity and chromaticity of light observed from every position and direction in space. For a single viewpoint, this so-called plenoptic function is reduced from 5 to 2 dimensions. As a result, the environment viewed from a fixed position is represented by a 2dimensional map, which can be projected on the surface of a virtual viewing space. The camera is placed at the center, and the images are projected on the walls of the viewing space. In this way the plenoptic function is reconstructed. It appears as if one is immersed in the original scene. Typical examples of viewing spaces are a cylinder, a sphere, or a cube. We have used a cubic mapping, with the viewpoint at the center, and on each face an image is projected with a 90-degree viewing angle, to cover the full omnidirectional projection of the scene. The six images are warped in such a way that the pixel grid appears regular for each view, regardless of the viewing direction, and no irregularities appear at the edges or corners of the cube. The VRML language [14] allows the modeling of an image-based scene description using a cube. Rendering this representation consists of generating six images, volume rendered in perspective (Figure 2), and texture mapping these images on the faces of the viewing cube. In general, a limited amount of disk space and main memory is needed for reconstruction and archiving such a cubic representation. Consequently, image-based rendering gives the opportunity to communicate information via a low-bandwidth network and displayed using standard software on a low-end PC. Real-time interactive exploration is supported, but the full environment is not visible in a single view, and the user has to look around to inspect the whole scene. From visual perception research
Figure 2. Image based rendering using a cubic environment map.
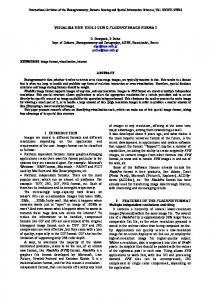
it is well known that active exploration leads to better information transfer. Therefor, it is desirable that visualization of the environment is invariant to the orientation of the camera. 2.2 Visible surface, orientation/navigation Increasing the viewing angle enlarges the amount of surface inspected. However, this approach goes at the expense of increased distortions towards the edges of the rendered image. Clearly, at an angle of 180 degrees, half the scene is projected onto the viewing plane, but the distortion at the edges goes to infinity (see Figure 3).
Figure 3. The distortion near the edges increases with a larger viewing angle (the images are
rendered at 90, 120 and 140 degrees). An approach to increase the visible surface area is by unfolding the cubic viewing space introduced in 2.1, and project all six images onto a single plane for simultaneous inspection. Small images are added to resolve discontinuities. We present such a visualization to the physician as an animated image sequence (Figure 4). In Section 3 we will study the increase in surface visibility using this method. The sequence is generated from a limited set of points sampled on the central path through the colon. For obtaining this central path we refer to [16]. However, it may be that surface areas are still invisible. We have developed a technique to identify the invisible parts, and to allow these parts to be inspected from a different viewpoint, so that potentially 100% of the surface can be examined. 100% is achievable if new views are created for partly invisible surface features as small diverticula. Invisible regions of the surface are determined given a central path and camera
Figure 4. A sequence of outfolded cubes is presented to improve efficiency
geometry. Our algorithm proceeds in two stages. Initially, the voxels of the colonic surface are extracted; these must satisfy the following conditions:
• Inner faces of surface-voxels must closely follow the tissue-air interface. • At least one face of surface voxels must be potentially visible from any interior viewing position.
• The surface may not contain holes. The colon's interior volume is obtained by a thresholding of the image volume, and region growing from the centerline. Then, the surface is identified by the voxels with faces adjacent to the interior. Finally, a dilation of the grown object(s) is performed, with the restriction of 6-connectivity. The contour added as a result of the latter operation contains the surface with an edge connectivity property. Next, the visibility of a voxel is determined by ray-casting from all viewpoints to the center of all potentially visible voxel faces. If another surface voxel intersects this ray, the voxel face is invisible (Figure 5). The visible voxels are expressed as a percentage of the total number of surface voxels. Because only a small percentage of the colonic surface is not visible using the cubic viewing space, which part is in most cases restricted to a few areas, we can calculate a number of extra viewpoints to resolve the invisible patches. As such surface elements often appear in clusters, a hierarchical clustering is performed. For every cluster the center is projected on the surface. Using the surface normal, a new viewing
Figure 5. The surface voxel visibility test. position is determined. When it is not possible to generate a viewing position at a large enough distance from the cluster, a cutting plane is used, to allow the viewpoint to be located outside the colon’s interior. Figure 6 illustrates these alternative views.
Figure 6. Generated alternative views of invisible surface parts. Besides using the centerline as a camera path, we facilitate navigation by some additional resources. For easy orientation, the normal to the central image in the unfolded cube (Figure 4) is always parallel to the path tangent at the current location. In addition, an overview image shows the current global position in the colon (top right in Figure 4). Finally, we designed a mode in which two reformatted slice views allow easy exploration of the original CT data (bottom right). Both images are generated automatically when the user clicks in the unfolded cube. The center of the two images is determined by projecting the selected point on the colon wall (Figure 7). The first image is perpendicular to the path where it is closest to the selected position. The second, orthogonal cross-section is parallel to the centerline tangent. The physician can scroll interactively through these images and rotate them for closer inspection of suspicious areas. 2.3 Annotation and communication of a diagnosis Previously, we argued that image-based rendering uses only a limited amount of resources (memory/disk space). Moreover, generally available tools such as VRML can be used for viewing the 3D image-based scenes, also remotely via the internet. Thus, a practical way to communicate a diagnosis is by way of image- based render-
Figure 7. Two planar images are centered at a selected position: perpendicular and parallel to the tangent in the nearest pathpoint.
ing. A similar approach is described in [17] for mere exploration of bronchial data. We have implemented the communication as follows. Once a polyp has been identified, the radiologist can create a ’diagnosis record’. Such a record contains a small series of unfolded cubes that are saved as JPEG image files. Any annotations (e.g. measurement of polyp size) are just pasted in the images (see figure below). Additionally, the overview image as well as the multiplanar reformats are stored. The latter images are created in the manner described above for each path point and also for the clicked positions. A typical record requires approximately 10 Mb of disk space. For review by the endoscopic surgeon we created a tool in VRML. Running the code in a web browser such as MS Internet Explorer requires a simple plugin module such as the Cosmo Player. Figure 8 shows a typical view. The physician can move forward and backward along the central path and interactively look around. For orientation one may refer to the overview image or to the reformatted views.
8 mm
Figure 8. Typical view of our tool for communication of a diagnosis.
The exploration is implemented in VRML by transformations applied to the cube. Movement along the path only requires loading new images to be pasted on the walls. When looking around, the cube is rotated. The user is hardly aware of such transformations because the camera is centered at the position from where the cube textures were rendered. Only extremely small artefacts may become visible near the edges where pixels referring to objects in scene space are sqrt(2) larger than the central pixels. The resulting deformation is invisible as long as the texture sampling is above the Nyquist limit. The tool was tested on a 550 MHz Pentium III processor using 320 MB of main memory and equipped with an HP Visualize fx graphics board. For movement along
the path the frame rate was 5 Hz, while rotations for looking around could be done in real time (24 Hz).
3 Clinical evaluation Any virtual endoscopy system must meet requirements of efficiency, effectiveness and sensitivity (Section 1). For testing on these aspects, data from 20 patients visiting the Academic Medical Center Amsterdam is used. An informed-consent procedure was followed, in which the main patient inclusion criterium was the referal for conventional colonoscopy. For these patients 3D image data were acquired by computed tomography (CT) in supine and prone position. Subsequently, each patient underwent optical colonoscopy. Identified polyps were resected and their size, location and morphology were annotated to define the ground truth. In 10 patients 15 colonic polyps were identified with optical colonoscopy. 10 patients did not contain polyps. The resulting 40 sets of 3D-image data were retrospectively examined by one radiologist using a ‘conventional’ virtual endoscopic method as well as the unfolded cube method. Both methods were implemented on an experimentally enhanced version of the EasyVision Endo-3D software package (Philips Medical Systems). The more conventional tool displayed forward and backward movies that had been created offline. The viewing angle was set to 120 degrees. During exploration the radiologist could stop at any position and change the camera orientation and position for local inspection of the surface. In addition, axial slices of the CT data-volume could be examined. The unfolded cube system was used as described in Section 2.2. (Figure 9 shows typical consecutive views).
Figure 9. Three consecutive views (http://www.ph.tn.tudelft.nl/~iwo).
Table 1 collates the mean time spent on reviewing the conventional and unfolded cube sequences (both patient positions are considered individually). The difference between paired sequences is significant (P