Metodološki zvezki, Vol. 7, No. 1, 2010, 1-16
Influence of Outliers on Some Multiple Imputation Methods Claudio Quintano, Rosalia Castellano, and Antonella Rocca1
Abstract In the field of data quality, imputation is the most used method for handling missing data. The performance of imputation techniques is influenced by various factors, especially when data represent only a sample of population, for example the survey design characteristics. In this paper, we compare the results of different multiple imputation methods in terms of final estimates when outliers occur in a dataset. Consequently, in order to evaluate the influence of outliers on the performance of these methods, the procedure is applied before and after that we have identified and removed them. For this purpose, missing data were simulated on data coming from sample ISTAT annual survey on Small and Medium Enterprises. MAR mechanism is assumed for missing data. The methods are based on the multiple imputation through the Markov Chain Monte Carlo (MCMC), the propensity score and the mixture models. The results highlight the strong influence of data characteristics on final estimates.
1
Introduction
It is well known that survey results are affected by errors arising from several sources. Among them, one dangerous effect could be introduced by unit and item nonresponse with the consequence that these last could produce bias and distorsions of distributions.
1 Department of Statistics and Mathematics for Economic Research, University of Naples “Parthenope”, Italy;
[email protected]
2
Claudio Quintano, Rosalia Castellano, and Antonella Rocca
While total or unit non responses are usually treated through weighting techniques, partial or item non responses are usually imputed, that is substituted with plausible values. Many of the currently used imputation techniques rely on the hypothesis that missing values are “Missing At Random” (Rubin, 1987; Schafer, 1997)2. More methods of imputations have been proposed and the choice is often related to the particular data characteristics and to the goal of imputation. In fact, when data represent only a sample of population, imputation techniques should be finalized to produce accurate target estimates for valid inferences, so reducing the contribution of non sampling error on the total error. In other cases, otherwise, the predictive accuracy could be the most important objective. Moreover, the decision involving the choice of methods for the analysis of survey data with nonresponse commonly adopted by analysts is critical in presence of outliers. In this paper, we work on the testing ground of ISTAT annual Small and Medium Enterprises, Arts and Profession Survey dataset. It’s a sample survey based on a complex survey design; as it is well known, business variables present skewed distributions; thus outliers issues are important to examine for good estimations and inferences (Eltinge and Cantwell, 2006). The purpose of this paper is twofold. The first one is to verify the performance of target estimates of three different multiple imputation methods well-known in the literature: the first one through the SAS Proc MI for multiple imputation (SAS, 2002), using the Markov Chain Monte Carlo (MCMC); the second one is based on the propensity scores (Rubin, 1997, 2006) and the third one on a mixture of models (Di Zio and Guarnera, 2007). The second aim is to evaluate the sensitiveness of these three multiple imputation methods with and without outliers. Then, once identified and removed outliers, through a procedure described in Di Zio, Guarnera, Luzi and Tommasi (2007), the application of the previous methods of multiple imputation is repeated and the final estimates obtained are compared with the previous ones. Our object is then to verify the changes in the final estimates produced when outliers have been removed from the dataset, with reference to the imputation methods applied and to two different variables for which missing data have been simulated, whose distributional characteristics are rather different. Some evidence could be certainly extended and be of some interests for other analyses.
2 Nonresponse behaviours identified in literature are: 1) Missing Completely At Random (MCAR), when the fact that a certain item is missing does not depend on the missing nor the observed data; 2) MAR, in the case the nonresponse mechanism is random conditional on the observed covariates; 3) MNAR, if the nonresponse mechanism depends on observed data. The first one is often an unrealistic assumption, especially in business surveys. In this work, MNAR mechanism has not been followed because the imputation methods applied rely only on an ignorable missing data mechanism. Besides, in the Small and Medium Enterprises survey missing data have been simulated on personnel costs and sales that are strongly connected with other variables as number of employees, utilized in the MAR mechanism.
Influence of Outliers on Some Multiple Imputation Methods
3
The plan: in Section 2 the problems related to outliers are briefly described. Section 3 gives a description of how outliers make more difficult the imputation methods implementation. A briefly review of multiple imputation methods and a discussion of the results of simulation study before and after removing outliers are presented in Section 4 while in Section 5 some conclusions are reported.
2
The outliers and the imputation methods in data quality frame
Among non-sample errors, the impact on estimations and inferences is drawing not only from classical non-responses but also from outliers and then to their contemporary presence, very frequent in surveys. Outliers are units that deviate from a specified data model. When they correspond to real values (in the sampled part of population), they are called representative outliers because they are correctly surveyed. The others, derived from errors in sample data caused by deficiencies in survey processing, are non representative outliers (Chambers and Ren, 2003). While non-representative outliers are detected and corrected during the survey editing process, representative outliers must be handled in the survey estimation process by some specific procedures; in fact, if the statistician has to distribute the dataset for public use, outliers have to be replaced. First of all, because they could let units identification (that for privacy must be preserved); in addition, because they make statistical analyses inaccurate and inferences derived from them not very robust. Even though, it is important to highlight that in any data analysis representative outliers are to be considered because they represent units correctly measured. Moreover, applying imputation methods, in presence of outliers, it is possible that the model underlying the imputation technique remains influenced by these data irregularities, so that imputed values can considerably deviate from non observed values (Di Zio, Guarnera, Luzi e Tommasi, 2007; Elliot, 2006). In fact, imputation methods replace missing data with values estimated through a mechanism according to the assumptions generating missing data. Using the values of the covariates involved in the MAR assumption, the outliers present different values from the other ones also in a multivariate perspective. In other words, when we apply imputation methods in a dataset containing outliers, the imputation performance could be excessively influenced by outliers, producing values too far from the real values and invalid estimates 3. 3 Eltinge and Cantwell (2006) consider for outliers identification the Yi values of a finite population as the sum of two terms z i , and d i , generated by a superpopulation model, where z i represents an underlying “smooth” long term trend in the true values Yi and d i an “irregular” or “temporary disturbance” term in Yi . They propose to make separately analyses and inferences on these two components.
4
Claudio Quintano, Rosalia Castellano, and Antonella Rocca
We expect that good models, able to take into account data irregularities, could be influenced by outliers also for estimating the remaining part of observations that are not outliers. These problems are particularly evident in business statistics. Most business variables, in fact, as firm size indicators, turnover and number of employees have positively skewed distributions.
3
Outliers treatment and sampling in survey design
In treating outliers, literature has focused attention principally on statisticalmathematical properties of identification methods and estimators, ignoring other important aspects, as a range of objective functions that include measures like variance and mean squared error, as well as other functions tuned to reduction of risks associated with very rare extreme observations and estimates. Other important elements are information available on the underlying populations of interest, cost structures and some important constraints on production systems and modification thereof (Eltinge and Cantwell, 2006). In complex survey designs, outliers can also derive from: i) units with a low probability selection from population and, thus, which are associated with a large estimation weight; ii) units with a very large weight due to problems with stratum jumping, that occurs when a unit, initially assigned to a stratum on the basis of its characteristics, during the survey results in another stratum for effect of changes occurred in time. The outliers detection is not easy in complex survey designs and in multivariate contexts it is hard to identify them but it is also possible that some observations are erroneously considered as outliers (the so called masking and swamping effects, respectively). Outliers may be univariate or multivariate; multivariate outliers are observations appearing to be inconsistent with the correlation structure of the data. Moreover, Di Zio, Guarnera and Luzi (2003) suggest a mixture model to formally state the problem in a multivariate context, providing also a number of useful diagnostics for prioritising doubtful units possibly containing potentially influential errors.
4
SME survey: the simulation results with missing data and outliers
In order to compare the capacity of different methods to produce valid reconstructions, we have generated a percentage of 30% of missing data on medium enterprises of services sector of ISTAT dataset of the annual sample
Influence of Outliers on Some Multiple Imputation Methods
5
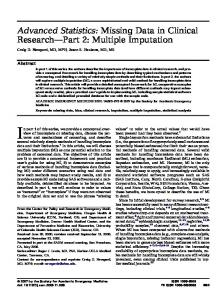
survey on Small and Medium Enterprises, Arts and Professions (2,242 units have been considered extracted from the 62,241 enterprises of 2005 survey)4. It’s a complex survey, with a single-stage stratified sample; units selection is with equal probabilities, where the strata are defined by the link of “sector activity classes”, “employees classes” and “Region”. The adopted stratification is the minimum partition of population that produces estimate domains as elementary strata aggregation 5. Variables considered in this analysis are: number of employed persons and the accounting items of sales, total revenues, total costs and personnel costs. Owing to the marked positively skewed distributions of these variables, multiple imputation methods were applied to their logarithmic transformation (Figure 1). 1.a – Natural scale distribution.
1.b– Logarithmic scale distribution.
Figure 1: Number of employed persons, total costs, sales, personnel costs referred to the 2,242 enterprises extracted from ISTAT Small and Medium Enterprises survey, with 2099 employed of services economic sector. Marginal distributions. Source: Authors’ ad hoc processing on data of ISTAT Small and Medium Enterprises, Arts and Professions Survey (2009).
4 In literature, there are a lot of simulation works and practical examples (Nordholt, 1998; Madow, Nisselson and Olkin, 1983). From them, we can derive a different behaviour regarding the choice of the data percentage, artificially set to missing. In other words, there is no agreement on the “right” simulated percentage, but it is diffused the idea that it depends on the specific survey characteristics. About this problem see Quintano, Castellano and Romano (1996). In many cases, it has been stressed that a low percentage of missing data in unable to highlight differences in imputation methods performance (Shrive, Stuart, Quan and Ghali, 2006) while when the amount of missing data is quite high (>50%) the use of classical imputation methods could be dangerous (Kovar and Whitridge, 1995). Consequently, in this paper, the missing data percentage has been of 30% taking into account of the Istat experience in business surveys, where non response for some relevant variables is around the 30%. 5 This type of allocation makes possible to extract the sample in survey planning, determining sample allocation fixing a priori the expected accuracy levels of estimates on the interested domains, so to assure estimated accuracy for the different required levels. Besides, an over-sampling is realized to take into account the high death rate of microenterprises (Siesto, 2006).
6
Claudio Quintano, Rosalia Castellano, and Antonella Rocca
Variables for which missing data were simulated are: sales and personnel costs. They are both skewed to the right, but after the logarithmic transformation sales may be considered roughly normally distributed. Also variability is very high for both variables, as shown by the coefficient of variation, that is equal to 1.31 for personnel costs and even to 2.83 for sales. The simulation procedure is based on MAR mechanism assumption, where influential covariate is the number of employed persons that, as sales, is a firm size indicator and supposes a major tendency to non response for micro enterprises 6. These three variables are positively correlated each others, especially, of course, the number of employed persons and the personnel costs.
4.1
The imputation techniques and the results
The multiple imputation techniques applied are based on Markov Chain Monte Carlo (MCMC), on propensity scores procedure, both realized through the SAS Proc MI, and on a mixture model. They constitute a wide diversified range of alternatives for partial non response treatment. The MCMC method is frequently applied and, in presence of missing data, it allows, through simulations, to draw the joint posterior unknown quantities of distribution and the posterior parameter estimates. Assuming that data have a multivariate normal distribution, Data Augmentation algorithm is applied to Bayesian inference with missing data by repeating the following steps (SAS, 2002): The imputation I-step: with the estimated mean vector and covariance matrix, the I-step simulates the missing values for each observation independently. Denoting with Yi,mis the variables with missing values for observation i, and with Yi,obs the variables with observed values, the I-step draws values for Yi,mis from a conditional distribution Yi,mis given Yi,obs. Then at t th iteration (Yuan, 2002): t
t +1 is drawn from (Y mis |Y obs ,θ ) Ymis
The posterior P-step: simulates the posterior population mean vector and covariance matrix from the complete sample estimates: t +1 θt+1 is drawn from p(θ|Yobs, Ymis ) 1 2 , θ 2 ), … that converges in distribution to , θ1 ), ( Ymis creating a Markov chain: ( Ymis p(Ymis, θ|Yobs).
6 Some studies in literature have highlighted that it is a plausible hypothesis (Rogelberg and Stanton, 2007; Willimack and Nichols, 2001). Furthermore, through the multiple imputation methods it is possible to obtain unbiased estimates only under MAR mechanism.
Influence of Outliers on Some Multiple Imputation Methods
7
A burn-in of 200 iterations, 200 iterations between each step and five imputations are used. The propensity score is the conditional probability of assignment to a particular treatment given a vector of observed covariates and it is generated for each variable with missing values to indicate the probability of that observation being missing. The observations are then grouped based on these propensity scores, and an approximate Bayesian bootstrap imputation is applied to each group. When data have a monotone missing pattern, the following steps are followed to impute values for each variable Y j with missing values (Rubin, 1997; Statistical Solutions, 2001)7: 1. Create a variable R j with the value 0 for observations with missing Yj and 1 otherwise. 2. Fit a logistic regression model of: 3. logit(pj )= β 0 +β 1 Y1 +β 2 Y2 + … +β (j–1)Y(j–1) (4.1) 4. where p j =Pr(R j =0|Y1 ,Y2 ,…,Y(j–1)) and logit(p)=log(p/(1–p)) 5. Create a propensity score for each observation to indicate the probability of its being missing 6. Divide the observations into a fixed number of groups based on these propensity scores 7. Apply an Approximate Bayesian bootstrap imputation to each group that consists in the following steps: in group k, denoting with Y obs the n1 observations without missing and with Y mis the n 0 observations with missing in Y j , approximate Bayesian bootstrap imputation first draws n1 observations randomly with replacement from Y obs to create a new dataset Y obs*; this latter is used to draw randomly the n 0 values for Ymis. A monotone pattern is obtained through the application of MCMC of SAS Proc MI, that generates 5 different datasets. Then, on these last a step of imputation through the propensity scores is applied. Mixture model is a semi-parametric imputation technique particularly suitable when normality distribution assumption is not respected also after logarithmic transformation. They represent a particular flexible imputation method, suitable for any data functional form and, consequently, sensitive to outliers. With this method, density functions were fitted considering each observation to be a realization of a specific but unknown component k of the mixture connected with a latent variable Z k , taking values in {0, 1, …, K} with z i =k if the individual i belongs to group k and 0 otherwise.
7 When data have a different pattern of missing data, a MCMC imputation step must be applied before to make data pattern monotone. Then, the imputed values derive in a few of cases from the MCMC application that have corrected the pattern to make it monotone.
8
Claudio Quintano, Rosalia Castellano, and Antonella Rocca
Let Y={Y1 , …, Yn } be a random sample of n units, where Yt is a qdimensional random vector with probability density function f(yt ) on R q and yt its realization: f(yt )= ∑ π k f k K
k =1
( yt )
(4.2)
where f k (yt ) is the mixture density component of each population k and πk the kth population weight, with 0 ≤ πk ≤ 1 and Σ k πk =1 (Picard, 2007). We refer to Gaussian mixture models, that represent a particular flexible imputation method, suitable for any data functional form and, consequently, sensitive to outliers and chosen by Di Zio and Guarnera (2007). The choice of the number of mixtures considered has been based on a procedure finalized to maximize the BIC 8. It has chosen 3 clusters. We used a burn-in of 100 iterations, 100 iterations between each step and 300 as maximum number of iterations for convergence. Sample strata have not been considered in the clusters formation, because we have preferred that they were formed directly by the implemented procedure. According to each imputation method, to test their performance, 100 simulations and an identical number of multiple imputation processes (m x 100 imputations) were performed. The indicators calculated to test the accuracy of the adopted methods are based on the bias and on the width of the confidence interval calculated around the estimate whose extreme values are: ˆ ±t 0,025;m–1 1 + 1 B s m
sQ
(4.3)
where s Qˆ is the parameter estimate in the s th simulation; m is the number of datasets considered in the multiple imputation technique; 1 (Qˆ − Q )2 is the between-imputation variance in the sth simulation; sB = m −1
∑
i
t 0,025;m–1 is the theoretical value of t-Student distribution, with m–1 degrees of freedom and α=0.05.
8
( )
( )
It is the Bayesian Information Criterion, given by: 2 L Φ ˆ K − υ K log n , where L Φˆ K is the log-likelihood function based on the n observations, Φ ˆ K is the maximum likelihood estimate for the k-components model and ν k is the number of independent parameters to estimate. It represents a criterion to obtain a compromise between model adequacy and parsimony, minimizing the possibility of data over-fitting. It is then calculated subtracting from likelihood, that increases with the number of functions approximating data distribution, a term that is proportional to the number of parameters to estimate.
Influence of Outliers on Some Multiple Imputation Methods
9
The parameters estimated are mean (Table 1), median 9 (Table 2) and variance (Table 3)10. With reference to mean estimation, the most accurate performance, as regards all the indicators, are connected with the traditional MCMC method of SAS Proc MI, based on the data normality hypothesis. The second best method is the mixture model for both sales and personnel costs. The estimates calculated are more accurate for this latter variable even if the index “cnt” shows percentages around 50%11. Indeed, for sales, the percentage of parameter inclusion in the confidence interval with the propensity scores method is of 93%, that is a satisfactory result, similar to that of the other two methods, that have overestimated the inclusion capacity of 2 and 4 percentage points. The relative confidence interval width for personnel costs is of 14% while for the mixture model method is of 9% and for the MCMC method is of 8%12. Furthermore, for sales the relative bias with the propensity scores method is only of 6%, but for the others two methods is of 1% and 5‰, respectively. Table 1: Bias, Root Mean Square Error, confidence interval width for the estimation on mean population calculated as mean in the 100 simulations of missing data. Absolute and relative values. Absolute measures Method
BIAS
Sales 49,066 Mi 530,103 Pro 98,454 Mix Personnel costs 38,680 Mi 73,483 Pro 42,397 Mix
MSE
WIDTH
BIAS
Relative measures WIDTH
MSE
CNT(*)
75,558
76,905
0.0055
0.0923
0.0559
97
705,807
3,268,981
0.0598
0.2821
0.3685
93
195,643
1,162,468
0.0111
0.1485
0.1310
99
47,653 92,540 55,674
76,905 136,358 89,261
0.0400 0.0796 0.0439
0.2220 0.3094 0.2400
0.0795 0.1410 0.0923
48 37 63
Source: Authors’ ad hoc processing on data of ISTAT Small and Medium Enterprises, Arts and Profession Survey (2009). Legend: Mi : MCMC method; Pro : propensity scores method; Mix : mixture model method. ˆ s Q is the parameter estimate in the s th simulation;
9 This latter is a more robust synthetic measure and it is better for distributions including various outliers. Note that sample median is an unbiased estimator of the population mean; for large samples, it is roughly normally distributed with expected value of µ, but with variance greater than sample mean variance (Cicchitelli, Herzel and Montanari, 1992). Population median estimate is usually based on a cumulative distribution function, on its inverse and on a complex procedure for variance estimate of median estimator (Woodruff, 1952). Nevertheless, for variance imputation B, it was not necessary to use this complex procedure. 10 Quality indicators at micro-level have not been calculated because the comparison among the multiple imputation methods has been based on distributional accuracy. 11 Predictability would be maximum, in terms of parameter inclusion in the interval calculated around the estimate, if it was around 95%. In fact, if it was more elevated, it would over-estimate the estimator variance, with confidence intervals too many large, that, for this reason, include, more than it would be, the parameter value. 12 Finally, even if we have reported as estimative factors both the width of confidence intervals and the index that counts in percentage how many times the parameter is included in the interval, we retain that the most important indicator of a good estimate is a smaller width of the confidence interval, because, in a no-simulative scenario, it produces a major accuracy.
10
Claudio Quintano, Rosalia Castellano, and Antonella Rocca
~ Q is the parameter value, calculated on the original dataset, before missing data simulation; 100 100 ~2
∑ ( s Qˆ − Q )
∑ (s Qˆ − Q )
~
bias =
s =1
100
;
s =1
RMSE= Root Mean Square Error =
100 − 1
width = confidence interval width = upper bound – lower bound
∑ ( s Qˆ − Q ) 100
100
relative bias=Biasrel =
s =1
~ Q
~ ∑ ( s Qˆ − Q ) (100 − 1)
100
~
; relative RMSE =
s =1
2
~ Q
~ relative width = (upper bound–lower bound)/ Q cnt = counter that shows, in percentage, on the 100 simulations, how many times the parameter value is included in the confidence interval calculated around the estimate.
Table 2: Bias, Root Mean Square Error, confidence interval width for the estimation on median population calculated as mean in the 100 simulations of missing data. Absolute and relative values. Method
BIAS Sales Mi Pro Mix
Absolute measures WIDTH
6,460 141,663 42,982
Personnel costs 31,181 Mi 71,891 Pro Mix 35,310
MSE
76,022 219,958 167,053 43,627 81,092 48,854
BIAS
Relative measures WIDTH
MSE
CNT(*)
443,257 677,010
0.0021 0.0460
0.1570 0.2671
0.1438 0.2197
96 97
540,174
0.0139
0.2328
0.1753
95
157,675 127,659
0.0418 0.0964
0.2419 0.3298
0.2115 0.1713
96 46
132,422
0.0474
0.2560
0.1776
88
(*)
It’s a counter that shows how many times the population parameter, in the 100 simulations, is included in the confidence interval. Source: Authors’ ad hoc processing on data of ISTAT Small and Medium Enterprises, Arts and Profession Survey (2009).
The median estimates are in general more accurate, even if, considering relative indicators, part of this improvement is lost. Confidence interval width for median estimate is in many cases wider than the one derived for the mean. With reference to relative measures again, passing from mean to median estimates, propensity scores performance are improved for sales estimates while those concerning personnel costs make things worse with longer confidence intervals. However, for median, the percentages of coverage are higher than for mean estimates. These results confirm only partially Di Zio and Guarnera (2007) ones, that show good performance for the MCMC method only when the aim is mean estimate while for median estimate more sophisticated methods, like the mixture model, are preferable. The reason of this divergence arises probably from the
Influence of Outliers on Some Multiple Imputation Methods
11
different data characteristics used by the Authors in terms of data normality, distributional variability and incidence of outliers. Table 3. Bias, Root Mean Square Error, confidence interval width for the estimation on variance population calculated as mean in the 100 simulations of missing data. Absolute and relative values. Method
Absolute measures BIAS
Sales Mi Pro Mix
1.43396E13 -3.377668E13
MSE
Relative measures BIAS
1.1555408E14
-0.0158
0.1433
0,1277
98
4.3180737E14 3.3195122E13
-0.0373 -0.0014
0.2824 0.0641
0,4772 0,0367
96 99
577154817044
-0.0199
0.0368
0,1682
92
795298840078
0.0001
0.1919
0,2318
97
722934398916
-0.0207
0.2096
0,2107
96
MSE
WIDTH
CNT(*)
WIDTH
1.85946E+13 7.21585E+13
-1.253477E12 3.71971E+12
Personnel costs -6848610693 Mi Pro
1.26349E+11
222134244 1.39876E+11
Mix
-7118106684 1.50698E+11
Source: Authors’ ad hoc processing on data of ISTAT Small and Medium Enterprises, Arts and Profession Survey (2009).
At last, with reference to the width of mean and median confidence intervals, we can say that they are close enough, even if they are wider for median than for mean, but the consistent percentage of intervals in which the parameter is not included, with reference to mean estimate for personnel costs, highlights the bias sensible influence on results. As regards the variability preservation imputed variables’ distributions (Table 3), we see that the method based on the mixture model presents the most accurate estimates when the imputation concerns the sales while for personnel costs, even if the accuracy of estimates is very similar to the methods compared, the smallest bias is obtained with the propensity scores technique.
4.2
An evaluation of multiple imputation methods on dataset cleaned by outliers
The particular data characteristics, with strong variability, remarkably skewed on the right and with outliers, has suggested the repetition of the analysis on dataset cleaned by outliers. In fact, comparing the previous results with these last ones, we can verify how much outliers influence the quality of estimates. The detection of outliers is based on a complex procedure, whose principal criteria have been connected with the removal of all the units with null values in at least one of the considered variables (in total 8 units) and of units with outliers in at least one of the analyzed variables. For their identification, we have considered
12
Claudio Quintano, Rosalia Castellano, and Antonella Rocca
both univariate and multivariate outliers that is outliers identified considering, besides the marginal variables distributions, also the inconsistencies with correlation structure of the data (Di Zio, Guarnera, Luzi and Tommasi, 2007). Through this procedure, the 5% of total units has been identified as outlier and removed. Repeating multiple imputation procedure on this smaller dataset and comparing the results with the previous ones, we note a significant improvement in the estimation, especially for the mixture model, both for mean and median estimation (Table 4)13. Table 4: Bias, Root Mean Square Error, confidence interval width for the estimation on mean population calculated as mean in the 40 simulations 14 of missing data calculated on dataset cleaned by outliers. Relative values. Method Sales MI PRO MIX Personnel costs MI PRO MIX
BIAS
MSE
WIDTH
CNT(*)
–0.0064 –0.0226 –0.0005
0.0860 0.1676 0.0469
0.0322 0.1183 0.0129
95 94 96
–0.0067 –0.0389 –0.0079
0.1082 0.2015 0.1149
0.0557 0.0737 0.0597
95 43 97
(*)
It’s a counter that shows how many times the population parameter, in the 37 simulations, is included in the confidence interval. Mi : MCMC method; Pro : propensity scores method; Mix : mixture model method. Source: Authors’ ad hoc processing on data of ISTAT Small and Medium Enterprises, Arts and Profession Survey (2009).
In particular, for sales, that after the logarithmic transformation has an almost symmetric distribution, but also a great variability, bias, RMSE and width decrease in a considerable manner, being always under the 10% of the corresponding obtained before. Also the performance of the propensity scores method results to be improved in a significant manner, with mean measures around the 35% of the preceding. Less sensible the improvement of MCMC performance. Rather different is the sensibility of the multiple imputation methods to the outliers removal for personnel costs. This latter, whose values are strongly dependent from the number of employees, that is here limited to 20-99, is then less interested by the outliers. In fact, with reference to personnel costs, the MCMC method also after the robustification process presents the best results, with a sensible reduction of the bias, but very similar performance are reached by the mixture model method. The simulations highlight the considerable complexity of the matter, not suitable to simple generalizations. The outliers removal gives certainly a significant contribution to the improvement of estimates’ accuracy for all the
13
The results for median, here not reported, fully confirm these statements.
Influence of Outliers on Some Multiple Imputation Methods
13
imputation procedures, but the degree of this improvement depends not only by the distributional characteristics of data, but also by the different influence that outliers have on the various imputation methods. Outliers removal exerts a strong influence on methods based on the mixture model; in this case, besides the performance improvement, there is a remarkable reduction of computational efforts. In fact, when outliers are removed, the optimal number of mixtures of distributions suggested by the BIC is lower, generally equal to 2 while before, to fit also the outliers, it was equal to 3. The remarkable reduction of the number of cases for which the parameter is included in the confidence interval calculated around the estimate for personnel costs, with reference to propensity scores method when compared with the other methods, probably derives from its nature of donor method. In fact, even if it adopts the Approximate Bayesian Bootstrap method for imputation values selection, it produces an under-estimate of variability. Moreover, the highest bias of estimates, in comparison with the other two methods, and the widest confidence intervals imply a less percentage of confidence intervals including the parameter value. This situation is referred especially to personnel costs, that has a more skewed distribution and a lower variability than sales.
5
Conclusions
Results from statistical analysis highlight how the specific data characteristics influence the results. The outliers play a crucial role on the performance of the imputation methods. In fact, when outliers occur in a dataset, the mixture model high flexibility can produce a deviation from the real data pattern, caused by its major capacity to well-fit the data. Propensity scores technique highlights an underestimate of variability even if it realizes a proper imputation. Then, the choice of the imputation method must be taken with respect to the principal scope of the analysis. If it consists in the estimate of a mean parameter, valid results can be obtained with simple methods, too. Nevertheless, when other aspects assume a great importance, as the preservation of distributional data characteristics, more sophisticated methods are to be privileged. The results could represent a useful hint for further analyses on business data, for which non response and outliers are a consistent problem. In other words, although the specific simulation results are always influenced by the particular data characteristics, the evidence in this paper could be of some interests for business surveys producers and users and similar contexts.
14 The estimates are based precisely on 37 simulations because in three cases on the 40 simulations the algorithm has not converged.
14
Claudio Quintano, Rosalia Castellano, and Antonella Rocca
Acknowledgement This paper was supported by the 2008 Endowment Funds of the Department of Statistics and Mathematics for Economic Research of University of Naples “Parthenope” in the framework of the research on “Data Quality” and starts from the Ph.D. thesis of Rocca (2009) in Statistics Applied to Territory. The same fund has financed the off-prints.
References [1] Carpenter, J.R., Kenward, M.G., and Vansteelandt, S. (2006): A comparison of multiple imputation and doubly robust estimation for analyses with missing data. Journal of the Royal Statistical Society. Series A., 180, 571-584. [2] Chambers, R.L. and Ren, R. (2003): Outlier Robust Imputation of Survey Data. American Statistical Association. Section on Survey Research Methods. [3] Cicchitelli, G., Herzel, A., and Montanari, G.E. (1992): Il campionamento statistico. Bologna: il Mulino. [4] Di Zio, M. and Guarnera, U. (2007): On multiple imputation through finite gaussian mixture models. Data Analysis, Machine Learning and Applications. Proceedings of the 31st Annual Conference of the Gesellschaft für Klassifikation e.V., Albert-Ludwigs-Universität Freiburg, March 7–9, 2007, SpringerLink. [5] Di Zio, M., Guarnera, U., and Luzi, O. (2003): Using mixture modelling to deal with unity measure error. Conference of European Statistician. Work Session on Statistical Data Editing. Madrid: 20-22 October. [6] Di Zio, M., Guarnera, U., Luzi, O., and Tommasi, I. (2007): Detection of potentially influential errors in statistical survey data. Presented at Intermediate Conference of Italian Statistical Society. Specialized Session: Venice. [7] Elliot, M. (2006): Multiple imputation in the presence of outliers. The University of Michigan School of Public Health. Paper series, 59. [8] Eltinge, J.L. and Cantwell, P.J. (2006): Outliers and influential observations in establishment surveys. Federal Economic Statistics Advisory Committee. [9] ISTAT (2009): I conti economici delle imprese, anno 2005. Settore IndustriaServizi. Collana Informazioni, 8. [10] Kovar, J.G. and Whitridge, P.J. (1995): Imputation for business survey data. In Cox, B.G., Binder, D.A., Chinnappa, B.N., Christianson, A., Colledge, M.J., and Kott, P.S. (Eds.): Business Survey Methods. New York: Wiley. [11] Madow, W.G., Nisselson, H., and Olkin, I. (1983): Incomplete Data in Sample Survey. London: Academic Press.
Influence of Outliers on Some Multiple Imputation Methods
15
[12] Meng, X.L. and Rubin, D.B. (1993): Maximum likelihood estimation via the ECM algorithm: A general framework. Biometrika, 80, 267-278. [13] Nordholt, S.E. (1998): Imputation methods, simulation experiments and practical examples. International Statistical Review, 66, 157-180. [14] Picard, F. (2007): An introduction to mixture models. Statistics for Systems Biology. Research Report, 7, http://genome.jouy.inra.fr/ssb/ . [15] Quintano, C., Castellano, R., and Romano, A.A. (1996): L’imputazione delle mancate risposte nelle indagini con parte panel. Il caso dei redditi familiari della Banca d’Italia, Quaderni di Discussione n. 10, Istituto di Statistica e Matematica, Facoltà di Economia, Istituto Universitario Navale, Napoli, Rocco Curto ed. [16] Rocca, A. (2009): Rilevazioni complesse e qualità dei dati economici: un’applicazione dell’imputazione multipla all’indagine sulle PMI. Ph.D. thesis, Department of Statistics and Mathematics for Economic Research: University of Naples “Parthenope”. [17] Rogelberg, S.G. and Stanton, J.M. (2007): Understanding and dealing with organization survey nonresponse. Organization Research Methods, 10, 195209. [18] Rubin, D.B. (1987): Multiple Imputation for Nonresponse in Surveys. New York: Wiley. [19] Rubin, D.B. (1997): Estimating causal effects from large data sets using propensity scores. Annals of Internal Medicine, 127, 757-763. [20] Rubin, D.B. (2006): Discussion on multiple imputation. International Statistical Review, 71, 619-625. [21] SAS v. 8.1 (2002): SAS Worldwide Headquarters, SAS Campus Drive Cary, NC 27513-2414, USA. http://www.sas.com. [22] Schafer J.L. (1997): Analysis of Incomplete Multivariate Data. Washington: Chapman & Hall. [23] Shrive, F.M., Stuart, H., Quan, H., and Ghali, W.A. (2006): Dealing with missing data in a multi-question depression scale: A comparison of imputation methods. Medical Research Methodology. [24] Siesto G. (2006) (Ed.): Valutazione delle possibilità di uso di dati fiscali a supporto della Rilevazione PMI, Documenti ISTAT, n. 17, with the contribution of Branchi, F., Casciano, C., Di Francescantonio, T., Falorsi, P.D., Filiberti, S., Marsigliesi, G., Sansone, U., Santi, E., Sanzo, R. and Zeli, A. [25] Statistical solutions (2001): Solas v. 3.0 (software for missing data analysis). 8 South Bank, Crosse’s Green, Cork, Ireland, http://www.statsol.ie. [26] Yuan, Y.C. (2002): Multiple Imputation for Missing Data: Concepts and New Development. SAS Institute Inc.: Rockville, MD.
16
Claudio Quintano, Rosalia Castellano, and Antonella Rocca
[27] Willimack, D.K. and Nichols, E. (2001): Building an alternative response process model for business surveys. Proceedings of the American Statistical Association. August 5-9, 151-156 [28] Woodruff, R.S. (1952): Confidence intervals for medians and other position measures. Journal of the American Statistical Association, 47, 635-646.