Integration of dynamic pricing and overselling with opportunistic cancellation Mohammad Modarres
[email protected] Ehsan-Bolandifar
[email protected] Department of Industrial Engineering, Sharif University, Tehran Abstract We extend the concept of dynamic pricing by integrating it with overselling with opportunistic cancellation option, within the framework of dynamic policy. Under this strategy, to sell a stock of perishable product (or capacity) two prices are offered to customers at any given time period. Customers are categorized as high-paying and low-paying ones. The seller deliberately oversells its capacity if high paying customers show up, even when the capacity is already fully booked by low-paying customers. In that case, the sale to some low-paying customers is canceled, although an appropriate compensation must be provided. A dynamic programming approach is applied to formulate and solve this problem. We develop two models for continuous and periodic pricing, depending on the frequency of price changing. The advantage of this system over dynamic pricing model is investigated through some numerical examples. We also study some structural properties of the optimal policies. Key words: Dynamic Pricing; Overselling; Opportunistic Cancellation; Dynamic programming. 1. Introduction The generic model of dynamic pricing, introduced by Kincaid and Darling [10], is applicable in a variety of industries, especially perishable items producers. It can enhance the revenue of the firms which produce either manufactured goods with short shelf life (such as seasonal goods) or service products (such as flight seats). In dynamic pricing, the
price of a given product changes within some sale horizon in order to maximize the total revenue earned. This is done by determining the optimal trade-off between two types of potential losses, losing the chance of a better price in future because of selling at a lower price now, losing the opportunity of an earlier low price offer or in other words the spoilage loss-waiting to sell at a higher price. The concept of overselling with opportunistic cancellation was proposed by Biyalogorsky et al. [1] for the first time. In their model, each unit can be sold in either period 1 (now) or period 2 (later). In the first period, the customers are offered two options: Buy the product at the lower price with a cancellation right by the seller, i.e., giving the seller the right to cancel the sale for some compensation. Buy the product at the higher price without the cancellation right by the seller. In the second period, only the higher price is proposed, based on the assumption that the late customers are willing to pay higher prices (technically speaking, they have higher reservation price). This model shows that overselling with opportunistic cancellation can increase profits and improve allocation efficiency. Biyalogorsky et al. [1] also derived a new rule to optimally allocate the capacity to customers when overselling is used. They also showed that overselling helps limit the potential yield and spoilage losses. 1.1. Problem Definition In this paper, we introduce an integration of dynamic pricing and overselling with opportunistic cancellation. It is assumed a given number of units of a product (or capacity) is available to sell within a finite time horizon. Demand for this product is stochastic and depends on the time of sale as well as its price. Products or capacities left unsold at the end of the sale horizon have the salvage value of zero. We develop two models, depending on whether price changing is continuous or periodical. Unlike dynamic pricing models which offer only one price in each sale period, in our proposed model customers have two price options. On the other hand, in the model of Biyalogorsky et al. [1], although two prices are offered, these prices are unchanged during the sale horizon, while in our model price can change in each sale period. In fact, the higher price is controlled dynamically. From this point of view, our model fits within the framework of dynamic pricing concepts. We also investigate the efficiency of the integrated dynamic pricing system (when the overselling with opportunistic cancellation option is considered.) This is done through the comparison of a dynamic pricing system with and without overselling option. Some structural properties of the optimal policies are also derived to get managerial insights into the problem of product or capacity pricing. Our second model considers periodic pricing policies when overselling with opportunistic cancellation is considered. The numerical experiments show that by making
5 to 10 reviews it can be expected to have a difference of less than 1% between the expected revenues in our two models. For a thorough discussion of dynamic pricing models in revenue management, the readers are referred to Bitran and Caldenety [4] and Elmaghrabi and Keskinocak [7]. Structural properties of optimal policies in classical dynamic pricing models is studied by Gallego and Van Ryzin [8], Bitran and Mondeschein [3], Zhao and Zheng [15] and Chatwin [6]. Considering a homogeneous demand model that assumes the demand intensity to be a time-invariant function of price, Gallego and Van Ryzin [8] proved the following structural properties of the optimal policy with one price: concavity of the expected revenue function, inventory monotonocity (at any given time, the optimal price decreases in the number of items left. Bitran and Mondschein [3] and Zhao and Zheng [15] proved the inventory monotonocity and concavity of the expected revenue function with a demand model employed by Kincaid and Darling [10]. Chatwin [6] showed that the concavity and inventory monotonocity properties hold when the price set is discrete, in a model similar to the model of Zhao and Zheng [15] with the assumption that the customer arrival rate decreases in time. Bitran and Mondeschein [3] considered periodic pricing policies when a single price is offered to customers and it can be modified at most K times during the sale horizon and the length of each period is also given. There is another type of pricing models studied more extensively, known as multiclass yield management models. In these models, one can sell some products (for example seats in an airline flight) with different prices at the same time due to market segmentation. These models can be classified into two categories of static and dynamic ones. In static models, it is assumed that the customers who arrive earlier are willing to pay the lowest possible price. This type of yield management models were studied first by Littlewood [11], see Brumelle and McGill [5] and Robinson [12] for a thorough literature review of static models. In dynamic models, a customer can buy one or more classes (not only the lowest class) based on his reservation price, which depends on the time of the sale. For a discussion of these models, one can refer to Lee and Hersh [9], Bitran and Mondschein [2] and Subramanian et al [14]. The remainder of this paper is organized as follows. In Section 2, the first model in which price can change continuously is introduced and some of its properties are discussed. Periodic pricing model is presented in Section 3. We illustrate the proposed models through some examples in Section 4. Finally in Section 5, some directions of future research and conclusion are given. 2. Continuous pricing model A stock (or capacity) of C units must be sold within a time frame, called sale period or sale horizon. The value of any stock unit which is not sold during that period will be zero afterwards. The total sale period is divided into T discrete intervals, called pricing periods. These periods are indexed by t and run backward in time, i.e. period t 0 represents the end of sale period, i.e., no more chance for the sale of the product.
It is assumed that at most one customer may arrive in each period. The probability of arrival in period t is denoted by t , t 0, T . 2.1 Reservation price The maximum amount that a customer is willing to pay for purchasing one unit is called the reservation price of that customer. Obviously, a customer purchases only if his reservation price is higher than the price set by the seller. On the other hand, since different customers have different reservation prices, the reservation price of arriving customers is a random variable. Let Ft (.) denote the cumulative probability distribution of the reservation price of the customers who arrive to purchase one unit in period t . Then, the definition of reservation price implies that the probability that an arriving customer refuses to purchase (because of the price), is Ft ( pt ), where pt is the price set in period t .
2.2 Pricing policy In each period, the firm offers two prices p and p , where p p. The first price p must be chosen from a set of possible prices, called S p . Every member of S p is higher than p . Customers have the option of accepting either p or p , which obviously depends on their reservation price. If a customer accepts the higher price of p , then the purchased unit is delivered (or allocated) to him immediately. This customer is called type I. However, the other customers (type II) who accept the lower price of p have to wait till the end of sale horizon ( t 0 ). Then, the remaining stocks not purchased by type I customers are delivered to the customers of type II. Any type II customers who has placed an order but not received the stock at the end of sale horizon will be refunded and also be paid a penalty of r. Due to the uncertainty of stocks delivery to the customers of type II, some of them refuse to place orders, even if their reservation price is higher than p . The probability that a customer of this type with the reservation price higher than p accepts this price and waits till the end of sale period is . At the end of the sale horizon, the firm would deliver the purchased units to the customers of type II, if it could not find enough customers of type I. If pt and pt' are set for the pricing period of t , then the definition of reservation price implies that the probability of any purchase by a customer of type I and II are (1 Ft ( pt )) Ft ( pt ) and ( Ft ( pt ) Ft ( pt' )) , respectively. The objective is to control the type I price of p dynamically in order to maximize the expected profit of the firm (total selling revenue minus the total penalty paid to the customer of type II.) The maximum number of units (out of C units of stock) that can be offered to the customers of type II is C , provided there are not enough customers of type I. Obviously, from the optimization point of view it is appropriate to set C equal to C and let the model assign to each type of customers. However, usually the management may be willing to restrict the maximum number of units sold to the customers of type II.
2.3 Dynamic Programming approach We apply dynamic programming technique to obtain the optimal solution of this problem. The elements of the dynamic programming model are defined as follows. (c, c ) : state of the system, where c and c represent the number of available stocks at the beginning of the this pricing period for type I and II customers, respectively, ( c includes c ). It is assumed that c c ' and c 0 . Otherwise, the solution is trivial. Vt (c, c ) : maximum expected revenue generated from period t till the end of sale horizon, if the state of the system is (c, c ) . Vt (c, c , p ) : maximum expected revenue generated from period t till the end of sale horizon, if the state of the system is (c, c ) and p is the proposed price for the customer of type I in period t. Then, the recursive equation for period t is as follows. Vt (c, c ) max{ t Ft ( p) ( p Vt 1 (c 1, c )) Vt 1 (c 1, c 1)) t ( Ft ( p ) Ft ( p )) ( p p Sp
(1 t Ft ( p ) F ( p ))) Vt 1 (c, c ) t ( Ft ( p ) This recursive equation can be expressed as follows Vt (c, c ) max{ t Ft ( p) ( p Vt 1 (c, c )) t Ft ( p )( p c
p Sp
where,
c
c
Vt 1 (c, c ))} Vt 1 (c, c ) (1)
Vt 1 (c, c ) and Vt 1 (c, c ) can be interpreted as the opportunity cost of c
one stock unit sale to customers of types I and II, respectively. The boundary conditions are V0 (c, c ) (c (C c )) ( p r ), if c C c else. 0, and Vt (0, c ) (C c ) ( p r ) for t 0, T (2) As mentioned before, a penalty of r is paid to the customer of type II, if the purchased units are not delivered. 2.4 Concavity property The following theorem is applied to investigate the concavity of the expected revenue function as a function of initial inventory. This property is useful for determining the optimal capacity of type I, when the proliferation cost of capacity is linear or convex. Theorem1. Vt (c, c ) is concave in c for any fixed t and c , if Proof: see Appendix 1.
1, r
0.
2.5. Monotonocity property We use the concavity property of the expected revenue function to examine the inventory monotoocity property of the pricing policy with respect to c .
Theorem2. For any given t , type I price p is a non-increasing function of c , if Vt (c, c ) is concave in c . Proof: We must show that if p1
p 2 and Vt (c, c , p1 ) Vt (c, c , p 2 ) then,
Vt (c 1, c , p1 ) Vt (c 1, c , p 2 ) . By definition, 0 Vt (c, c , p1 ) Vt (c, c , p 2 )
(t )( Ft ( p1 ) p1 Ft ( p2 ) p2 ) ( Ft ( p2 ) Ft ( p1 )) Vt 1 (c, c ) c
(t )( Ft ( p1 ) p1 Ft ( p2 ) p2 ) ( Ft ( p2 ) Ft ( p1 )) Vt 1 (c 1, c ) c
Vt (c 1, c , p1 ) Vt (c 1, c , p 2 ) The concavity property of the expected revenue function implies that, Vt 1 ( c , c ) Vt 1 (c 1, c ) . c
c
3. Periodic pricing with more than one customer in each period The purpose of this section is to extend the first model by reviewing the price periodically. Furthermore, the arrival of more than one customer in each period is also possible. This model is more practical than the previous one because each price change is costly and thus firms are not willing to do it often. Thus, it is preferable to revise prices periodically and not continuously during the sale horizon. In this model, the price structure is the same as in the previous one. During the sale horizon, the type II price ( p ) is determined at the beginning of the sale horizon by the firm and remains unchanged afterwards. The price of type I, p, as well as the maximum number of capacity that can be sold to the customers of type II must be controlled dynamically by the model. The price of type I is selected from a set in every period. Prices do not change within a period. On the other hand, because of the penalty paid at the end of the sales horizon, the sales to the customers of type II must be limited. 3.1. Problem definition Let N be the number of times that price can be modified during the sales horizon. For notational convenience, we use reversed time index; i.e. N indicates the first pricing period while 0 indicates the end of sale horizon. It is assumed that the number of arrivals follows a nonhomogeneous Poisson process with arrival rate of t . Thus, more than one arrival in each period is possible. Let mi ( p k ) and mi ( p k ) be the average purchase rate of type I and type II during the ith pricing period, respectively, if p and p are set for this period, then by definition (see Ross [13], p. 24) we have:
Ti
Ti
mi ( pk )
t Ti
(1 Ft ( pk ))dt and mi ( p k )
t Ti
1
( Ft ( p )
Ft ( p k )) dt
1
where, Ti is the starting time of the ith pricing period. Let X ij ( p k ) indicates the number of stock units purchased by the j th type customers during the ith sales period. If p and p are set for this period, then Pr{ X i1 ( p k ) j} exp( mi ( p k )) mi ( p k )^ j / j! Pr{ X i 2 ( p k )
j} exp( mi ( p k )) mi ( p k )^ j / j!
The distribution of reservation price in period t is represented by Ft (.) . Then, following this notation the probability of purchasing by customers of type I and II are Ft ( p )) and Ft ( p )) , respectively, where p and p are the price of one t (1 t ( Ft ( p ) stock unit for customers of types I and II, respectively. In this model, the policy is to limit the maximum number of capacity units sold to the second type customers to bi . 3.2. Stockout period At the beginning of a period, let the state of the system be (c, c ) and the demand of type I during that period exceeds c. Then, the process stops after the arrival of cth customer of type I and there will be no more stock for any other of customers afterwards. In that case, the orders of all customers of type II placed before this event are canceled and these customers will be refunded. To estimate the expected total amount of refund and penalty, it is necessary to determine the distribution of the number of customers of type II who have placed order before the stock out. Lemma 1. Let P (l | c1 , j , k ) denote the probability of selling l units of the capacity to the customers of type II before the stock out, given the beginning stock is c1 and the total number of demand for the customers of type I and II within that period are j and k , respectively. Then, j ! k !(c1 l 1)!( j k c1 l )! P(l | c1 , j, k ) (3) ( j k )!l !(k 1)!(c1 1)( j c1 )! Proof: Since the number of events (arrival of either type of customers) follows Poisson process and the number of events during the period is given, then it is proven that the arrival time of each customer within that period is uniformly distributed. On the other hand, there are (l ) customers of type II and (c1 1) customers of type I before the stock out. Therefore, the total number of possible events before the stock out is: (l c1 1)! l c1 1 . Cl l !(c1 1)!
C
Similarly, the total number of possible events after the stock out is other hand, the total number of possible events during that period is l c1 1
P (l | c1 , j , k ) = C l
C
C
j k k
j k l c1 k l
. On the
. Therefore,
j k l c1 k l
C
j k
.
k
3.3 Dynamic programming model Similar to the previous model, we apply stochastic dynamic programming to determine p as well as the sale limit to the customers of type II. Let define, Vi (c, c , p, b) : the maximum expected revenue generated from period i till the end of sale horizon, if the state of the system is (c , c ) and p is the proposed price for the customer of type I in this period and b is the maximum number of available second type capacity in period i . For i th pricing period we have: bi
c1 1
Vi (c, c ', p, b)
Pr{ X i1 ( pk )
j} [
j 0
Pr{ X i 2 ( p k )
Pr{ X i 2 ( pk )
k } ( jpk
kp
Vi 1 (c1
j , c2 k ))
k 0
bi )} ( jp k
bi p
Vi 1 (c1
j, c2
bi )]
Pr{ X i1( p k )
j} [
j c1 k
Pr{ X i 2 ( pk ) k 0
k} (
P (l | c1 , j , k ) (c1 pk
min(l , bi ) p
Vi 1 (0, c2 min(l , bi )))] (4)
l 0
In each pricing period we have: Vi (c1 , c2 ) max{Vi (c1 , c2 , pk , bi } pk ,bi
(5)
This dynamic programming formulation can be solved backward in time periods. The boundary conditions are the same as in (2). 4. Illustrated Examples In this section, first we present two examples to illustrate the effect of variation of different parameters on the optimal value of the expected profit as well as on the optimal price. Furthermore, we compare the expected profit earned from the following modes. Dynamic pricing model integrated with overselling with opportunistic canceling (Hereafter, it is called OS1 if price is reviewed continuously and OS2 if it is reviewed periodically) Dynamic pricing model (proposing only one price at any time), called benchmark model Then, we also investigate the efficiency of our models through 2000 randomly generated examples by comparing the optimal values of the expected profit from OS1 with
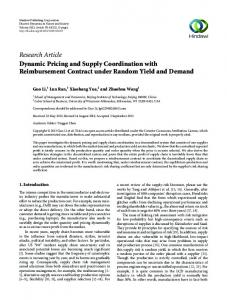
that of the same models when the concept of overselling with opportunistic cancellation is not considered. 4.1 Example 1 Consider a firm has to sell its inventory within a period of 30 days. Customers arrive in period t according to a non-homogenous Poisson process with the rate of t t / 15 . The price set for type I customer, called p , is selected from a given set of S p {11,12,..., 24, 25} , while the price for type II customer, called p , is unchanged during all periods and is set equal to 10. If a customer pays p , he receives one unit of stock immediately. However, if he pays p , he has to wait till the end of sale horizon. Furthermore, it is possible that he does not receive his purchased unit, if enough stocks are not available at the end of sale horizon, due to the excessive demand by type I customers. We assume the firm pays a penalty of r=2 in addition to p to any type II customer who 0.5 and the firm wants to sell at most 5 does not receive the purchased unit. Suppose units of capacity to the customers of type II, i.e. C 5 . The reservation price of customers has a uniform distribution within the interval of 0,30 . Comparison of the optimal price of OS1 and the benchmark model In Figure1 the optimal starting price for the customers of type I is plotted versus the optimal price of the benchmark model. As this figure shows the optimal starting price of this type in OS-1 model is higher than (or equal to) the optimal price of the benchmark model. Furthermore, this difference increases with respect to the initial capacity units. It is not so hard to justify the outcome of this observation. In dynamic pricing models, in order to attract the customers who are not willing to buy expensive items, the firm gives them another option by proposing a lower price. However, in OS1 model these customers are distinguished from the others and thus it is possible to propose a higher price for the customers of type I. 26
24
22
The first model
18
The benchmark model
Price
20
16
14
12 1
3
5
7
9
11
13
15
17
19
initial capacity
Figure 1. The Price path based on initial capacity
Comparison of expected revenue of OS models with that of the benchmark model. Figure 2 shows the incremental percentage of the expected revenue of OS1 model versus that of the benchmark model. This shows that the expected revenue increases up to 13% if overselling with opportunistic cancellation option is considered. Again, in this case, the difference increases with respect to the initial capacity units. By proposing a second price, the spoilage loss can also be decreased. On the other hand, the yield loss also can also be decreased by proposing higher prices to type I customers. Therefore, it seems logical to have higher expected revenue. Price change during the sale period In Figure 3, the price path through the sale horizon for the fixed capacities of 10 and 15 are depicted for both OS1 and benchmark model. Clearly, the price decreases in these models with respect to time. However, the rate of decrease in type I price in OS1 model is less than that in the benchmark model with one price. The result of this observation seems logical, because in order to sell the available stocks in OS1 model there is no need to decrease the price quickly, when the existence of a second price decreases the possibility of having unsold capacity (spoilage loss) at the end of the sale horizon. 14%
Expected revenue improvement
12%
10%
8%
6%
4%
2%
0% 1
3
5
7
9
11
13
15
17
19
Initial capacity
Figure 2. incremental percentage of the expected revenue of OS1 versus that of the benchmark model
22 21
Price
20 19
The benchmark model wirh inventory 10
18
The first model with inventory 10
17 16
The benchmark model with inventory 15
15
The first model with inventory 15
14 13 12 30
25
20
15
10
5
Days to the end of sale period
Figure 3. Price path through the sale horizon
The effect of type II price We study the effect of type II price on the path of type I price, as well as on the optimal value of the expected profit as a function of the initial capacity. As Figure 4 shows an increase in type II price results in increasing of type I price. On the other hand, as Figure 5 indicates, the optimal value of the expected profit also increases with respect to type II price, provided that the initial capacity is low. However, this is not necessarily true for higher inventories. 26
24
22
20 Price
5 10
18
15 16
14
12 1
3
5
7
9
11
13
15
17
19
Initial capacity
Figure 4. The Price path based on initial inventory for different second prices
4.2 Example 2 In this example we study the behavior of the second model (periodic review) of dynamic pricing model with the option of overselling and periodic review. As mentioned before, in this model the arrival of more than one customer in each sale period is possible. Consider Example 1 again. To reduce the costs and efforts of price change, only two price reviews is scheduled during the sale horizon, at beginning of the eleventh and twenty first days of the sale horizon. The arrival of the customers has a non-homogeneous Poisson distribution with the rate of t t / 15 where t represents the remaining time to the end of the sale horizon. Other assumptions of example1 hold in this example too. In Figure 6, the difference between the expected revenues of two examples is plotted. It indicates that the maximum difference between these two models is equal to 1.5%. The difference between two models decreases with respect to the initial capacity. According to our numerical experiments, when the number of reviews increases, this difference decreases. By making 5 to 10 reviews, it is expected that the difference between two models drop to less than 1%. 260 240
Expected Revenue
220 200 5 180
10 15
160 140 120 100 5
7
9
11
13
15
17
19
Initial capacity
Figure 5. The expected revenue based on initial inventory for different second prices 1.6%
Expected revenue improvement
1.4% 1.2% 1.0% 0.8% 0.6% 0.4% 0.2% 0.0% 1
2
3
4
5
6
7
8
9
10 11 12 13 14 15 16 17 18 19 20
Initial capacity
Figure 6. Percentage of difference between the expected revenues of OS1 and OS2 models
4.3 Randomly generated samples We examined our first model, OS1, (continuous review) through 2000 randomly generated samples. In these examples, the total capacity of C , the arrival rate of t , the set of prices S p , the penalty rate r and the probability of a type II customer reservation ( ) were generated randomly. We also considered two cases of increasing and decreasing prices with respect to time. The histogram of the percentage of increase in expected revenue of OS1 model against that of the benchmark model is depicted in Figure 7. Through these numerical experiments, we studied the type I price of OS1 model at the beginning of the sale horizon against the optimal price of the benchmark model. In all these examples, the type I price happens to be higher or equal to the optimal price of the benchmark model. In fact, our numerical examples support the findings shown in Figure 1. 700
600
500
400 Frequency 300
200
100
0 0-5
5-10
10-15 15-20 20-25 Percentage of increase in expected revenue
25-30
Figure 7. Histogram of the percentage of increase in OS1 and the benchmark models 5. Conclusion and Directions of Future Research In this paper, we developed and studied two dynamic pricing models that allow a firm to oversell its capacity in order to enhance the demand by proposing two prices instead of one. In a specific case, we showed that the expected revenue function is concave with respect to the number of stocks to be sold. This property leads to proving one that at any given time, the optimal price is a non-increasing function of the number of stocks. We also showed the revenue of the proposed models is higher than that of the corresponding benchmark ones. We also observed that the impact of overselling is highly significant in most of our examples. Possible extension of this research include (i) study the structural properties of general OS1 models, (ii) incorporating the learning (updating both the arrival rate and the reservation price distribution as time passes), (iii) allowing cancellation, (iv) incorporating costs for price changes, and (v) considering replenishment option during the sale horizon. In this study, competition was not considered. Incorporating the effect of competition makes our models much more useful for practical purposes.
Appendix 1: 1 [Vt (c 1, c ) Vt (c 1, c )] holds 2 for all c 0 . This is done by constructing a policy to sell up to c units of the capacity over t ,0 , 1 Vt (c 1, c )] . Our approach is similar with an expected revenue not less than [Vt (c 1, c ) 2 Proof of theorem 1. We must show that Vt (c, c )
to that of Zhao and Zheng [15].
Suppose that there are four pools of inventories, labeled as1, 2 , 1 and 2 . At timet , there are c 1 units of capacity in pool 1 , c 1 units in pool 2 , and c units in each of pools 1 and 2 . Let P1 and P2 be the optimal policies of the first price and P1 and P2 be the second price policies for pools1 and 2 respectively. Using these policies for pools 1 and 2 , the total revenue from these pools is [Vt (c 1, c ) Vt (c 1, c )] . For pools 1 and 2 we construct P1 and P2 (by modifying P1 and P2 respectively) and P1 and P2 (by modifying P1 and P2 respectively) that may be suboptimal for selling up to c items in t ,0 , but they together would generate at least the same total revenue as that of pools 1 and 2 . Now, for a realization of the demand process in pool 1 we generate three identical t ,0 , be the realized first price copies for the other three pools. Let p i ( )( p i ( )) , i i t ,0 , be the realized second price process under Pi ( Pi ) , i 1,2 and p ( )( p ( )) , process under Pi ( Pi ) , i 1,2 . Starting from
t , set p 2 ( )
for the first price and p 2 ( )
min p 1 ( ), p 2 ( ) and
p1 ( )
max p 1 ( ), p 2 ( )
min p 1 ( ), p 2 ( )
p1 ( )
max p 1 ( ), p 2 ( ) for the second price until t 0 , the first time when the total
and
number of first type capacity units sold in pool 1 becomes one less than that of pool 1. Let p i ( ) p i ( )(i 1,2) and p i ( ) p i ( )(i 1,2) for (t 0 ,0] . Now it must be shown that together pools 1 and 2 under policies P1 and P1 and P2 and P2 generate exactly the same revenue as pools1 and 2 do under P1 and P1 and P2 and P2 . In time interval t , t 0 , the only time pool1(2) and pool 1 ( 2 ) may generate different revenues is when a customer arrives at and p 1 ( ) p 2 ( ) . There are three possibilities for the arriving customer: i ) She does not buy any unit of the first type capacity in all pools because her reservation price is less than p 1 ( ) or she buys one unit of the second type capacity in all pools. ii ) She buys in each of the four pools one unit of the first type capacity because her reservation price is greater than the first proposed price.
iii ) Because the customers reservation price is between p 1 ( ) and p 2 ( ) , she buys
one unit of the first type capacity in pools1 and 2 and one unit of the second type capacity 1 ). in pools 1 and 2 ( Case (i ) does not make any difference since she does not contribute any revenue to any of the pools or generates p units of revenue in each of the pools. Case (ii ) does not matter either, because the total revenue generated from this customer in pools1 and 2 is p 1 ( ) p 2 ( ) , which is the same as that in pools 1 and 2 . When case (iii ) happens, t 0 is reached. At t 0 , the generated revenue from selling one unit of the first capacity in pools1 and 2 , and that of pools 1 and 2 is equal to p 1 ( ) . This customer buys one unit of the second type capacity in pool 2 and 1 (in the case that pool 2 has not any remained capacity, the customer does not buy from pools 1 and 2 ). Therefore, we can observe that the total generated revenue in pools 1 and 2 is equal to that of pools 1 and 2 . Now, we must show that pools 1 and 2 have enough inventory to satisfy every demand that is satisfied in pools 1 and 2 . By definition, in t , t 0 , the number of first and second type capacity sold in pool 1 ( 2 ) must be the same as in pool 1( 2) . At t 0 , a sale of the first type capacity takes place in pools 1 and 2 , and we have a sale of the second type capacity in pool 1 and 2 (in the case that pool 2 has no more capacity, there is not any sales in pools 1 and 2 ). Immediately after t 0 , the first type capacity in pools 1 and 1 ( 2 and 2 ) are be equal. Therefore, every first or second type customer that is satisfied in pool 1(2) is also satisfied in pool 1 ( 2 ) . Because we assume that C , there isn t any problem to satisfy the second type customers in every pool. In case t 0 never occurs, pool 1 sells at most c 1 units of the first type capacity
t ,0 . In this case, pool 2 sells at most c 1 units of the first because p 1 ( ) p 2 ( ) for type capacity either because otherwise t 0 must have occurred. We have shown that the total revenue in pools 1 and 2 is equal to that of pools 1 and 2 . Now, we have to show that the total penalty paid in pools 1 and 2 is less than or equal to that of pools 1 and 2 . According to the proposed pricing policy, if t 0 does occur, in t 0 we have the same pricing policy in pools1(2) and 2 ( 1 ) . At t 0 , if pool 2 has any remained first type capacity, pools 2 and 1 can sell one unit of the second type capacity to the customer, else they would not sell any unit to the second type customer ( P2 ). After t 0 , the total first and second type capacities that have been sold to the customer in pool 1 would be the same of that in pool 2 , if the first type capacity sold in pool 2 was greater than c 1 . Therefore if and only if the firm paid penalty in pool 2 , the firm might pay penalty in pool 1 . Because pools 1 and 2 pay penalty for one unit more than the pools
1 and 2 (if the firm has to pay any penalty) we can see that the total penalty in pools1 and 2 is more or equal to that of pools 1 and 2 . If pool 2 has no more first type capacity at t 0 , we have only one sale for the first type
capacity in pools1 and 2 , and we have no sale in pools 2 and 1 ( P2
). According to
the pricing policy the total penalty in pools1(2) and 1 ( 2 ) will be equal at the end of the sales period, therefore the total penalty in pools 1 and 2 is equal to that of pools 1 and 2 . In case that t 0 never occurs, because the total first and second type capacities that are sold in pool 2 is equal to that of pool 1 , we would pay penalty in pool 1 if and only if a penalty has to be paid in pool 2 . Because in this case pools 1 and 2 pay penalty for one unit more than pools 1 and 2 (if the firm has to pay any penalty) we can see that the total penalty in pools 1 and 2 is more or equal to that of pools 1 and 2 . In summary, our constructed policies with c units of the first type capacity generates greater or equal revenue as do the optimal pricing policies in pool 1 and 2 with c 1 and c 1 units of the first type capacities. Thus the randomized policy that chooses with equal probability between P1 , P1 and P2 , P2 sells up to c units of capacity can generate 1 expected revenue of [Vt (c 1, c ) Vt (c 1, c )] . 2 We use the concavity property of the expected revenue function to show the inventory monotoocity property of the pricing policy in c . On the other hand, concavity property of the expected revenue function can be useful for determining the optimal first type capacity when the proliferation cost of capacity is linear or convex.
Acknowledgement The authrs thank the referees and also Dr. Abbas Seifi for many constructive comments.
References 1. Biyalogorsky E. et al. (1999), Overselling with opportunistic cancellation, Marketing Science, 18; 605-610. 2. Bitran GR and Mondschein SV. (1995), An application of yield management to the hotel industry considering multiple day stays, Operations Research, 43; 427 443. 3. Bitran GR and Mondschein SV. (1997), Periodic pricing of seasonal products in retailing, Management Science, 43; 64-79. 4. Bitran GR and Caldentey R. (2003), An overview of pricing models for revenue management, Manufacturing and Service Operations Management; 5; 203-230. 5. Brumelle S. L. and McGill J. I. (1993), Airline seat allocation with multiple nested fare classes, Operations Research, 41; 127-137.
6. Chatwin R.E. (2000), Optimal dynamic pricing of perishable products with stochastic demand and a finite set of prices, European Journal of Operation Research, 125; 149-174. 7. Elmaghraby W.and Keskinocak P. (2003), Dynamic pricing in the presence of inventory considerations, Management Science, 49; 1287-1309. 8. Gallego G.and Van Ryzin G.J. (1994), Optimal dynamic pricing of inventories with stochastic demand over finite horizon, Management Science, 40, 999-1020. 9. Lee T. C. and Hersh M. (1993), A model for dynamic airline seat inventory control with multiple seat booking, Transportation Science, 27; 252-265. 10. Kincaid W.M. and Darling D.A. (1963), An inventory pricing problem, Journal of Mathematic Analysis Application, 7;183-208. 11. Littlewood K. (1972), Forecasting and control of passenger bookings, AGIFORS Symposium Proc. 12, Nathanya. 12. Robinson L. W. (1995), Optimal and approximate control policies for airline booking with sequential nonmonotonic fare classes, Operations Resaerch, 43; 252-263. 13. Ross S. M. (1970), Applied probability models with optimization applications, Holden Day, Inc., San Francisco. 14. Subramanian J. et al. (1999), Yield management with overbooking, cancellations and no shows, Transportation. Science, 33; 147-167. 15. Zhao W. and Zheng Y.S. (2000), Optimal dynamic pricing for perishable assets with nonhomogeneous demand, Management Science, 46; 375-388.
This document was created with Win2PDF available at http://www.daneprairie.com. The unregistered version of Win2PDF is for evaluation or non-commercial use only.