MORLEY K., SANTELLA A.: Directing gaze in 3D models with · stylized focus. In Proc. EGSR (2006), pp. 377â387. [DK09] DEGENER P., KLEIN R.: A variational ...
Eurographics Conference on Visualization (EuroVis) 2012 S. Bruckner, S. Miksch, and H. Pfister (Guest Editors)
Volume 31 (2012), Number 3
Interactive Visualization of Generalized Virtual 3D City Models using Level-of-Abstraction Transitions * Amir Semmo
Matthias Trapp
Jan Eric Kyprianidis
Jürgen Döllner
Hasso-Plattner-Institut, University of Potsdam, Germany *
A
B
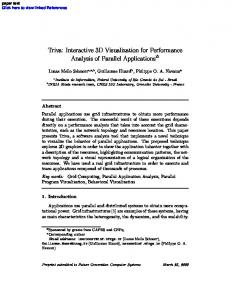
Figure 1: Exemplary result of the visualization system that enables the seamless transition between abstract graphics (A) and a photorealistic version (B) view-dependently. The sequence below shows single frames of this transition. Abstract Virtual 3D city models play an important role in the communication of complex geospatial information in a growing number of applications, such as urban planning, navigation, tourist information, and disaster management. In general, homogeneous graphic styles are used for visualization. For instance, photorealism is suitable for detailed presentations, and non-photorealism or abstract stylization is used to facilitate guidance of a viewer’s gaze to prioritized information. However, to adapt visualization to different contexts and contents and to support saliencyguided visualization based on user interaction or dynamically changing thematic information, a combination of different graphic styles is necessary. Design and implementation of such combined graphic styles pose a number of challenges, specifically from the perspective of real-time 3D visualization. In this paper, the authors present a concept and an implementation of a system that enables different presentation styles, their seamless integration within a single view, and parametrized transitions between them, which are defined according to tasks, camera view, and image resolution. The paper outlines potential usage scenarios and application fields together with a performance evaluation of the implementation. Categories and Subject Descriptors (according to ACM CCS): I.3.3 [Computer Graphics]: Picture/Image Generation—Viewing algorithms I.3.7 [Computer Graphics]: Three-Dimensional Graphics and Realism—
1. Introduction Virtual 3D city models are an integral part of a growing number of applications, systems, and services, and are becoming general-purpose tools for interactively viewing, editing, and distributing geospatial information. Typically, visualization
systems apply a homogeneous graphic style to depict virtual 3D city models: photorealistic rendering is usually used for detailed presentations, or illustrative, abstract rendering to draw attention to prioritized information [SD04]. Using a suitable graphic style can be beneficial for making a visual-
© 2012 The Author(s) Computer Graphics Forum © 2012 The Eurographics Association and Blackwell Publishing Ltd. Published by Blackwell Publishing, 9600 Garsington Road, Oxford OX4 2DQ, UK and 350 Main Street, Malden, MA 02148, USA.
* http://www.hpi3d.de. This is the authors’ version of the work. The definitive version will be available at diglib.eg.org and www.blackwell-synergy.com.
...
A. Semmo et al. / Interactive Visualization of Generalized Virtual 3D City Models using Level-of-Abstraction Transitions
T2
...
E
Feature Class: Trees
Layer 2
...
Cartographic Rendering (Section 3.2.3)
Landmarks
Output
COMBINE
Geometric Transformation
Feature Classification
Resolution 0
Alpha Blending Layers
F
...
D
Multiresolution Models & Feature Types (Section 3.1)
Image Compositing (Section 3.2.4)
Global Transformations (Section 3.2.2)
A
Resolution 1
Input
rgb
Transition Configurations (Section 3.1)
Layer 0
T1
...
T0
LoD Interp. Start Interp. End t0 t1 t2 t3 LoD Interp. Start Interp. End t0 t1 t2 t30.57 Photorealistic 0 Fragment Fragment 0.0 0.0 0.35 0.55 0.79 Silhouettes 1 Fragment Object 0.35 0.55 0.75 0.75 1.0 Generalized 2 Object Object 0.75 0.75 1.0 1.0
Layer 1
Cartographic Shading
ID Style ID
B
Saliency Metrics (Section 3.2.1)
C
Layer 2
s
Layer 1
...
ζ(s,t0,t1,t2,t3)
Layer 0
Layer 1
Layer 0
η(cs,ce,SC(f))
Blend Functions (Section 3.2.1)
1 dζ
ζs ζp
0 t0
s t1
Figure 2: Overview of the present system’s approach of LoA transitions for virtual 3D city models. (A) Feature classification using semantic information, (B/C) blend value computation based on saliency metrics (multipass), (D) global transformation of landmarks, (E) cartographic shading (multipass), (F) order-independent image blending and compositing. The transition configurations are used by components B-F. ization meaningful in its corresponding context and usage scenario [Mac95]. For instance, detailed presentations can aid the exploration of local environments, whereas 2D maps can be an effective medium for navigational purposes. Systems like Google Maps or Bing Maps integrate different graphic styles to serve users with a presentation suitable for viewing maps or getting driving directions. Because these systems provide high interactivity, a user’s task and context, such as viewing situations and regions-of-interest (RoIs), can be dynamically changed. Typically, a user is able to switch the graphic style to display more or less detail in RoIs or context regions to avoid cluttered information. However, concurrent visualization leads to constant reorientations and additional cognitive load [JD08] because of hard transitions between the graphic style, level-of-detail (LoD), and view perspective. Therefore, a great potential lies in the seamless combination of various graphic styles into a single view to communicate only relevant information, thus directing a viewer’s gaze by salient stimuli attraction (saliency-guided visualization). A seamless combination of generic 2D and 3D graphic styles in a visualization pipeline by means of computer graphics is yet to be achieved. One approach is to select a level-of-abstraction (LoA) in a context-dependent way. LoA refers to the spatial and thematic granularity at which model contents are represented, and extends geometric abstraction (LoD) by visual abstraction (e.g., using shading effects) [GD09]. Relevant techniques use image blending or de-
formation (e.g., for focus+context visualization) to highlight RoIs [CDF∗ 06,MDWK08,LTJD08,QWC∗ 09], but (1) do not provide different LoAs for selected entities and prioritized information, and (2) blend only two graphic styles, or are domain-specific (e.g., routes [QWC∗ 09]). This motivates a system approach that is designed to integrate multiple, customized graphic styles in a context-dependent way. This paper presents a concept and an implementation for a system that enables different graphic styles, their seamless integration, and parametrized transitions. The system selects the LoA used to represent 3D city model entities in a taskdependent, view-dependent, and resolution-dependent way (Figure 1). Being based on shader technology and multi-pass rendering, the system seamlessly integrates into common visualization pipelines, providing context-dependent visualization for novel visualization techniques and geoinformation systems (GIS). The system can be further used to author and visualize smooth LoA transitions to improve important applications in geovirtual environments: in particular, map viewing, wayfinding, and locating businesses. To summarize, this work makes the following contributions: 1. A concept and an implementation for a system that enables seamless combinations of various 2D/3D graphic styles. 2. A model for the parametrization of transitions of graphic styles in a visualization pipeline (Figure 2). 3. Usage scenarios using cartography-oriented design to demonstrate the benefits of the system. © 2012 The Author(s) © 2012 The Eurographics Association and Blackwell Publishing Ltd.
A. Semmo et al. / Interactive Visualization of Generalized Virtual 3D City Models using Level-of-Abstraction Transitions
2. Related Work Visualizing virtual 3D city models by LoA transitions is related to several previous works in the domains of nonphotorealistic rendering, context-aware abstraction, and animated transitions and geomorphing. 2.1. Non-Photorealistic Rendering A stylization of virtual 3D city models uses non-photorealistic rendering techniques [GGCS11] to reduce visual complexity. Döllner and Walther [DW03] visualized virtual 3D city models with abstract graphics using procedurally generated, stylized facades of 3D building models. The system in the present paper uses edge enhancement in image-space [ND03] and object-space [DW03] to achieve an expressive rendering of 3D building models. In contrast to previous work, this system enhances edges view-dependently to highlight entities of interest. Examples of the stylization of landscapes are panorama maps of terrain models and their relief presentation [BST09]. The system presented in this paper is able to stylize terrain models with a cartography-oriented design using slope lines and shadowed hachures [BSD∗ 04]. In addition, it is capable of parametrizing and combining these styles within a single view for cartographic 3D city presentations. 2.2. Context-aware Abstraction A context-aware abstraction has the potential to improve the perception of important or prioritized information [SD04]. Major related work is found in focus+context and semanticsbased visualization, which aims to combine and parametrize different graphic styles into a single view. Focus+Context Visualization. Highlighting important information in foci while maintaining a context is subject to focus+context visualization. Applications of focus+context visualization of virtual 3D city models are generalization lenses [TGBD08] and cell-based geometric generalization [GD09]. Highlighting can be further amplified by using semantic depth-of-field (SDOF) [KMH01]. Techniques relevant to the approach of this work used stylized foci to move the focus of a viewer to certain locations of an image [SD04, CDF∗ 06, LTJD08]. The presented system extends these works to (1) enable smooth transitions between levels of structural abstraction with (2) a context-dependent selection of LoAs using saliency metrics defined per feature type, and (3) their dynamic parametrization at run-time. In addition, the system provides cartography-oriented, thematic visualization using different LoAs for selected model entities or RoIs. Further relevant work visualized 3D geovirtual environments with high detail and applied deformation techniques [MDWK08, DK09] or focus+context zoooming [QWC∗ 09] to magnify RoIs and scale landmarks along routes to increase visibility of important information. The system presented here, by contrast, maintains cartographic relations in stylized foci and instead visualizes with cartographyoriented design to reduce visual clutter in context regions © 2012 The Author(s) © 2012 The Eurographics Association and Blackwell Publishing Ltd.
and support saliency-guided visualization. Because the system seamlessly integrates into a visualization pipeline, it can be used to implement these techniques to increase visibility in RoIs. In addition, it generalizes context regions and can therefore enhance focus+context zooming. Semantics-based Visualization. One approach to parametrize visualization of model contents is a semantics-based image abstraction [YLL∗ 10]. To adapt a visualization to model contents, CityGML [Kol09] introduced a semanticsdriven classification and exchange format that has been standardized by the OGC and is accepted by a growing number of GIS software vendors. In the system presented here, semantic information is derived from material and texture information, or defined explicitly at run-time to enable a customized parametrization of visual attributes. Brewer [Bre94] proposed conventions for using colors in cartography-oriented design. The system presented here uses qualitative color schemes to represent entity types of city models. 2.3. Transitions for Level-of-Abstraction Alpha blending, animation, and geomorphing are common visualization techniques to enable smooth transitions between graphic styles in context-aware abstraction. Alpha Blending. A well-known method for image compositing is alpha blending [PD84], which is used in multiperspective rendering to enable a “quasi”-continuous transition between focus and context regions [MDWK08, LTJD08]. The system presented in this paper uses cumulative alpha blending to blend multiple RoIs with varying LoA. Animation. An alternative approach for smooth transitions is to animate visual and structural changes. Previous work in information visualization showed that animated transitions ease orientation and guidance [RCM93, TMB02, HR07], and aid the reconstruction of information spaces [BB99]. Moreover, animated transitions “improve graphical perception of changes between statistical data graphics” [HR07], facilitate understanding and increase engagement. In the system presented here, global deformations of 3D building models are animated to enable predictable transitions between detailed and cartographic visualization of landmarks [EPK05]. Morphing. Morphing is a visual effect that enhances animations by smooth transitions between models with varying resolution [LDSS99, SD96]. For instance, geomorphing was used in continuous LoD of digital terrain models [Hop98, Wag03] to provide smooth transitions and temporal coherence. However, morphing is based on assumptions about the geometric representations and can only be applied to 3D objects with a suitable geometry. By contrast, virtual 3D city models, in general, cannot fulfill such assumptions. Moreover, morphing of 3D city models has to take cartographic generalization [Mac95] into account. Previous work on continuous LoD exemplified how smooth, view-dependent transitions can be achieved using collapsing as the pre-dominant generalization operator [LKR∗ 96, Hop98].
A. Semmo et al. / Interactive Visualization of Generalized Virtual 3D City Models using Level-of-Abstraction Transitions
w1 = 0.2
w2 = 0.5
α
Figure 4: Continuous LoA for textured green spaces: near distance (A), mid-range distance (B), far distance (C).
FDoG
w0 = 0.9
rgb Quantized
Original
Feature ID Type ... ... 438 Building 439 Street 440 Water Surface 441 Building ... ...
Figure 3: Geospatial data processed by the system: multiresolution models (A), semantic information (B), landmarks with interest values wi and best-views (C), stylized textures (D). 3. Method An overview of the system presented in this paper is shown in Figure 2. The input data consists of textured multiresolution 3D models (Figure 3A) and task-dependent transition configurations. These models are typically defined as triangular irregular networks (e.g., acquired by remote sensing, procedural generation, or manual modeling). The 3D models are composed of features (i.e., abstractions of real-world phenomena [ISO]) that are categorized using a feature taxonomy, and grouped according to their appearance (Section 3.1). Based on this information, the system performs visual abstraction (Section 3.2): • by geometric transformation of features (LoD), • and by cartographic shading (LoA), such as waterlining, signatures for green spaces, and abstract building facades. To perform context-dependent visualization, features are rendered multiple times using different graphic styles that are continuously blended. To each graphic style of a certain feature used for visualization, interest values are assigned that are computed at rendering time using saliency metrics, such as viewing distance, view angle, or region interest (Section 3.2.1). These interest values are computed for all visible and non-visible (i.e., occluded) fragments of a feature. After a normalization, these are used as blend values to compose the final image by order-independent image blending [PD84]. The remainder of this section describes the stages of the transition pipeline and its architecture in detail. 3.1. Pre-processing Geospatial Data To enable LoA transitions for complex scenes, such as virtual 3D city models, global information about a model’s features is required: a feature type, location in the 3D scene, global interest, and how visual attributes adapt to user interaction (intelligence of objects [MEH∗ 99]). The pre-processing of this information is explained in the remainder of this section. Scenario Definition. The system presented in this paper is based on usage scenarios that define how a 3D scene is visualized for a given task and how graphics are dynamically adapted to a user’s context. A scenario consists of a set of
features with unique interest values and a set of transition configurations that define rules and constraints for LoA transitions. To enable a parametrization of graphic styles for each feature, information about a feature’s type (i.e., building, green space, street, water, or terrain) and sub-type (e.g., coniferous forest, deciduous forest) is stored (Figure 3B). Thereby, the system enables cartography-oriented design, leading to improved perception of context information [JD08]. The required semantic information can be derived automatically from texture and material information by grouping features with similar appearance. Alternatively, semantic information can be provided manually at run-time or as part of the model data (e.g., CityGML [Kol09]). Parts of the input data are best-view directions of buildings and sites to enable a cartographic visualization of landmarks [EPK05, GASP08]. The definition of landmarks is context-dependent [GASP08], using interest values defined per feature (Figure 3C). The computation of these records is not limited to pre-processing, but can be updated at runtime if models are added or removed from a 3D scene, or if a user’s interest in a specific feature type changes. Thereby, the system maintains interactivity and context-dependent visualization. Transition Configuration. Transitions between graphic styles are implemented by rendering features multiple times and compositing the intermediate results using image blending [PD84]. This approach was chosen because it is generic and simplifies the extension of the system with new graphic styles. The sequence of graphic styles can be configured at three levels: • A scope defines if a graphic style applies to a certain interest in a feature. • The transition is parametrized with a fragment-, objector group-based interpolation. For this purpose, the axisaligned bounding box of each feature is stored. • The parametrization of the LoD and LoA, such as by color, texture abstraction, and edge enhancement. Thereby, the system enables a user-defined visual abstraction of features. Figure 2 (top left corner) exemplifies a transition configuration for tree models. Image Abstraction. A bilateral and difference of Gaussians (DoG) filter [KD08] is utilized to automatically stylize textures in a pre-processing stage. The input textures are first converted to mip maps [Wil83], and then processed for each level separately. This provides a continuous LoA of textured © 2012 The Author(s) © 2012 The Eurographics Association and Blackwell Publishing Ltd.
A. Semmo et al. / Interactive Visualization of Generalized Virtual 3D City Models using Level-of-Abstraction Transitions
Figure 5: Exemplary saliency metrics defined by the system: view distance (A), view angle (B) and region interest (C). The debug outputs show areas of a 3D scene to be visualized with high detail (black) and low detail (white), respectively. surfaces (Figure 4), while using standard capabilities of graphics hardware [Wil83]. In contrast to [KD08], the output of the edge enhancement is not combined with the quantized color output (Figure 3D). Instead, color and outline are blended at rendering time for individual parametrization. The image abstraction is performed once per model. For a 3D city model (CityGML LoD3 [Kol09]) with 1, 520 unique texture maps, each with an average resolution of 128 × 128 pixels, this process takes ∼20 minutes (using the first hardware configuration and Chemnitz model described in Section 4). 3.2. Rendering The rendering comprises the following steps: (1) computing the interest of features for a user’s task and context, such as defined by the viewing perspective and region interest, (2) visual abstraction depending on the features’ interest, and (3) image compositing. 3.2.1. Computing Interest using Saliency Metrics The thematic categorization (Section 3.1) is used to stylize information with high interest (high salience) differently from information with low interest (low salience). The present system interprets a high interest in a feature by selecting photorealistic graphics, and a low interest by selecting abstract graphics for rendering respectively, where interest values in-between yield a mix of graphic styles. To identify areas to be visualized with high detail, the interest value for each visible feature is computed using saliency metrics, such as view distance, vertical view-angle, and region interest (Figure 5). Other metrics can be added as long as they are normalized. For instance, view metrics can be defined by normalized Euclidean distances and angles as is shown in Figure 5. The region interest is represented by a distance map that is computed using the jump-flooding algorithm [RT06], and is used to visualize RoIs or routes through a virtual 3D city model [TGBD08]. The computation of distance maps is © 2012 The Author(s) © 2012 The Eurographics Association and Blackwell Publishing Ltd.
A
B
C
D
1
T0
Photorealistic
T1
Silhouettes
T2
Generalized
0 1 0 1
b0
Smooth Transition
b1 Hard Transition
0
b2
Figure 6: Examplary transition states for tree models. based on the assumption that the terrain in the locality of the camera can be approximated by a plane (Figure 5). In contrast to previous techniques [CDF∗ 06, MDWK08, LTJD08], the system presented here enables multivariable transitions based on interest values and saliency metrics, resulting in increased flexibility. For instance, a weighted blending between view distance and view angle can be defined to prevent high detail presentations in bird’s eye views with a near viewing distance. A transition between graphic styles is based on image blending [PD84]. Blend values are computed for each transition configuration, and features with matching feature types and LoD. This procedure is performed during scene graph traversal on the CPU (Algorithm 1), and by using linear or smooth blend functions on the GPU (Figure 2C). The validity range of each transition configuration determines the blend value of a graphic style for a feature of certain interest. Depending on how the threshold values for two successive transition configurations are defined, two general cases can be identified (Figure 6): 1. Smooth transition. A smooth transition from one graphic style to another can be defined by the fade-out interval and fade-in interval of two successive transition configurations. A smooth transition between two graphic styles is enabled
A. Semmo et al. / Interactive Visualization of Generalized Virtual 3D City Models using Level-of-Abstraction Transitions A
B
C
D
E
Figure 7: Transformation of landmarks: scaling (A), rotation to best-view (B), flattening (C), billboard transformation (D). Algorithm 1: Extended scene graph traversal (CPU) Input: A usage scenario S with features {Fi } and transition configurations {T j } 1 2 3
4
forall the t ∈ {T j } do forall the f ∈ {Fi } do if feature type of f and t match and LoD of f and t match and f is inside validity range of t (=not culled) then Render f and apply graphic style of t end
5
end
6 7
end
using the smoothstep function within these two intervals (Figure 6A-C). 2. Hard transition. For certain configurations, discrete LoA transitions are appropriate – for instance, if two graphic styles lead to distorted color tones [GW07]. Hard transitions are enabled if the overlap of a fade-in and fade-out interval is set to zero (Figure 6C-D). For the computation of blend values, three interpolation modes are distinguished: (1) a fragment-based interpolation for smooth transitions within 3D features, (2) an object-based interpolation with blend values applied uniformly to a feature by using the center of a feature’s axis-aligned bounding box as focus point, and (3) a group-based interpolation with a shared focus point among features – for instance, to replace tree instances by a coarse geometry representing woodland. 3.2.2. Global Transformations Certain buildings and sites within a virtual environment serve as landmarks (i.e., reference points with a characteristic appearance or location, or user’s interest). The visualization of landmarks is essential for localization, orientation and navigation [GASP08]. To this end, the system presented here provides a map-like visualization of landmarks, using global deformation applied prior to rasterization. The flattened landmarks are rotated to face the user’s viewing direction according to their best-views. For buildings, best-views often face the street or main entrance and are approximated using viewpoint entropy [VFSH04]. To obtain a deformed landmark in world space coordinates, the following four steps are performed on a per-vertex basis during rendering: 1. Landmark scaling. Landmarks are scaled to improve their visibility in far view distances (Figure 7A-B). A weighted
smoothstep function is used to compute the scale factor. To avoid over cluttering, landmarks are smoothly faded-out according to their interest values. 2. Rotation to best-view. Landmarks are pitched so that their best-view direction horizontally coincides with the virtual camera’s view direction (Figure 7B-C). 3. Object flattening. Landmarks are flattened in depth; that is, their vertices are projected to the plane facing the horizontal view direction (Figure 7C-D). 4. Cylindrical billboard transformation. The flattened landmark is yawed by the camera elevation to vertically face the view direction (Figure 7D-E). The system linearly blends original and transformed vertices based on a feature’s interest using shader technology (GPU). Thus, further transformation techniques can be seamlessly integrated, such as global deformation to increase visibility in RoIs [MDWK08,DK09,QWC∗ 09] or terrain geomorphing [Wag03]. Furthermore, the system smoothly shrinks nonlandmarks and translates them below the terrain to remove extraneous information for map-like visualization (Figure 1). 3.2.3. Cartographic 3D City Presentations To demonstrate the system’s ability to integrate customized 2D and 3D graphic styles, several abstraction techniques are authored to achieve thematic visualization in context regions. The thematic categorization (of Section 3.1) is used to stylize features by non-photorealistic rendering techniques: Building models. Stylized texture maps, as discussed in Section 3.1, are used to provide a continuous LoA of building facades. With increasing distance or viewing angle, subtle details are smoothly coarsened. Street networks. Street networks are stylized using cartographic color schemes [Bre94]. Important edges are enhanced using an image-space edge enhancement technique [ND03]. In general, the system seamlessly integrates street labels using distance maps that are blended on graphics hardware. For this, the authors enhanced Green’s [Gre07] rendering technique to align and scale street labels in a view-dependent way. Water surfaces. Water surfaces are visualized using a novel waterlining shading technique that is based on distance maps [RT06]. The technique visualizes waterlines with non-linear intervals to propagate distance information (Figure 8A). Green spaces and trees. As for buildings, stylized texture maps are used for continuous LoA (Figure 4). In addition, signatures are visualized using texture bombing © 2012 The Author(s) © 2012 The Eurographics Association and Blackwell Publishing Ltd.
A. Semmo et al. / Interactive Visualization of Generalized Virtual 3D City Models using Level-of-Abstraction Transitions
A
C
B
Coniferous Forest
D
Mixed Forest
Figure 8: Stylization techniques for water surfaces (A), green spaces (B), tree models (C) and digital terrain models (D). and parametrized to represent tree species (Figure 8B). For this, the authors developed an enhanced variant of Glanville’s [Gla04] texture bombing algorithm that ensures signatures always face the viewing direction. Tree models are stylized using view-dependent enhancement of silhouettes [DS00]. Technically, point sprites were used and the differences of depth values thresholded to enhance silhouettes in image-space (Figure 8C).
Algorithm 2: Image compositing using shaders (GPU) Input: Buffered color, alpha and depth values per pixel Output: Blended color values per pixel 2
begin color ← background color;
3
count ← #SAMPLES;
4
for n ← 0, #SAMPLES − 1 do depths[n] ←fetchABufferDepth(n);
1
5
Digital terrain models. Digital terrain models are visualized as relief presentations using loose lines, slope lines, and shadowed hachures [BSD∗ 04] (Figure 8D). Generic models. Generic stylization is applied to miscellaneous features, such as city furniture. A combination of stylized texture maps, edge enhancement in image-space [ND03] and object-space [DW03], and thematic colorization [Bre94] is used. 3.2.4. Image Compositing The final image is composed using alpha blending [PD84]. Technically, a stencil routed A-buffer [MB07] is used, since it is able to buffer fragments in depth at real-time frame rates. Because certain features have a high complexity in depth (e.g., foliage of trees), the system provides the capability to render features off-screen into a Ping-Pong buffer. It comprises two render textures, uses a depth test, and switches its render texture for successive graphic styles. For image compositing, the output of both textures is blended and combined with the information of the A-buffer. To improve the rendering performance, the A-buffer sorting [MB07] is enhanced using a dynamic image composition (Algorithm 2). Fragments with depth values d = 1 are excluded so that only routed samples are blended (see Algorithm 2, lines 4-7). The system then improves shape and depth perception by unsharp masking the depth buffer [LCD06]. To reduce ringing artifacts, the method is enhanced by locally weighting depth differences according to the alpha values. 4. Applications and Evaluation The system presented here was implemented using C++, OpenGL and GLSL. Two platforms were used for performance evaluation: (1) an Intel® Xeon™ 4× 3.06 GHz with 6 GByte RAM and NVidia® GTX 560 Ti GPU with 2 GByte VRAM, and (2) an Intel® Core2Duo™ 2× 3.0 GHz with 4 GByte RAM and NVidia® GTX 460 GPU with 1 GByte VRAM. To show the effectiveness of the system, usage scenarios were authored for the virtual 3D city model of Chemnitz (Germany) with 458 features, 223, 743 vertices, 176, 601 © 2012 The Author(s) © 2012 The Eurographics Association and Blackwell Publishing Ltd.
count ← count − bdepths[n]c;
6 7
end
8
for n ← 0, count do colors[n] ←fetchABufferColor(n);
9 10
end
11
blendPingPongFBO(colors[count], depths[count]);
12
count ← count + 1;
13
SortColorByDepth(colors, depths, count);
14
for n ← count − 1, 0 do color ← mix(color.rgb, colors[n].rgb, colors[n].a);
15
end
16 17
end
faces, and 1, 520 texture maps (Figure 1 and Figure 9A-D); another 3D city model with 532 objects, 63, 630 vertices, and 40, 993 faces (Figure 9E); and a virtual landscape model of Mount St. Helens (Figure 9F). To improve the rendering performance, view-frustum and back-face culling were enabled, and geometry instancing applied for the vegetation objects. For order-independent blending, an A-buffer with 8 samples was used. 4.1. Usage Scenarios This section demonstrates the benefits of the system in applications of 3D geovirtual environments, such as map viewing, business locating, navigation, and wayfinding. Further, thematic visualization was used to provide a cartographic presentation (Section 3.2.3). Despite the manual selection of the LoA (Figure 9A), viewdistance-based transitions were authored to visualize features near the virtual camera at high detail, and distant features in an abstracted way (Figure 9B). This approach can be of interest in highly dynamic and ubiquitous information systems. For instance, mobile navigation systems could use this visualization to present places close to a viewer’s position with high detail for local orientation assistance, and places far away with less detail and emphasized landmarks for navigational
A. Semmo et al. / Interactive Visualization of Generalized Virtual 3D City Models using Level-of-Abstraction Transitions
A
B
D
E
B
C
F
Figure 9: Exemplary applications authored with the visualization system: manual LoA selection (A), distance-based transitions (B), route highlighting (C), and circular RoIs (D-F). assistance. Thereby, the exploration of complex virtual environments can be improved, in general, since the viewer is not required to switch between a 3D perspective view and a map view, as common in map view services like Google Maps. Because of emphasized features in the foreground, it further facilitates direction guidance of a viewer’s gaze [CDF∗ 06] while preserving context information in the background. Combined with the vertical viewing angle as saliency metric (Section 3.2.1), detailed and map-like visualization can be seamlessly blended. The present system used a map-like visualization to highlight thematic information (e.g., landmarks, labeled roads, green spaces, and water surfaces), leveraging the capability of the system to implement cartographic color schemes [Bre94] and non-photorealistic rendering techniques (Section 3.2.3). This is useful for 3D car navigation systems because only the most relevant information is communicated in areas of high information compression (e.g., in the background of perspective views [JD08]). Further, orientation assistance is provided by seamlessly integrating 3D illustrations of landmarks. Furthermore, the driving speed could be used as metric to dynamically select the LoA used for visualization. Wayfinding is an important task for virtual environments and can be improved by the proposed system using saliency metrics for LoA transitions (Section 3.2.1). Features can be highlighted along routes to attract and direct a viewer’s focus – for instance, as a navigational aid to guide a user to a destination or RoI (Figure 9C). Within this application domain, the system can provide improvements over previous techniques designed for occlusion-free route visualization [QWC∗ 09, MDWK08] because these neglect information abstraction in context regions. In addition, the system parametrizes LoA transitions at run-time. This can be used to Table 1: Performance evaluation measured in frames-persecond for three virtual environments and screen resolutions. The evaluation was performed on two platforms (Section 4). Model / Screen Res.
1920 × 1080
1280 × 720
Chemnitz MegaCity Mt. St. Helens
5.7 14.2 46.5
5.8 17.2 72.2
5.0 13.1 36.8
5.2 16.6 57.6
800 × 600 6.1 20.4 87.8
5.3 20.1 78.2
highlight selected information of database queries for analysis purposes. Moreover, there is potential to use the system for the visualization of (time-based) model variants. Furthermore, the system is feasible to visualize RoIs as blue prints and seamlessly combine these with high-detail graphic styles in the context area (Figure 9E). Applications designed for urban planning could use this visualization to highlight complex structures or architectural features of 3D building models. 4.2. Saliency-guided Visualization To demonstrate the advantage of saliency-guided visualization as provided by the system, the authors compared saliency maps of the system’s output and homogeneous high-detail visualization typical for mass-market systems (e.g., Google Earth). As can be seen in Figure 10, visual saliency of homogeneous graphic styles is distributed across focus and context regions. By contrast, visualization of the system presented in this paper yields concentrated high saliency within a circular RoI and for single landmarks in the context area. In case of saliency-guided route visualization, the saliency follows the route due to high frequencies in color, orientation, and depth. 4.3. Performance Evaluation The performance tests were conducted for the aforementioned platforms, virtual environments, and usage scenarios. The test results in Table 1 show that the system provides interactive frame rates in HD resolution. It was observed that the performance depends on the total number of transition configurations defined for a usage scenario. For instance, a view-distance-based transition performs, in mean, 27.5% slower than a visualization with a homogeneous graphic style. Further, it was observed that the system is fill-limited, with a performance increase of 75% (in mean) when using a resolution of 800 × 600 pixels over 1920 × 1080 pixels. For the city of Chemnitz, it was observed that the system is CPUlimited because of the rendering engine being limited to a single-threaded traversal of the scene graph. Moreover, the results for Mount St. Helens show that the system can handle 3D scenes with high visual complexity in full HD resolution at real-time frame-rates. © 2012 The Author(s) © 2012 The Eurographics Association and Blackwell Publishing Ltd.
A. Semmo et al. / Interactive Visualization of Generalized Virtual 3D City Models using Level-of-Abstraction Transitions Highlighted circular region-of-interest
Highlighted route
Output
Detailed visualization (no highlighting)
1.0
Saliency
Saliency Map
0.8
0.6
0.4
0.2 0.0
Figure 10: Examples showing a circular RoI and a highlighted route within the city of Chemnitz, compared to a detailed version. The bottom row shows the respective saliency maps using the algorithm of graph-based visual saliency [HKP07]. The memory consumption (VRAM) of our system mainly depends on the A-buffer (32bit color, 24bit depth, and 8bit stencil values per sample), the Ping-Pong buffer (32bit color and 32bit depth values per pixel), and the geometry buffer (32bit edge map, 32bit ID map, and 32bit normal map): M=
W · H · (2N + 7) MB, 262, 144
where W and H refer to screen resolutions in pixels, and N to the number of samples used by the A-buffer. 4.4. Lessons Learned The system is currently used in the authors’ research group as a platform for implementing novel visualization techniques designed for 3D geovirtual environments. During development and authoring of usage scenarios, it was observed that the parametrization of the system can be cumbersome. Motivated by this, functionality to serialize transition configurations, feature classifications, and parametrizations of graphic styles was added to the system, to be able to maintain designs in libraries and easily deploy usage scenarios. It was further observed that development of new graphic styles can become time consuming. Therefore, a shader editor was integrated into the system, which facilitates modification of vertex, geometry, and fragment shaders at run-time. Moreover, the performance evaluation indicates that a single-threaded rendering engine has impact on the system’s interactivity. Therefore, the authors plan to port the system to a rendering engine that supports multi-threading. Finally, the approach to buffer fragments in depth is memory consuming and requires sufficient samples, or additional rendering passes using occlusion queries [MB07] to avoid visual artifacts. The proposed Ping-Pong buffer only resolves this issue if features are rendered opaquely. © 2012 The Author(s) © 2012 The Eurographics Association and Blackwell Publishing Ltd.
5. Conclusions and Future Work This paper presents a concept and an implementation of a system that visualizes virtual 3D city models with parametrized level-of-abstraction transitions for a seamless combination of various graphic styles in a single view. The system provides interactive, saliency-guided visualization by coupling saliency metrics with cartographic rendering techniques. It is extensible by custom 2D and 3D graphic styles, integrates into a visualization pipeline, and can be used to improve existing visualization techniques (e.g., based on focus+context zooming [QWC∗ 09] and deformation [MDWK08]). Usage scenarios based on the system’s capability for thematic visualization demonstrate the system’s benefits for typical applications of geovirtual environments – in particular, map viewing, business locating, navigation, and wayfinding. Since the system operates in 3D space, it can be used to enhance the x-ray volumetric lens effect [VCWP96] for indoor visualization. Visualization on mobile devices also has high potential to benefit from the system because level-ofabstraction can reduce information compression on displays with limited size. Finally, saliency maps of the presented results show that the system is feasible to draw attention to important information, though this requires further validation. Therefore, the authors plan to conduct a user study to confirm this hypothesis. Acknowledgments The authors would like to thank the anonymous reviewers for their valuable comments. References [BB99] B EDERSON B. B., B OLTMAN A.: Does animation help users build mental maps of spatial information? In Proc. IEEE InfoVis (1999), pp. 28–35.
A. Semmo et al. / Interactive Visualization of Generalized Virtual 3D City Models using Level-of-Abstraction Transitions [Bre94] B REWER C. A.: Color Use Guidelines for Mapping and Visualization. Elsevier Science, 1994, ch. 7, pp. 123–147. [BSD∗ 04] B UCHIN K., S OUSA M. C., D ÖLLNER J., S AMAVATI F., WALTHER M.: Illustrating terrains using direction of slope and lighting. In ICA Mountain Carthography Workshop (2004), pp. 259–269. [BST09] B RATKOVA M., S HIRLEY P., T HOMPSON W. B.: Artistic rendering of mountainous terrain. ACM Trans. Graph. 28 (2009), 102:1–102:17. [CDF∗ 06] C OLE F., D E C ARLO D., F INKELSTEIN A., K IN K., M ORLEY K., S ANTELLA A.: Directing gaze in 3D models with stylized focus. In Proc. EGSR (2006), pp. 377–387. [DK09] D EGENER P., K LEIN R.: A variational approach for automatic generation of panoramic maps. ACM Trans. Graph. 28 (2009), 2:1–2:14. [DS00] D EUSSEN O., S TROTHOTTE T.: Computer-generated penand-ink illustration of trees. In Proc. ACM SIGGRAPH (2000), pp. 13–18. [DW03] D ÖLLNER J., WALTHER M.: Real-time expressive rendering of city models. In Proc. IEEE InfoVis (2003), pp. 245–250. [EPK05] E LIAS B., PAELKE V., K UHNT S.: Concepts for the cartographic visualization of landmarks. In Proc. LBS and Telecartography (2005), pp. 149–155. [GASP08] G RABLER F., AGRAWALA M., S UMNER R. W., PAULY M.: Automatic generation of tourist maps. In Proc. ACM SIGGRAPH (2008), pp. 100:1–100:11. [GD09] G LANDER T., D ÖLLNER J.: Abstract representations for interactive visualization of virtual 3D city models. Computers, Environment and Urban Systems 33, 5 (2009), 375–387. [GGCS11] G OOCH A., G OOCH B., C OSTA -S OUSA M.: Illustrative Visualization: The Art and Science of Non-Photorealistic Rendering. A.K. Peters, 2011. [Gla04] G LANVILLE R. S.: Texture bombing. In GPU Gems. Addison-Wesley, 2004, pp. 323–338. [Gre07] G REEN C.: Improved alpha-tested magnification for vector textures and special effects. In ACM SIGGRAPH Courses (2007), pp. 9–18. [GW07] G IEGL M., W IMMER M.: Unpopping: Solving the imagespace blend problem for smooth discrete LOD transitions. Comput. Graph. Forum 26, 1 (2007), 46–49. [HKP07] H AREL J., KOCH C., P ERONA P.: Graph-based visual saliency. Advances in Neural Information Processing Systems 19 (2007), 545–552. [Hop98] H OPPE H.: Smooth view-dependent level-of-detail control and its application to terrain rendering. In Proc. IEEE Vis (1998), pp. 35–42. [HR07] H EER J., ROBERTSON G.: Animated transitions in statistical data graphics. In Proc. IEEE Vis (2007), pp. 1240–1247. [ISO] ISO 19101:2002: Geographic information - Reference model. Tech. rep., ISO, Geneva, Switzerland. [JD08] J OBST M., D ÖLLNER J.: 3D city model visualization with cartography-oriented design. In Proc. REAL CORP (2008), pp. 507–516. [KD08] K YPRIANIDIS J. E., D ÖLLNER J.: Image abstraction by structure adaptive filtering. In Proc. EG UK TPCG (2008), pp. 51–58. [KMH01] KOSARA R., M IKSCH S., H AUSER H.: Semantic depth of field. In Proc. IEEE InfoVis (2001), pp. 97–104. [Kol09] KOLBE T. H.: Representing and exchanging 3D city models with CityGML. In 3D GeoInformation Sciences (2009), pp. 15–31.
[LCD06] L UFT T., C OLDITZ C., D EUSSEN O.: Image enhancement by unsharp masking the depth buffer. In Proc. ACM SIGGRAPH (2006), pp. 1206–1213. [LDSS99] L EE A. W. F., D OBKIN D., S WELDENS W., S CHRÖDER P.: Multiresolution mesh morphing. In Proc. ACM SIGGRAPH (1999), pp. 343–350. [LKR∗ 96] L INDSTROM P., KOLLER D., R IBARSKY W., H ODGES L. F., FAUST N., T URNER G. A.: Real-time continuous level of detail rendering of height fields. In Proc. ACM SIGGRAPH (1996), pp. 109–118. [LTJD08] L ORENZ H., T RAPP M., J OBST M., D ÖLLNER J.: Interactive multi-perspective views of virtual 3D landscape and city models. In Proc. AGILE (2008), pp. 301–321. [Mac95] M AC E ACHREN A.: How Maps Work. Guilford Press, 1995. [MB07] M YERS K., BAVOIL L.: Stencil routed A-Buffer. In ACM SIGGRAPH Sketches (2007). [MDWK08] M ÖSER S., D EGENER P., WAHL R., K LEIN R.: Context aware terrain visualization for wayfinding and navigation. Comput. Graph. Forum 27 (2008), 1853–1860. [MEH∗ 99] M AC E ACHREN A. M., E DSALL R., H AUG D., BAX TER R., OTTO G., M ASTERS R., F UHRMANN S., Q IAN L.: Virtual environments for geographic visualization: Potential and challenges. In Proc. ACM NPIVM (1999), pp. 35–40. [ND03] N IENHAUS M., D ÖLLNER J.: Edge-enhancement - An algorithm for real-time non-photorealistic rendering. Journal of WSCG 11, 2 (2003), 346–353. [PD84] P ORTER T., D UFF T.: Compositing digital images. In Proc. ACM SIGGRAPH (1984), pp. 253–259. [QWC∗ 09] Q U H., WANG H., C UI W., W U Y., C HAN M.-Y.: Focus+context route zooming and information overlay in 3D urban environments. IEEE Trans. Vis. Comput. Graphics 15 (2009), 1547–1554. [RCM93] ROBERTSON G. G., C ARD S. K., M ACKINLAY J. D.: Information visualization using 3D interactive animation. Commun. ACM 36 (1993), 57–71. [RT06] RONG G., TAN T.-S.: Jump flooding in GPU with applications to voronoi diagram and distance transform. In Proc. ACM I3D (2006), pp. 109–116. [SD96] S EITZ S. M., DYER C. R.: View morphing. In Proc. ACM SIGGRAPH (1996), pp. 21–30. [SD04] S ANTELLA A., D E C ARLO D.: Visual interest and NPR: an evaluation and manifest. In Proc. NPAR (2004), pp. 71–150. [TGBD08] T RAPP M., G LANDER T., B UCHHOLZ H., D ÖLL NER J.: 3D generalization lenses for interactive focus + context visualization of virtual city models. In Proc. IEEE IV (2008), pp. 356–361. [TMB02] T VERSKY B., M ORRISON J. B., B ETRANCOURT M.: Animation: can it facilitate? Int. Journal of Human-Computer Studies 57 (2002), 247–262. [VCWP96] V IEGA J., C ONWAY M. J., W ILLIAMS G., PAUSCH R.: 3D magic lenses. In Proc. ACM UIST (1996), pp. 51–58. [VFSH04] VÁZQUEZ P.-P., F EIXAS M., S BERT M., H EIDRICH W.: Automatic view selection using viewpoint entropy and its application to image-based modelling. Comput. Graph. Forum 22, 4 (2004), 689–700. [Wag03] WAGNER D.: Terrain geomorphing in the vertex shader. In ShaderX2. Wordware Publishing, 2003. [Wil83] W ILLIAMS L.: Pyramidal parametrics. In Proc. ACM SIGGRAPH (1983), vol. 17, pp. 1–11. [YLL∗ 10] YANG M., L IN S., L UO P., L IN L., C HAO H.: Semantics-driven portrait cartoon stylization. In Proc. IEEE ICIP (2010), pp. 1805–1808.
© 2012 The Author(s) © 2012 The Eurographics Association and Blackwell Publishing Ltd.